
 Open Access Article
 This Open Access Article is licensed under a Creative Commons Attribution-Non Commercial 3.0 Unported Licence
Concentrated electrolytes stabilize bismuth–potassium batteries†
Ruding
Zhang
a,
Jingze
Bao
a,
YuHuang
Wang
b and
Chuan-Fu
Sun
 *a
*a
aCAS Key Laboratory of Design and Assembly of Functional Nanostructures, Fujian Provincial Key Laboratory of Nanomaterials, Fujian Institute of Research on the Structure of Matter, Chinese Academy of Sciences, Fuzhou, Fujian 350002, P. R. China. E-mail: cfsun@fjirsm.ac.cn
bDepartment of Chemistry and Biochemistry, University of Maryland, College Park, Maryland 20742, USA
First published on 18th June 2018
Abstract
Storing as many as three K-ions per atom, bismuth is a promising anode material for rechargeable potassium-ion batteries that may replace lithium-ion batteries for large-scale electrical energy storage. However, Bi suffers from poor electrochemical cyclability in conventional electrolytes. Here, we demonstrate that a 5 molar (M) ether-based electrolyte, versus the typical 1 M electrolyte, can effectively passivate the bismuth surface due to elevated reduction resistance. This protection allows a bismuth–carbon anode to simultaneously achieve high specific capacity, electrochemical cyclability and Coulombic efficiency, as well as small potential hysteresis and improved rate capability. We show that at a high electrolyte concentration, the bismuth anode demonstrates excellent cyclability over 600 cycles with 85% capacity retention and an average Coulombic efficiency of 99.35% at 200 mA g−1. This “concentrated electrolyte” approach provides unexpected new insights to guide the development of long-cycle-life and high-safety potassium-ion batteries.
Introduction
Rechargeable potassium-ion batteries (PIBs) are a promising alternative to lithium-ion batteries (LIBs) for large-scale electrical energy storage because of the abundance of potassium resources, low cost, and environmental benignity.1–7 However, their development has been hindered by the lack of appropriate electrode materials that could reversibly store K-ions.2,6–9 For the cathode, layered transition metal oxides,10–12 transition metal sulfides/phosphates,13–15 and Prussian blue and its analogs have been intensively investigated, and they show promising prospects.4,16–19 In particular, due to a framework structure, Prussian blue and its analogs could effectively accommodate the structural changes induced by K-ion insertion/extraction and exhibit relatively high capacity, cell voltage, and cyclability.4,16–19 For the anode, several materials have been intensively studied, including carbonaceous materials (i.e., graphite, graphene, and hard/soft carbon),3,20–24 organic anode materials,25,26 alloy-type metals (i.e., Sb, Sn, and Sn4P3),27–30 metal oxides/sulfides,31–35 and metal phosphates (i.e., KTi2(PO4)3).36 However, none of these anode materials are yet to achieve electrochemical performances that match that of Prussian blue and its analogs on the cathode side.Very recently, Guo et al. and Chen et al. showed that each bismuth (Bi) can store three K+ maximum via forming a K3Bi alloy.37,38 This alloy reaction, in theory, gives specific and volumetric capacities of 385 mA h g−1 and 1147 mA hcm−3, respectively, both of which are significantly higher than those of graphite, Sn and KTi2(PO4)3 (Fig. 1). Equally important is that this new battery chemistry operates at an average potential of ∼0.6 V versus K/K+, making it intrinsically free from potassium plating which may cause catastrophic battery failure. These merits together with low cost and nontoxic features make Bi a promising candidate anode material for PIBs.37–40 However, similar to other high capacity alloy anodes, the phase transformation from Bi to K3Bi presents a volume expansion of ∼400%. Such a large volume change inevitably decreases the stabilities of both the structure and solid electrolyte interphase (SEI) formed on the Bi surface, inducing rapid capacity decay upon electrochemical cycling in conventional electrolytes. This problem is similar to those observed in LIBs, but it is even more challenging due to the large ionic radius of K+ (1.38 Å), which is 81.6% larger than that of Li+.7
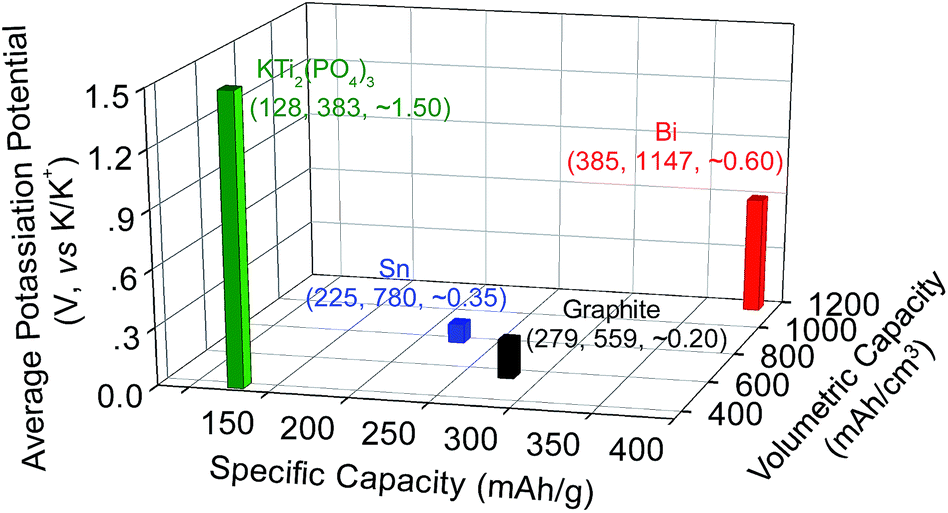 | ||
| Fig. 1 Potassium-ion storage potential of Bi compared to that of graphite, Sn, and KTi2(PO4)3. The (x, y, z) coordinates represent the theoretical specific capacity, theoretical volumetric capacity, and average operation potential, respectively. All the specific capacities are calculated based on the mass of the active material, while the volumetric capacities are calculated based on the volume and density of the final potassiated phase (K3Bi, KC8, and KSn) except KTi2(PO4)3 whose value is estimated based on the original phase as its potassiated structure remains unknown. | ||
Here, we show that a bismuth–carbon anode operating in a 5 M concentrated electrolyte of potassium bis(trifluoromethylsulfonyl)imide (KTFSI) in diethylene glycol dimethyl ether (DEGDME) simultaneously achieves high specific capacity, cyclability, and Coulombic efficiency, small potential hysteresis and improved rate capability well beyond those of the typical 1 M electrolyte. We also found that an even higher electrolyte concentration (7 M) results in similar cyclability, potential hysteresis and Coulombic efficiency for the Bi@C nanocomposite anode, but its K-ion storage capacity and rate capability are largely sacrificed. These results uncover an unexpected critical role of electrolyte chemistry in Bi–K batteries.
Results and discussion
The phase purity and crystallinity of the as-synthesized bismuth–carbon (Bi@C) nanocomposites were confirmed by X-ray powder diffraction (XRD) (Fig. 2a). All the diffraction peaks shown in the XRD pattern can be indexed to the rhombohedral phase with a space group of R![[3 with combining macron]](https://www.rsc.org/images/entities/char_0033_0304.gif) m. The corresponding crystal structure of Bi is shown in the inset of Fig. 2a. Scanning electron microscopy (SEM) and high-resolution transmission electron microscopy (HRTEM) images show that the Bi nanoparticles have an average diameter of ∼30 nm while the carbon coating is roughly 15 nm thick (Fig. 2b–d, S1, ESI†). The content of Bi in these Bi@C materials is 85.6 wt%, as revealed by thermogravimetric analysis (Fig. S2, ESI†). These Bi@C materials were mixed with Super-P carbon black and a carboxymethyl cellulose binder to fabricate the electrodes based on a slurry-coating process. The mass loading of Bi in the electrodes is ∼1.3 mg cm−2. The Bi@C anodes together with carbon black and the binder were directly peeled from Al current collectors for Brunauer–Emmett–Teller (BET) measurements, which give a specific surface area of 24.7 m2 g−1 for the bulk anode (Fig. S3, ESI†).
m. The corresponding crystal structure of Bi is shown in the inset of Fig. 2a. Scanning electron microscopy (SEM) and high-resolution transmission electron microscopy (HRTEM) images show that the Bi nanoparticles have an average diameter of ∼30 nm while the carbon coating is roughly 15 nm thick (Fig. 2b–d, S1, ESI†). The content of Bi in these Bi@C materials is 85.6 wt%, as revealed by thermogravimetric analysis (Fig. S2, ESI†). These Bi@C materials were mixed with Super-P carbon black and a carboxymethyl cellulose binder to fabricate the electrodes based on a slurry-coating process. The mass loading of Bi in the electrodes is ∼1.3 mg cm−2. The Bi@C anodes together with carbon black and the binder were directly peeled from Al current collectors for Brunauer–Emmett–Teller (BET) measurements, which give a specific surface area of 24.7 m2 g−1 for the bulk anode (Fig. S3, ESI†).
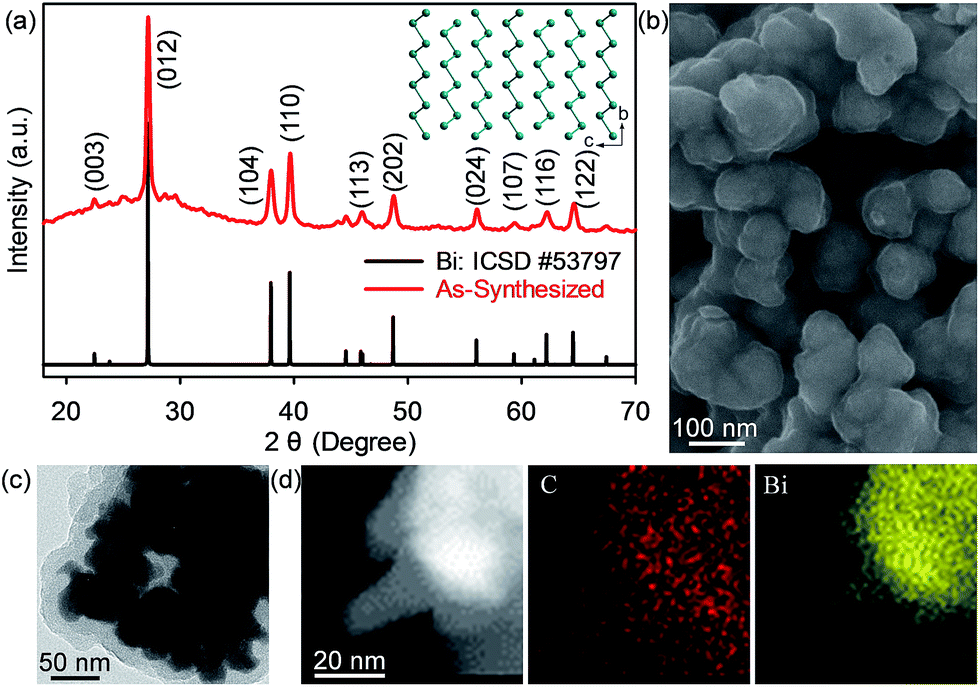 | ||
| Fig. 2 XRD and electron microscopy characterization of the Bi@C nanocomposite: (a) XRD confirming the purity and crystallinity of Bi@C. The inset shows the crystal structure of Bi. (b) SEM image, (c) TEM image, and (d) dark-field TEM EDS mapping of the Bi@C nanocomposite. | ||
To evaluate the electrolyte-concentration effect on electrochemical performances, the Bi@C anodes were coupled with K-foil and the KTFSI–DEGDME electrolytes (1 M, 5 M and 7 M) to fabricate PIB half-cells which subsequently underwent galvanostatic cycling. As shown in Fig. 3a and b, at a low rate of 10 mA g−1 (∼0.025C), the Bi@C anode delivers an initial reversible depotassiation capacity of 227 mA h g−1 with an initial Coulombic efficiency (CE) of 46.3% under the 5 M electrolyte. Note that all the capacities herein were calculated based on the mass of Bi@C. The low initial CE is commonly observed in alloy-type anodes and could be attributed to the formation of the SEI.29,37 After five-cycle activation, a reversible depotassiation capacity of 250 mA h g−1 was achieved in the 6th cycle. This high specific capacity is comparable to that of graphitic anodes and a bit higher than those of Sn, MoS2, and Ti-based oxides/phosphates.3,20,31–33,36 In contrast, when the 1 M electrolyte was applied, the Bi@C anode shows a lower initial reversible depotassiation capacity of 171 mA h g−1 and a lower initial CE of 39.4% while with even more concentrated 7 M electrolyte, the highest initial CE of 51.0% and a moderately high initial depotassiation capacity of 199 mA h g−1 were achieved. The capacity retention after 15 cycles is similar for concentrated electrolytes (78% for 5 M and 76% for 7 M), nearly twice that with the 1 M electrolyte (44%). These discrepancies evidently reveal that electrochemical performances strongly depend on the electrolyte concentration. When the appropriate electrolyte concentration is used, the K-ion storage capacity and cyclability of the Bi@C anode can be significantly elevated. In addition, all the KTFSI–DEGDME electrolytes outperform the electrolyte of KPF6 in an ester-based solvent (the capacity completely decays within 5 cycles, as shown in Fig. S4, ESI†), consistent with previous reports.25,37,38 With the optimized 5 M electrolyte, three cathodic peaks (at around 0.88, 0.42, and 0.34 V) and the corresponding anodic ones (at around 1.20, 0.68, 0.53, and 0.47 V) observed in the dQ/dV curve indicate a small potential hysteresis (the gap between the cathodic and the corresponding anodic peak) of 0.16–0.32 V (Fig. 3c). This value is similar to that in the 7 M (0.16–0.30 V) electrolyte and smaller than that in the 1 M electrolyte (0.33–0.47 V) (Fig. 3, S5, ESI†), which indicates that concentrated electrolytes can depress the potential hysteresis in Bi@C anodes and thus, in theory, allow the Bi–K battery chemistry to achieve higher energy efficiency. The presence of multiple cathodic/anodic peaks also indicates that this Bi–K battery chemistry may undergo a multi-step reaction which will be discussed in detail later in this paper. In addition, the Bi@C anode exhibits an average potassiation potential of ∼0.60 V, which makes it intrinsically free from potassium plating, and thus improves safety over graphite and Sn.3,28
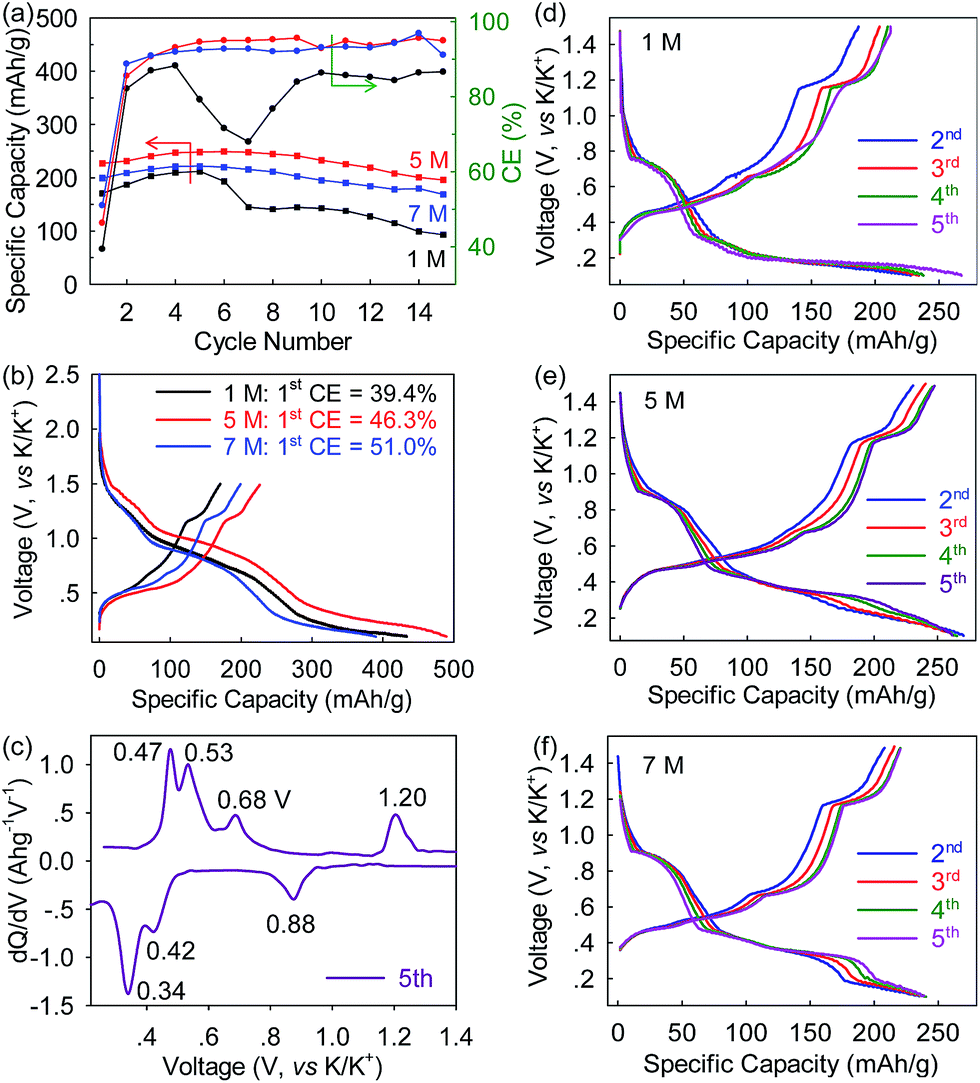 | ||
| Fig. 3 The electrochemical discrepancy of the Bi@C anode at 10 mA g−1 in different electrolyte concentrations: (a) Depotassiation capacity and Coulombic efficiency (CE). (b) First-cycle voltage profiles. (c) dQ/dV curve in the 5th cycle in the 5 M KTFSI–DEGDME electrolyte. (d–f) Galvanostatic voltage profiles in the 1 M (d), 5 M (e), and 7 M (f) KTFSI–DEGDME electrolytes. | ||
Apart from the positive impact on safety, the electrolyte concentration also evidently improves the long-term cyclability of the Bi@C anodes. At a rate of 50 mA g−1 (∼0.14C), the Bi@C anode in the 5 M electrolyte delivers a maximum reversible capacity of 220 mA h g−1 after a few cycles of activation, and 88% of the capacity remains in the 20th cycle (Fig. 4a). In contrast, the corresponding capacity retention of the Bi@C anode in the 1 M and 3 M electrolytes is as low as 25% and 69%, respectively, while in the 7 M electrolyte, an even higher capacity retention of 92% can be achieved, but the reversible capacity was significantly compromised (90 mA h g−1). The same trend was observed at a rate of 100 mA h g−1. As shown in Fig. 4b, the reversible capacities in the 35th cycle are 10, 67, 151, and 36 mA h g−1 for the 1 M, 3 M, 5 M, and 7 M electrolytes, respectively, with a capacity retention of 10%, 49%, 85%, and 90%. These results again demonstrate the vital role of appropriate electrolyte concentration in the Bi–K battery chemistry. In the 5 M electrolyte, the Bi@C anode achieves excellent cyclability over 600 cycles with 85% capacity retention and an average Coulombic efficiency (from the 2nd to the 600th cycle) of 99.35% at 200 mA g−1 (Fig. 4c).
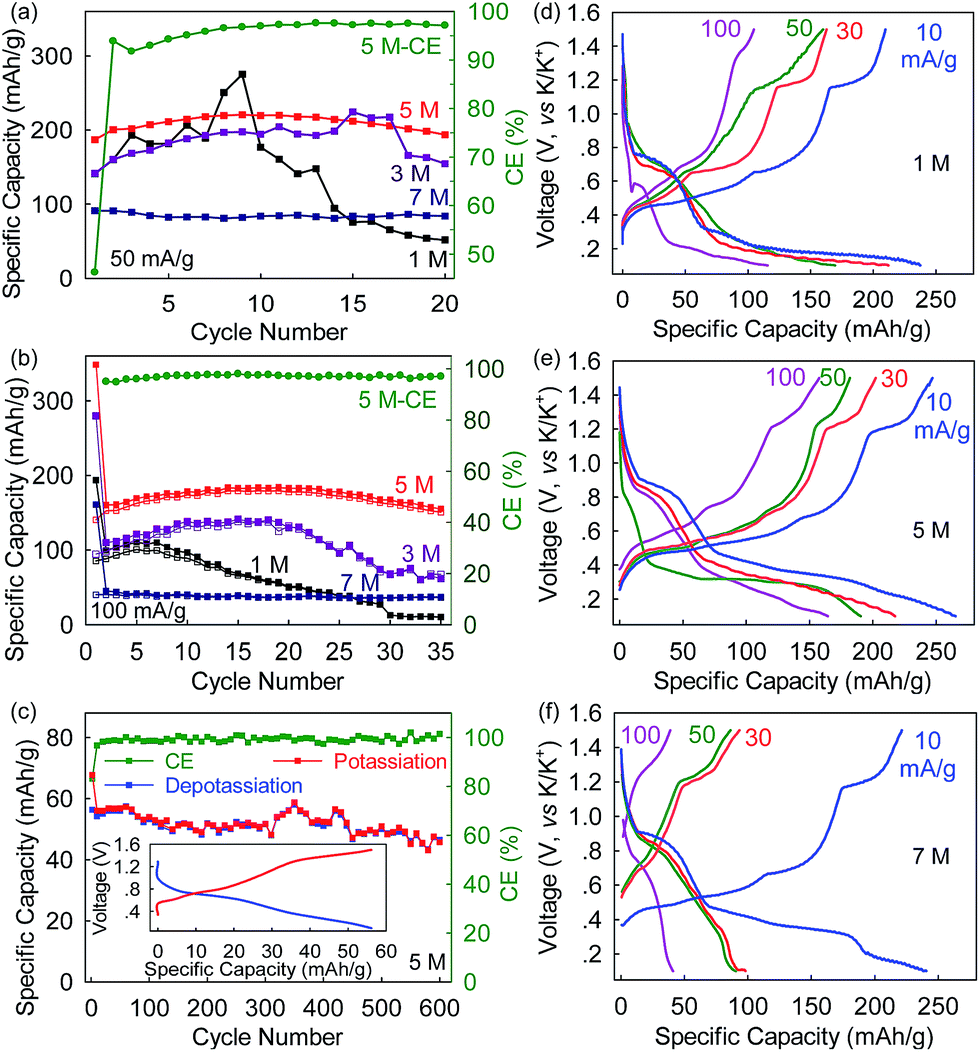 | ||
| Fig. 4 Electrolyte concentration effects on electrochemical cyclability and rate capability of the Bi@C anode: (a) Depotassiation capacity and Coulombic efficiency at 50 mA g−1. (b) Cyclability at 100 mA g−1. Solid and empty squares represent the potassiation and depotassiation capacities, respectively. (c) Long-term cyclability at 200 mA g−1 in the 5 M KTFSI–DEGDME electrolyte. For clarity, the first cycle is not shown. (d–f) Rate capability in the 1 M (a), 5 M (b), and 7 M (c) KTFSI–DEGDME electrolytes. | ||
At the 5 M electrolyte concentration, the rate capability of the Bi@C anode is also optimal. Excess electrolyte concentration can adversely affect the rate capability of Bi@C anodes. As shown in Fig. 4d–f and S6,† the depotassiation capacities of the Bi@C anodes vary slightly in the 1 M, 3 M, 5 M, and 7 M electrolytes at a low rate of 10 mA g−1. However, at a higher rate of 30 mA g−1, the Bi@C anode in the 5 M electrolyte exhibits a depotassiation capacity of 202 mA h g−1 which is higher than those in the 1 M and 3 M electrolytes (163 and 153 mA h g−1, respectively) and more than twice that in the 7 M electrolyte (93 mA h g−1). This capacity discrepancy becomes more prominent at an even higher rate. At 100 mA g−1, the Bi@C anode in the 5 M electrolyte can still deliver a relatively high depotassiation capacity of 158 mA h g−1, which cannot be achieved in the 1 M, 3 M or 7 M electrolytes. In particular, this capacity is four times as high as that in the 7 M electrolyte (39 mA h g−1).
This strong concentration dependence mainly, if not solely, arises from the electrolytes themselves as other components including the anode remain identical. Previous reports have suggested that DME molecules in a concentrated KFSI-DME electrolyte tend to donate the lone-pair electrons of oxygen to solvated K-ions.41 This behavior lowers the energy level of the highest occupied molecular orbital (HOMO) of DME and thus increases its redox resistance which is more than that of free DME in the low-concentration electrolyte.41 We speculated that, similar to DME, the long-chain DEGDME molecules in the concentrated electrolytes possess higher resistance to electrochemical reduction and consequently form less solid electrolyte interphase on the Bi@C surface. This speculation is experimentally confirmed by linear sweep voltammetry (LSV) and ex situ SEM studies. As shown in Fig. 5a and b, the 1 M electrolyte shows a large reduction current of 0.022 mA at 0 V versus K/K+. In sharp contrast, the reduction current in the concentrated 3 M, 5 M, and 7 M electrolytes significantly reduces to 0.010, 0.009 and 0.008 mA, respectively, which are only 45.5%, 41% and 36% of that in the 1 M electrolyte. These results reveal that the reduction resistance of the KTFSI–DEGDME electrolyte is proportional to its concentration. The SEI formation behavior shown in Fig. 5c–i further confirms this concentration dependency. After one potassiation/depotassiation cycle, a thick SEI layer was observed on the surface of the Bi@C anode in the 1 M electrolyte, making the anode surface barely visible. Conversely, much less SEI formation was observed in the concentrated 5 M and 7 M electrolytes, and the anode morphology is distinctly recognizable (Fig. 5f–i). In other words, the significantly improved reduction resistance of the 5 M electrolyte depresses the irreversible electrochemical reaction and contributes to less formation of the SEI, higher reversible capacity, cyclability and Coulombic efficiency beyond those of the typical 1 M electrolyte. Furthermore, a thinner SEI layer enables faster K-ion diffusion across it and thus smaller potential hysteresis and improved rate capability.
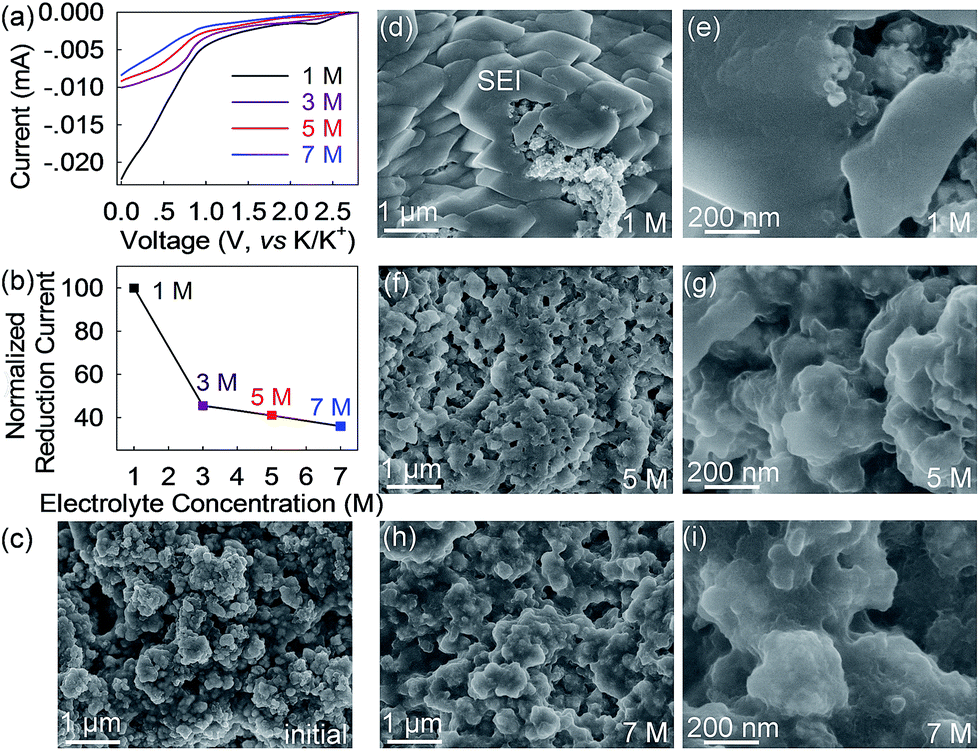 | ||
| Fig. 5 Concentration-dependent reduction resistance of electrolytes: (a) linear sweep voltammetry (LSV) curves. (b) Normalized reduction current versus electrolyte concentration. (c–i) SEM images of the Bi@C anode. The initial anode (c) and anodes after one potassiation/depotassiation cycle in the 1 M (d and e), 5 M (f and g), and 7 M (h and i) KTFSI–DEGDME electrolytes. | ||
To gain kinetic insights into the Bi@C anode in the 5 M electrolyte, electrochemical impedance spectroscopy (EIS) and galvanostatic intermittent titration technique (GITT) experiments were conducted, and the results are presented in Fig. 6 and S6.† The intercept of the Nyquist plots on the horizontal axis describes the electrolyte resistance (Re) which is 11.77 Ω after three-cycle activation (Fig. 6c, S7, ESI†). The high-frequency depressed semicircle presents the total resistances of contact (Rf) and charge transfer (Rct), while the low-frequency slope line accounts for Warburg ion-diffusion resistance (Zw).42 After three-cycle activation, the Rf was observed to be 10.3 Ω. This Rf is related to the ion-diffusion resistance across the SEI layer formed on the Bi@C surface, and its small value is a strong indication of well-developed electrolyte/electrode interfacial contact and relatively fast K+ permeation through the SEI film. The Rct was estimated to be 408.9 Ω which is nearly 10 times lower than that observed in the graphite anode (4358 Ω),23 suggesting relatively fast charge transfer in the Bi@C anode. Note that the electrolyte resistance (Re) in the 7 M electrolyte is ∼22 Ω which is about twice that in the 5 M electrolyte (Fig. S8, ESI†). This large resistance results in sluggish K-ion transport in the over-concentrated 7 M electrolyte and could account for the lower capacity and rate capability, compared with the 5 M electrolyte. In addition, as shown in Fig. 6d, the chemical diffusion coefficients of K-ions (DK-ion) in the Bi@C electrode under the 5 M electrolyte were also estimated based on the GITT measurements and the surface area of the bulk anode. The DK-ion values vary to some extent during cycling and are on the order of ∼10−17 cm2 s−1. This small DK-ion can be attributed to the large size of K-ions (1.38 Å in ionic radius, 81.6% larger than that of Li+). Note that the ion diffusion coefficients are sometimes calculated based on the geometric area of electrodes and are usually several orders of magnitude higher. The DK-ion values here are calculated to be ∼10−12 cm2 s−1 based on the geometric area of the anode.
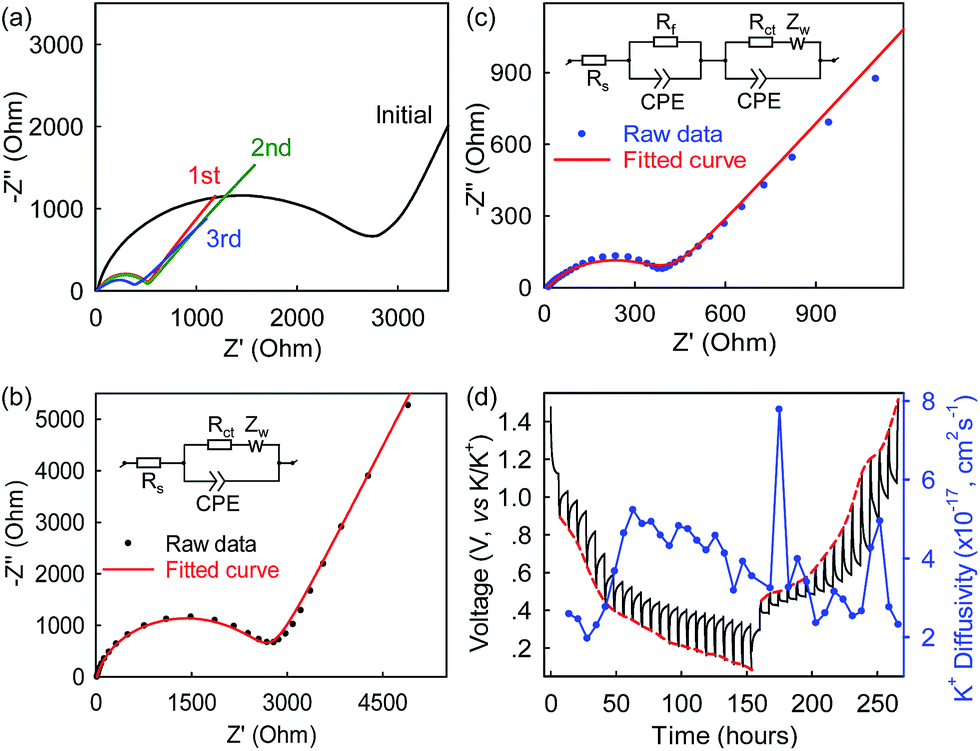 | ||
| Fig. 6 Reaction kinetics study of the Bi@C nanocomposite anode in the 5 M KTFSI–DEGDME electrolyte: (a) EIS of the initial and cycled Bi@C anodes. (b and c) EIS fitting data of the initial (b) and three times cycled Bi@C anodes (c), where Rs, Rf, Rct, CPE, and Zw represent the electrolyte resistance, contact resistance, charge-transfer resistance, constant-phase element, and Warburg ion-diffusion resistance, respectively. The insets of (b) and (c) show the corresponding equivalent circuits used for the data fitting. (d) GITT data collected during the 2nd cycle. | ||
The electrochemical reaction mechanism of the Bi–K battery chemistry was also investigated through ex situ XRD tests (Fig. 7). Upon potassiation at 0.8 V and 0.5 V, the XRD signals of KBi and unreacted Bi are detected. As the potassiation is extended to 0.1 V, a new signal of K3Bi appears. In the reversible process, the K3Bi phase coexists with KBi upon depotassiation at 0.5 V and disappears at 0.8 V. Upon further depotassiation at 1.5 V, nearly all K+ have been removed, and Bi dominates the detectable phase. Based on the experimental observations in the ex situ XRD study, the Bi–K battery chemistry may undergo two-phase reactions which involve the phase transformation of Bi metal to the KBi alloy and eventually the K3Bi alloy upon potassiation and a reversible process upon depotassiation (Fig. 7b). It is interesting to note that this reaction mechanism is distinctly different from those reported previously.37,38 Particularly, Guo et al. found that the Bi–K battery chemistry undergoes two-phase reactions as well, but the reactions experience the transformation of Bi to K5Bi4 and ultimately K3Bi,37 while in another work, Chen et al. observed a three-phase transformation from Bi to KBi2, K3Bi2, and K3Bi.38 The discrepancy in reaction mechanisms indicates that the Bi–K battery chemistry may undergo multi-phase (more than three-phase) reactions. Further studies are needed to resolve this discrepancy. Nevertheless, in all of these cases, the observed ultimate potassiation phase is always K3Bi, corresponding to a maximum K-ion storage capacity as high as 385 mA h g−1.
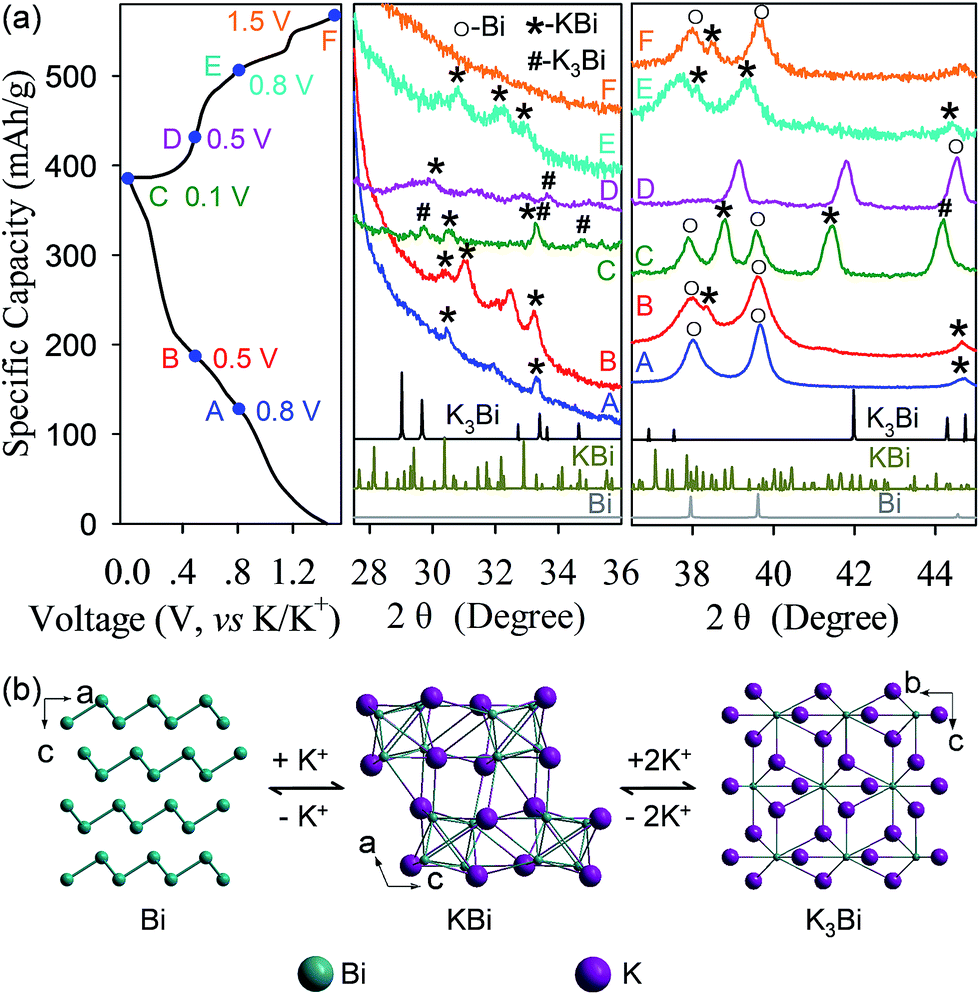 | ||
| Fig. 7 Mechanistic studies of the Bi@C anode in the 5 M KTFSI–DEGDME electrolyte: (a) Ex situ XRD recorded during the first cycle. The results reveal evidence of a multi-step reaction involving the phase transformation of Bi metal to the KBi alloy and ultimately to the K3Bi alloy. (b) Schematics illustrating the phase transformation of Bi upon potassiation/depotassiation. | ||
Conclusions
In summary, we propose a “concentrated electrolyte” approach to achieve significantly improved electrochemical storage performance for bismuth–potassium batteries. Our results show that a 5 M (versus the typical 1 M) ether-based electrolyte can effectively passivate the bismuth–carbon surface by increasing its reduction resistance. This protection enables the realization of a bismuth–potassium battery with a significantly higher reversible capacity (250 mA h g−1 at 10 mA g−1), electrochemical cyclability and Coulombic efficiency (up to 600 cycles with 85% capacity retention and an average CE of 99.35% at 200 mA g−1), as well as depressed potential hysteresis and improved rate capability. This approach paves the way for the incorporation of high capacity anode materials and innovative electrolytes into rechargeable potassium-ion batteries.Conflicts of interest
The authors declare no competing financial interest.Acknowledgements
This work is financially supported by the National Natural Science Foundation of China (Grant No. 21771180 and 51702318) and Natural Science Foundation of Fujian Province (Grant No. 2018J01031), and in part by Nanostructures for Electrical Energy Storage (NEES), an Energy Frontier Research Center funded by the U.S. Department of Energy, Office of Science, Office of Basic Energy Sciences under Award Number DESC0001160.Notes and references
- A. Eftekhari, J. Power Sources, 2004, 126, 221–228 CrossRef.
- A. Eftekhari, Z. Jian and X. Ji, ACS Appl. Mater. Interfaces, 2017, 9, 4404–4419 CrossRef PubMed.
- Z. Jian, W. Luo and X. Ji, J. Am. Chem. Soc., 2015, 137, 11566–11569 CrossRef PubMed.
- L. Xue, Y. Li, H. Gao, W. Zhou, X. Lu, W. Kaveevivitchai, A. Manthiram and J. B. Goodenough, J. Am. Chem. Soc., 2017, 139, 2164–2167 CrossRef PubMed.
- Q. Zhao, J. Wang, Y. Lu, Y. Li, G. Liang and J. Chen, Angew. Chem., Int. Ed., 2016, 55, 12528–12532 CrossRef PubMed.
- H. Kim, J. C. Kim, M. Bianchini and D. H. Seo, Adv. Energy Mater., 2017, 1702384 Search PubMed.
- X. Wu, D. P. Leonard and X. Ji, Chem. Mater., 2017, 29, 5031–5042 CrossRef.
- J. C. Pramudita, D. Sehrawat, D. Goonetilleke and N. Sharma, Adv. Energy Mater., 2017, 1602911 CrossRef.
- X. Zou, P. Xiong, J. Zhao, J. Hu, Z. Liu and Y. Xu, Phys. Chem. Chem. Phys., 2017, 19, 26495–26506 RSC.
- C. Vaalma, G. A. Giffin, D. Buchholz and S. Passerini, J. Electrochem. Soc., 2016, 163, A1295–A1299 CrossRef.
- X. Wang, X. Xu, C. Niu, J. Meng, M. Huang, X. Liu, Z. Liu and L. Mai, Nano Lett., 2017, 17, 544–550 CrossRef PubMed.
- H. Kim, J. C. Kim, S. H. Bo, T. Shi, D. H. Kwon and G. Ceder, Adv. Energy Mater., 2017, 7, 1700098 CrossRef.
- B. Tian, W. Tang, K. Leng, Z. Chen, S. J. R. Tan, C. Peng, G. H. Ning, W. Fu, C. Su and G. W. Zheng, et al. , ACS Energy Lett., 2017, 2, 1835–1840 CrossRef.
- K. Chihara, A. Katogi, K. Kubota and S. Komaba, Chem. Commun., 2017, 53, 5208–5211 RSC.
- V. Mathew, S. Kim, J. Kang, J. Gim, J. Song, J. P. Baboo, W. Park, D. Ahn, J. Han and L. Gu, et al. , NPG Asia Mater., 2014, 6, e138 CrossRef.
- Y. H. Zhu, Y. B. Yin, X. Yang, T. Sun, S. Wang, Y. S. Jiang, J. M. Yan and X. B. Zhang, Angew. Chem., Int. Ed., 2017, 56, 7881–7885 CrossRef PubMed.
- G. He and L. F. Nazar, ACS Energy Lett., 2017, 2, 1122–1127 CrossRef.
- Z. Shadike, D. R. Shi, T. Wang, M. H. Cao, S. F. Yang, J. Chen and Z. W. Fu, J. Mater. Chem. A, 2017, 5, 6393–6398 RSC.
- D. Su, A. McDonagh, S. Z. Qiao and G. Wang, Adv. Mater., 2017, 29, 1604007 CrossRef PubMed.
- W. Luo, J. Wan, B. Ozdemir, W. Bao, Y. Chen, J. Dai, H. Lin, Y. Xu, F. Gu and V. Barone, et al. , Nano Lett., 2015, 15, 7671–7677 CrossRef PubMed.
- Z. Jian, Z. Xing, C. Bommier, Z. Li and X. Ji, Adv. Energy Mater., 2016, 6, 1501874 CrossRef.
- Z. Jian, S. Hwang, Z. Li, A. S. Hernandez, X. Wang, Z. Xing, D. Su and X. Ji, Adv. Funct. Mater., 2017, 27, 1700324 CrossRef.
- J. Zhao, X. Zou, Y. Zhu, Y. Xu and C. Wang, Adv. Funct. Mater., 2016, 26, 8103–8110 CrossRef.
- J. Yang, Z. Ju, Y. Jiang, Z. Xing, B. Xi, J. Feng and S. Xiong, Adv. Mater., 2018, 30, 1700104 CrossRef PubMed.
- K. Lei, F. Li, C. Mu, J. Wang, Q. Zhao and C. J. Chen, Energy Environ. Sci., 2017, 10, 552–557 RSC.
- Q. Deng, J. Pei, C. Fan, J. Ma, B. Cao, C. Li, Y. Jin, L. Wang and J. Li, Nano Energy, 2017, 33, 350–355 CrossRef.
- W. D. McCulloch, X. Ren, M. Yu, Z. Huang and Y. Wu, ACS Appl. Mater. Interfaces, 2015, 7, 26158–26166 CrossRef PubMed.
- I. Sultana, T. Ramireddy, M. M. Rahman, Y. Chen and A. M. Glushenkov, Chem. Commun., 2016, 52, 9279–9282 RSC.
- W. Zhang, J. Mao, S. Li, Z. Chen and Z. Guo, J. Am. Chem. Soc., 2017, 139, 3316–3319 CrossRef PubMed.
- Q. Wang, X. Zhao, C. Ni, H. Tian, J. Li, Z. Zhang, S. X. Mao, J. Wang and Y. Xu, J. Phys. Chem. C, 2017, 121, 12652–12657 CrossRef.
- X. Ren, Q. Zhao, W. D. McCulloch and Y. Wu, Nano Res., 2017, 10, 1313–1321 CrossRef.
- J. Han, M. Xu, Y. Niu, G. N. Li, M. Wang, Y. Zhang, M. Jia and C. M. Li, Chem. Commun., 2016, 52, 11274–11276 RSC.
- B. Kishore, V. G and N. Munichandraiah, J. Electrochem. Soc., 2016, 163, A2551–A2554 CrossRef.
- H. Gao, T. Zhou, Y. Zheng, Q. Zhang, Y. Liu, J. Chen, H. Liu and Z. Guo, Adv. Funct. Mater., 2017, 27, 1702634 CrossRef.
- J. Zhou, L. Wang, M. Yang, J. Wu, F. Chen, W. Huang, N. Han, H. Ye, F. Zhao and Y. Li, et al. , Adv. Mater., 2017, 29, 1702061 CrossRef PubMed.
- J. Han, Y. Niu, S. J. Bao, Y. N. Yu, S. Y. Lu and M. Xu, Chem. Commun., 2016, 52, 11661–11664 RSC.
- Q. Zhang, J. Mao, W. K. Pang, T. Zheng, V. Sencadas, Y. Chen, Y. Liu and Z. Guo, Adv. Energy Mater., 2018, 1703288 CrossRef.
- K. Lei, C. Wang, L. Liu, Y. Luo, C. Mu, F. Li and J. Chen, Angew. Chem., Int. Ed., 2018, 57, 4687 CrossRef PubMed.
- C. F. Sun, J. Hu, P. Wang, X. Y. Cheng, S. B. Lee and Y. Wang, Nano Lett., 2016, 16, 5875–5882 CrossRef PubMed.
- J. Huang, X. Lin, H. Tan and B. Zhang, Adv. Energy Mater., 2018, 1703496 CrossRef.
- N. Xiao, W. D. McCulloch and Y. Wu, J. Am. Chem. Soc., 2017, 139, 9475–9478 CrossRef PubMed.
- C. F. Sun, H. Zhu, E. B. Baker III, M. Okada, J. Wan, A. Ghemes, Y. Inoue, L. Hu and Y. Wang, Nano Energy, 2013, 2, 987–994 CrossRef.
Footnote |
| † Electronic supplementary information (ESI) available. See DOI: 10.1039/c8sc01848k |
| This journal is © The Royal Society of Chemistry 2018 |