
 Open Access Article
 This Open Access Article is licensed under a Creative Commons Attribution-Non Commercial 3.0 Unported Licence
Synthesis and structural characterization of inverse-coordination clusters from a two-electron superatomic copper nanocluster†
Kiran Kumarvarma
Chakrahari
a,
Rhone P. Brocha
Silalahi
a,
Jian-Hong
Liao
a,
Samia
Kahlal
b,
Yu-Chiao
Liu
c,
Jyh-Fu
Lee
d,
Ming-Hsi
Chiang
 c,
Jean-Yves
Saillard
*b and
C. W.
Liu
*a
c,
Jean-Yves
Saillard
*b and
C. W.
Liu
*a
aDepartment of Chemistry, National Dong Hwa University, No. 1, Sec. 2, Da Hsueh Rd. Shoufeng, Hualien 97401, Taiwan, Republic of China. E-mail: chenwei@mail.ndhu.edu.tw
bUniv Rennes, CNRS, ISCR-UMR 6226, F-35000 Rennes, France
cInstitute of Chemistry, Academia Sinica, Taipei 11528, Taiwan, Republic of China
dNational Synchrotron Radiation Research Center, Hsinchu 30076, Taiwan
First published on 2nd July 2018
Abstract
We have synthesized and structurally characterized a series of centred cuboctahedral copper clusters, namely [Cu13{S2CNR2}6{C![[triple bond, length as m-dash]](https://www.rsc.org/images/entities/char_e002.gif) CR′}4](PF6), 1a–d (where a: R = nBu, R′ = CO2Me; b: R = nBu, R′ = CO2Et; c: R = iPr, R′ = CO2Et; d: R = nPr, R′ = 3,5-(CF3)2C6H3); [Cu12(μ12-S){S2CNR2}6{CCR′}4], 2a–c; [Cu12(μ12-Cl){S2CNR2}6{CCR′}4](PF6), 3a–e (where e: R = nBu, R′ = Ph); [Cu12(μ12-Br){S2CNnBu2}6{CCPh}4](PF6), 4e; and [Cu12(μ12-Cl)(μ3-Cl){S2CNnBu2}6{CCCO2Me}3]+5a. Cluster 1a is the first structurally characterized copper cluster having a Cu13 centered cuboctahedral arrangement, a miniature of the bulk copper fcc structure. Furthermore, the partial Cu(0) character in the 2-electron superatoms 1 was confirmed by XANES. Inverse coordination clusters 2–5 are the first examples of copper clusters containing main group elements (Cl, Br, S) with a hyper-coordination number, twelve. A combined theoretical and experimental study was performed, which shows that the central copper (formally Cu1−) in nanoclusters 1 can be replaced by chalcogen/halogen atoms, resulting in the formation of clusters 2–5 which show enhanced luminescence properties and increase in the ionic component of the host–guest interaction as Br ≈ Cl > S > Cu, which is consistent with the Cu–X Wiberg indices. The new compounds have been characterized by ESI-MS, 1H, 13C NMR, IR, UV-visible, emission spectroscopy, and the structures 2a–b, 3d–e, 4e and 5a were established by X-ray diffraction analysis.
CR′}4](PF6), 1a–d (where a: R = nBu, R′ = CO2Me; b: R = nBu, R′ = CO2Et; c: R = iPr, R′ = CO2Et; d: R = nPr, R′ = 3,5-(CF3)2C6H3); [Cu12(μ12-S){S2CNR2}6{CCR′}4], 2a–c; [Cu12(μ12-Cl){S2CNR2}6{CCR′}4](PF6), 3a–e (where e: R = nBu, R′ = Ph); [Cu12(μ12-Br){S2CNnBu2}6{CCPh}4](PF6), 4e; and [Cu12(μ12-Cl)(μ3-Cl){S2CNnBu2}6{CCCO2Me}3]+5a. Cluster 1a is the first structurally characterized copper cluster having a Cu13 centered cuboctahedral arrangement, a miniature of the bulk copper fcc structure. Furthermore, the partial Cu(0) character in the 2-electron superatoms 1 was confirmed by XANES. Inverse coordination clusters 2–5 are the first examples of copper clusters containing main group elements (Cl, Br, S) with a hyper-coordination number, twelve. A combined theoretical and experimental study was performed, which shows that the central copper (formally Cu1−) in nanoclusters 1 can be replaced by chalcogen/halogen atoms, resulting in the formation of clusters 2–5 which show enhanced luminescence properties and increase in the ionic component of the host–guest interaction as Br ≈ Cl > S > Cu, which is consistent with the Cu–X Wiberg indices. The new compounds have been characterized by ESI-MS, 1H, 13C NMR, IR, UV-visible, emission spectroscopy, and the structures 2a–b, 3d–e, 4e and 5a were established by X-ray diffraction analysis.
Introduction
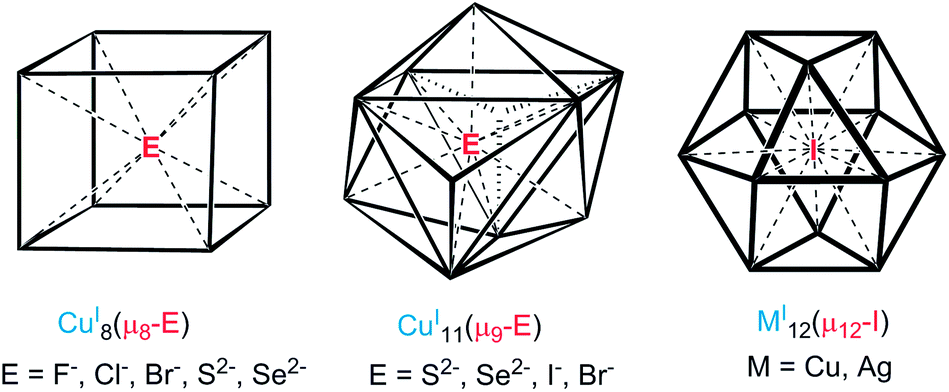
The concept of inverse coordination, as recently defined by Haiduc,1 applies to metal complexes in which the arrangement of acceptor and donor sites is opposite to that occurring in Werner-type coordination complexes. Inverse coordination complexes are formed around a non-metal species as the central atom (ion) surrounded by a number of metal atoms (ions) connected or not by internal bridging (intramolecular) linkers. Thus, discarding the nature of metal–metal interactions (if any), inverse coordination complexes can be simply viewed as transition-metal clusters (with or without metal–metal bonding) encapsulating a main-group anion.In recent years, our group has developed the chemistry of anion-encapsulated CuI and AgI clusters bridged by dichalcogenolate ligands (dithiocarbamates and dichalcogenophosph(in)ates).2 Various high-coordination numbers have been observed and rationalized for anions located at the centre of such d10-metal clusters.3 For instance, cubic metal clusters containing an octa-coordinated encapsulated anion are known (Chart 1, left side).4 Nona-coordination of a halide or a chalcogenide, where the encapsulated anion lies at the center of an M11 pentacapped trigonal prism (Chart 1, middle), has also been shown to exist.4,5 Later, we reported the first example of a dodeca-coordinated iodide lying at the center of an Ag12 cuboctahedron (Chart 1, right side).4 Lang and coworkers reported a cluster having a similar coordination environment for iodide in a cuboctahedral copper core.4h It is worth noting that in the examples illustrated in Chart 1, no formal covalent bonding exists between the d10 metal centers, but only some metallophilic interactions.6
 | ||
| Chart 1 Geometries of hyper-coordinated chalcogen/halogen anions. | ||
Understanding the mechanisms of nanocluster (NC) formation and reactivity is an important step toward the tailoring of new functional materials.1 A substitution reaction is a typical chemical reaction where an atom or a functional group of a molecule is replaced by another atom or functional group.7
Compared to substitution reactions on a terminal ligand, substituting an inversely coordinated anion is much more difficult to perform due to the relatively high activation energy associated with this process.8 As far as we know, organometallic complexes with a main-group element in a very high coordination number have never been synthesized via the substitution reaction.
Recently, we reported the synthesis and characterization of a series of group 11 cuboctahedral metal NCs of the general formula [Cu12(μ12-M)(S2CNR2)6(CCR′)4]+ (M = Cu, Ag, Au).9a In a first approximation, the bonding within these 2-electron superatoms can be described as resulting from the interaction of an encapsulated and formally M− anion with a cuboctahedral cage composed of twelve CuI ions. One fascinating query is whether it should be possible to substitute the encapsulated closed-shell M− anion by a closed-shell main-group anion, and further on, to replace this encapsulated main-group element by another one, the corresponding substitution reactions occurring without cluster disintegration.
Herein, we report the detailed synthesis and characterizations of chalcogen- and halogen-centred copper cuboctahedra. The compounds exhibit three distinct features: (1) the Cu12 framework stabilized by both dithiocarbamate (dtc) and acetylide ligands is unprecedented; (2) the reported μ12-S species are the very first compounds exhibiting a twelve-coordinated chalcogen encapsulated in a copper cluster; (3) the reported μ12-Cl species constitute the only third example of a twelve-coordinated halogen in coordination chemistry.
Results and discussion
Synthesis and characterization
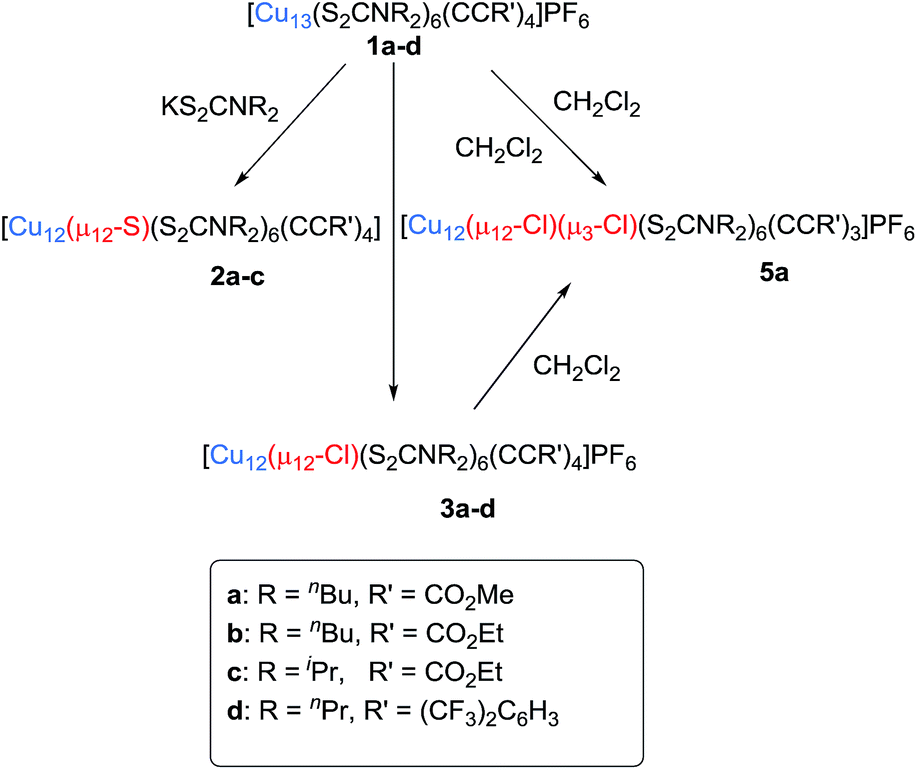
Previously we have demonstrated that the hydrides present in the copper(I) cluster [Cu28H15(dtc)12]+ (dtc = di-butyldithiocarbamate = S2CNnBu2) react with the acidic protons of terminal alkynes to liberate molecular hydrogen, which subsequently reduces the excess of alkynes to alkenes, as well as parts of CuI to Cu0.9b The generation of alkynyl ligands in the reaction medium leads eventually to the formation of a brand-new NC formulated as [Cu13(dtc)6(alkynyl)4]+ (1), which has a centered cuboctahedral [Cu13]11+ core possessing two 4s cluster electrons (1S2 closed-shell configuration within the spherical jellium or superatom paradigm10). In a typical experiment, to a THF suspension of [Cu28H15(S2CNR2)12]+, a ten-fold excess of terminal alkyne was added and the reaction mixture was stirred at 30 °C for 24 hours. The solution undergoes a color change from orange to deep red, resulting in the deposition of a dark green solid. Workup of this mixture leads to the isolation of [Cu13{S2CNR2}6{CCR′}4](PF6) (1) as a dark red solid in 40–70% yield (1a (70%): R = nBu, R′ = CO2Me; 1b (42%): R = nBu, R′ = CO2Et; 1c (65%): R = iPr, R′ = CO2Et; 1d (55%): R = nPr, R′ = 3,5-(CF3)2C6H3). In all the cases [Cu8H(S2CNR2)6]+ and the corresponding alkene (methyl acrylate for a, ethyl acrylate for b, c, and 1,3-bis(trifluoromethyl)-5-vinylbenzene for d) have been isolated as byproducts. The hydrogen gas released from the reaction of the terminal alkyne's acidic hydrogen with the hydrides of [Cu28H15(S2CNnR2)12]+ is assumed to be the reductant for the partial conversion of the alkyne to an alkene.
The positive-ion ESI mass spectrum of 1b–d clearly displays a prominent band for the molecular ion [1b-PF6]+ at m/z 2438.6 (calcd 2438.7), [1c-PF6]+ at m/z 2270.3 (calcd 2270.5), [1d-PF6]+ at m/z 2830.3 (calcd 2830.4) and their simulated isotopic patterns match well with the experimental observations (Fig. 1a, S1 and S2†). As said above, with two 4s(Cu) electrons delocalized on its 13-atom metal core, the cluster cation 1 is a mixed-valent species, more precisely 2-electron superatoms.10 Notably, only a few 2-electron copper NCs are known: [Cu25H22(PPh3)12]+, [Cu29H22Cl4(Ph2Phen)12]+, and [Cu20(CCPh)12(OAc)6],11–13 and none of them has a cuboctahedral metal core.
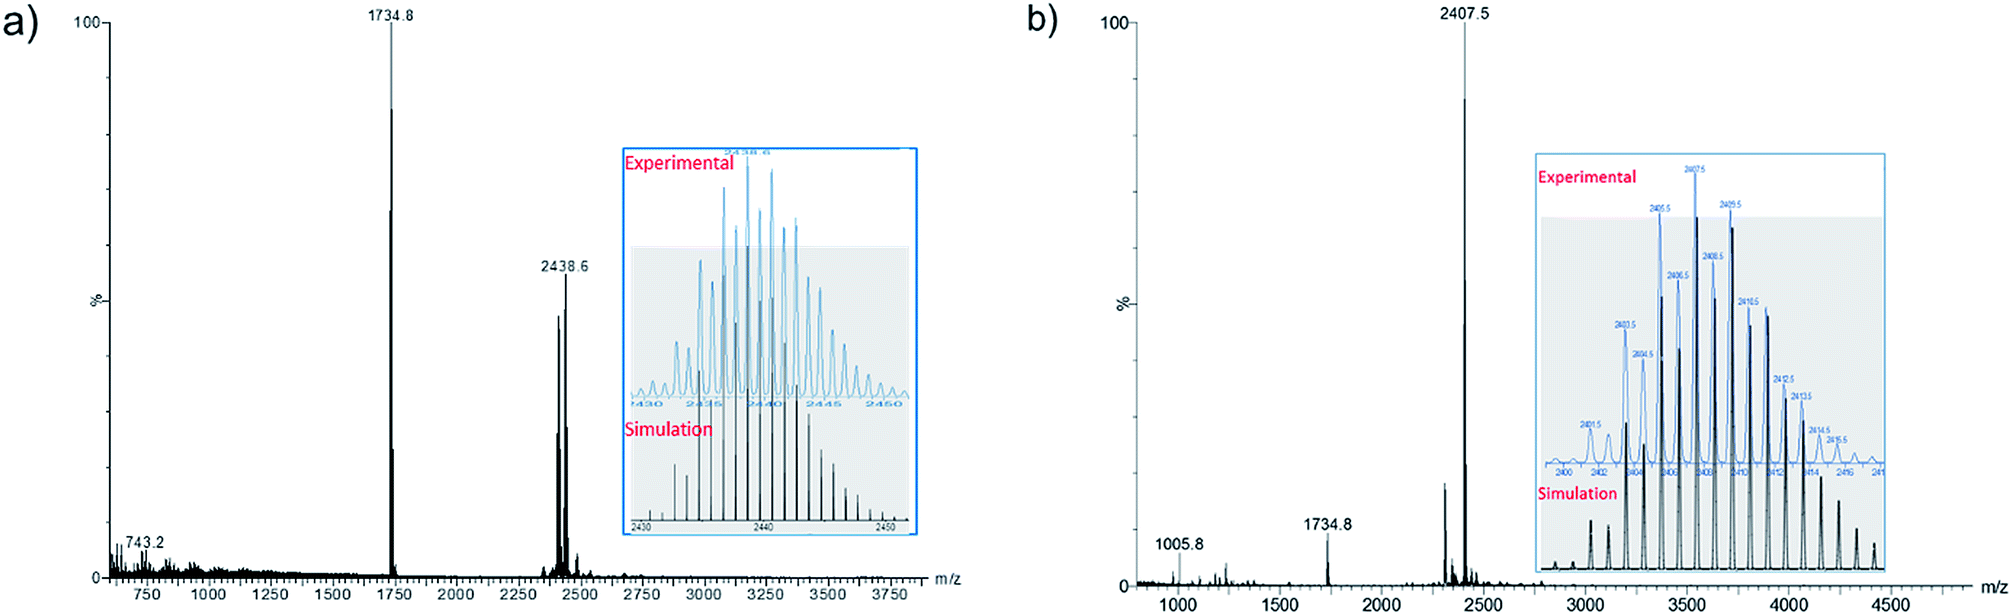 | ||
| Fig. 1 Positive mode ESI-MS of 1b (a) and 2b (b). Insets: experimental and simulated mass spectra. | ||
1H and 13C NMR spectra of 1a–d show one set of signals, consistently with Td symmetry in solution (see below). Their FT-IR spectra show that the alkynyl ν(CC) stretching frequencies are lower than in the corresponding alkyne (ν(HCCR′) = 2129 cm−1). 1a shows a band at 2017.5 cm−1. This value is slightly higher than in [Cu3(μ-dppm)3(μ3-η1-CCCOO)(μ3-OCH3)] (1976 cm−1).14 The effect of Cu oxidation state(s) and cluster nuclearity is evident in the Cu K-edge X-ray absorption near-edge spectra (XANES) of 1a–d (Fig. 2). At ∼8979.8 eV, the edge position of 1a–d is very similar to that of copper NCs, [Cu29Cl4H22(Ph2Phen)12](Cl) and [Cu25H22(PPh3)12](Cl) reported by Hayton11,12 and resides between values measured for Cu0 in the bulk foil (8979.0 eV) and CuI in clusters such as [Cu28(H)15(S2CNnBu2)12](PF6) (8980.1 eV) and [Cu8(H)(S2CNnBu2)6](PF6) (8980.3 eV). This is consistent with an average Cu oxidation state between 0 and +1 for 1a–d (Table 1).
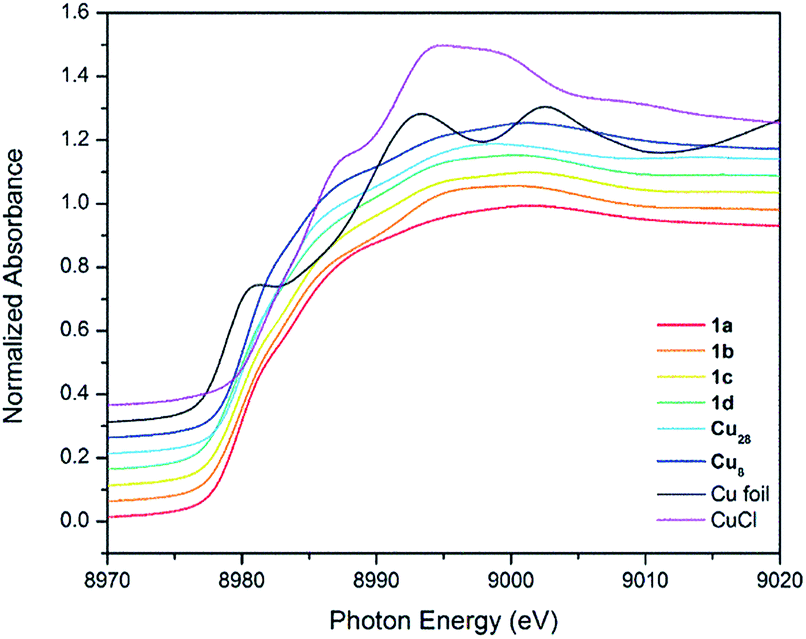 | ||
| Fig. 2 Comparison of Cu K-edge XANES profiles for Cu foil, CuCl, copper(I) hydrides and NCs 1a–d. | ||
| Material | Edge (eV) |
|---|---|
| Cu foil | 8979.0 |
| [Cu25H22(PPh3)12]Cl11 | 8979.6 |
| [Cu29Cl4H22(Ph2Phen)12]Cl12 | 8979.5 |
| [Cu13(S2CNnBu2)6(C3O2Me)4]PF6 (1a) | 8979.8 |
| [Cu13(S2CNnBu2)6(C3O2Et)4]PF6 (1b) | 8979.8 |
| [Cu13(S2CNiPr2)6(C3O2Et)4]PF6 (1c) | 8979.8 |
| [Cu13(S2CNnPr2)6{(CF3)2C6H3}4]PF6 (1d) | 8979.7 |
| Cu2O | 8980.0 |
| [Cu28(H)15(S2CNnBu2)12]PF6 | 8980.1 |
| [Cu8(H)(S2CNnBu2)6]PF6 | 8980.3 |
| [Cu(CH3CN)4]PF6 | 8980.3 |
| CuCl | 8981.6 |
Compound 2a has been synthesized by reacting 1a with a two-fold excess of K[S2CNnBu2] and the reaction mixture was stirred for 24 hours at 0 °C (Scheme 1). The solution undergoes a color change from deep red to orange. Immediate workup of this mixture leads to the isolation of [SCu12(S2CNnBu2)6(CCCOOMe)4] (2a) as a dark orange solid in 22% yield. Clusters 2b and 2c were isolated by following a similar synthetic procedure. The positive-ion ESI mass spectrum clearly displays a prominent band for the molecular ion [2a]+ at m/z 2351.6 (calcd 2351.7), [2b]+ at m/z 2407.5 (calcd 2407.7), [2c]+ at m/z 2239.0 (calcd 2237.5), and their simulated isotopic patterns match well with the experimental observation (Fig. 1b, S3 and S4†). The presence of a sulfide atom in 2a–c clearly originates from the dtc ligand. Indeed, the formation of S2− from the sulfur–carbon bond cleavage in dtc ligands has been well documented.15
 | ||
| Scheme 1 Substitution reactions for the synthesis of compounds 2, 3, and 5 from 1. | ||
Compounds 3a–d were isolated as yellow solids in 11–30% yield from the reaction of 1a–d with dichloromethane for three days under ambient conditions. This reaction also produced [Cu11Cl4(S2CNR2)6]+ and a series of chloride-centred Cu12 cuboctahedral clusters with a different number of acetylide ligands [Cu12(μ12-Cl)(μ3-Cl)n{S2CNR2}6{CCR′}4−n](PF6) (n = 1–3), whose compositions were confirmed by ESI mass spectroscopy (Fig. S6 and S7†). This result suggests that three among the four acetylides of compound 3 can be replaced by halides. The geometric structure of [Cu11Cl4(S2CNR2)6]+ is presumably similar to that of our previously reported [Cu11(μ9-Br)(μ3-Br)3{S2P(OiPr)2}6]+.5 Separation of these compounds by column chromatography was difficult. However, we were lucky to grow single crystals of 5a [Cu12(μ12-Cl)(μ3-Cl){S2CNR2}6{CCO2Me}3]+, which was characterized by X-ray crystallography (vide infra).
We have increased the yields in the production of compounds 3 by designing an alternative synthetic procedure. The direct synthesis involved the reaction of a terminal alkyne with a THF suspension of CuI salts and dtc ligands followed by the addition of few drops of triethylamine (Scheme 2). The reaction mixture was stirred at room temperature for ten minutes followed by the addition of tetrabutylammonium halide. The resulting solution was stirred for 12 hours, leading to the isolation of compounds 3e and 4e with 45% and 52% yields, respectively. The spectroscopic data of 3e and 4e are fully consistent with their X-ray structures described below (Fig. 3). The positive-ion ESI mass spectra clearly display a prominent band for the molecular ion [3a-PF6]+ at m/z 2354.8 (calcd 2354.7), [3b-PF6]+ at m/z 2410.7 (calcd 2410.7), [3c-PF6]+ at m/z 2242.5 (calcd 2240.5), [3d-PF6]+ at m/z 2802.3 (calcd 2802.5), [3e-PF6]+ at m/z 2426.4 (calcd 2426.8), and [4e-PF6]+ at m/z 2470.5 (calcd 2470.7), and their simulated isotopic patterns match well with the experimental observation (Fig. 4 and S6–S9†).
 | ||
| Scheme 2 An alternative method for the synthesis of 3e and 4e. | ||
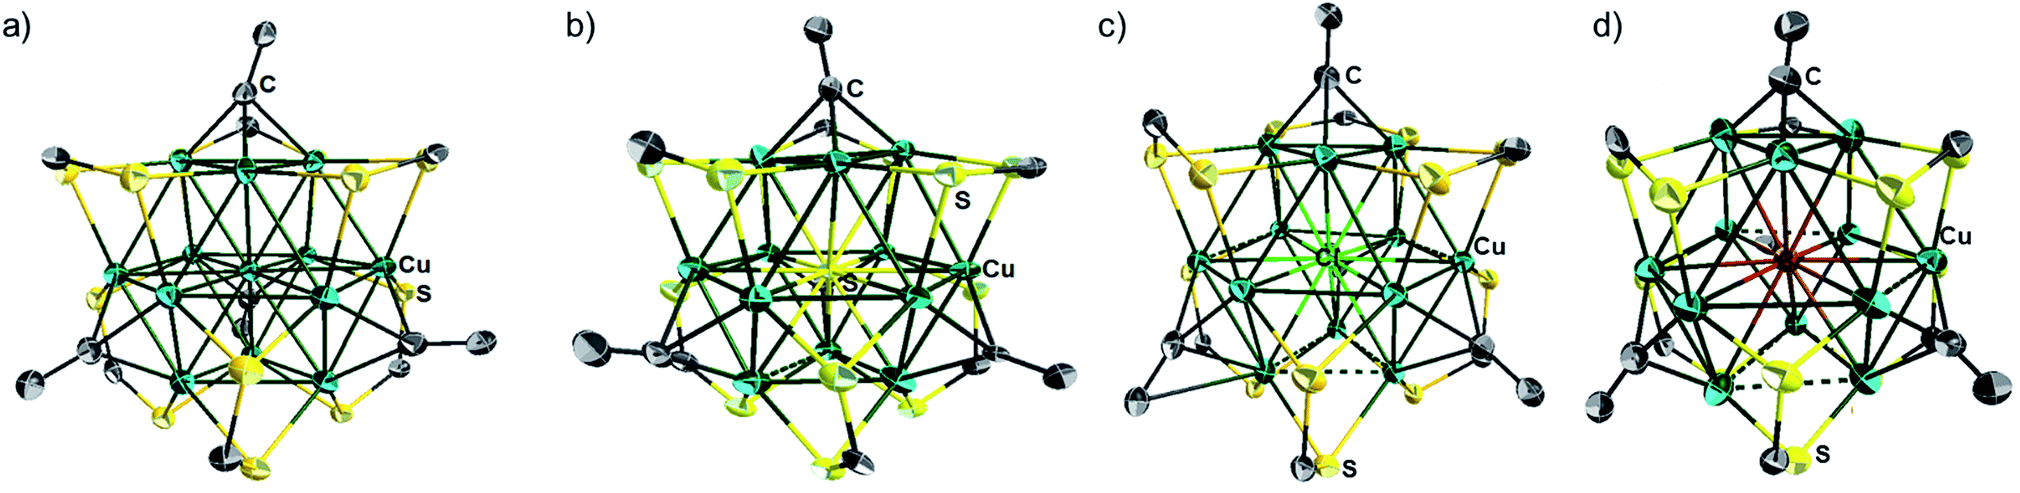 | ||
| Fig. 3 Single crystal structures of the cluster cation 1a (a), cluster 2a (b), cluster cations of 3e (c) and 4e (d) with 30% thermal probability ellipsoids. All NnBu2, C(O)OMe (1a, 2a) and phenyl (3e, 4e) moieties are omitted for clarity. | ||
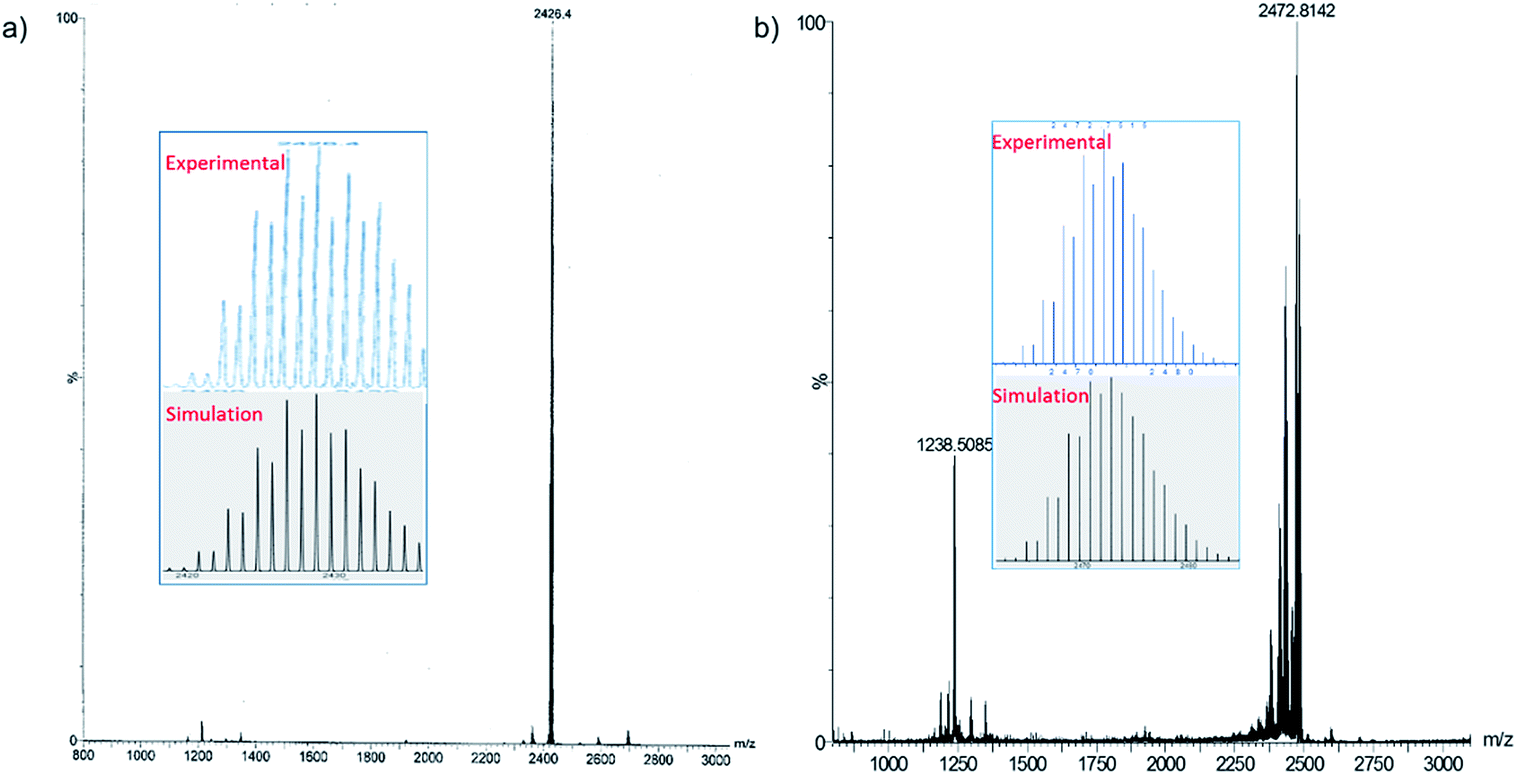 | ||
| Fig. 4 Positive mode ESI-MS of 3e (a), 4e (b). The insets show experimental and simulated mass spectra. | ||
FT-IR spectra of 3e and 4e show that the ν(CC) stretching frequencies (2014, and 2015 cm−1 respectively) are lower than the values found for the corresponding alkyne (ν(HCCPh) = 2110 cm−1).
In solution, 1H NMR spectra for compounds 2a, 3e and 4e were recorded at variable temperatures (183, 193, 243 and 273 K), which show only one set of ligands (in line with Td symmetry, Fig. S10†). 1H and 13C NMR spectroscopic analyses of 5 show one set of ligands illustrating that the molecule is highly symmetric in solution. This is consistent with the ligand distribution pattern in 1, implying their similarity in structure. Indeed, the 1H chemical shifts of 1a and 5a are similar but their integration ratios are different. Clusters 1–4 contain six dtc ligands and four alkynyl groups, whereas the 1H NMR spectrum of 5a shows the integration value of three alkynyl groups for six n-butyl dtc ligands. The replacement of one of the alkynyl groups with chloride is further confirmed by the ESI mass spectrum, where 5a shows the molecular ion [5a]+ peak at m/z 2308.4 (calcd 2306.6) (Fig. S11†).
Structural analysis
The single-crystal X-ray structures of 1a, 2a, 2b, 3d, 3e and 4e are given in Fig. 3a, b, S5, S12,†3c and d respectively. Corresponding relevant metrical data are given in Table 2. They all clearly show an X-centered Cu12 cuboctahedron (X = Cu (1), S (2), Cl (3d, 3e), Br (4e)). The six square faces of the Cu12 cuboctahedron are capped by six dtc ligands, each of them bridging four metal centres in a (μ2, μ2) binding mode. As a result, the twelve dtc sulfur atoms form a truncated tetrahedral cage. Four among the eight triangular faces of the cuboctahedron are capped by alkynyl groups in a μ3-η1 fashion. It follows that each of the twelve outer Cu atoms is in an approximately planar CuS2C coordination mode (not taking into account bonding with X). Not considering the substituents on alkynyls, the idealized symmetry of the clusters is Td. The main-group-centered structures (2a, b, 3d, e and 4e) are however more distorted away from this ideal symmetry than that with X = Cu (1a). This is exemplified by the larger dispersion of the Cu–Cu and X–Cu distances. All these structures exhibit one rather long X–Cu distance (Table 2) but still within bonding contacts (see below). The Cu–(μ12-S) bond lengths of 2a, b are in the range 2.561(3)–2.934(4) Å, i.e. longer but comparable to that of Cu–(μ9-S) 2.402–2.870 Å in [Cu11(μ9-S)(μ3-Br)3{S2P(OiPr)2}6].5a The average Cu–(μ12-Br) distance in 4e (2.977 Å) is comparable to the Cu–(μ9-Br) distance (2.942 Å) observed in [Cu11(μ9-Br)(μ3-Br)3{S2P(OiPr)2}6]+.5 The average Cu–(μ8-X) distance in [Cu8(μ8-X){S2P(OiPr)2}]+ is shorter than in 3d, e and 4e (2.72 (ref. 4c) and 2.74 Å (ref. 4d) for Cl and Br, respectively). The average Cu–Cu distances in compounds 2a–b, 3d–e and 4e are larger than in the Cu-centered cluster 1a, the largest value corresponding to the bromine-centered cluster 4e, presumably owing to the larger size of bromine. In this particular compound, the Cu–Cu distance overpasses the sum of the van der Waals radii and it can be anticipated that the entrapment of anions larger than bromide into the CuI12 cage would destabilize the structure. For all the structures reported in Table 2, the Cu–S(dtc) Cu–C and CC bond distances (Table 2) are in the normal range and vary little across the series. The highest coordination number found in the literature is 8 for chloride and 9 for bromide.4 Thus, to the best of our knowledge, compounds 3d–e and 4e are the first isolated examples of μ12-chloride and μ12-bromide encapsulated in molecular compounds. In these clusters, as well as in the copper- and sulfide-centered species, the central atom plays a template role in the formation of this large cluster. This cuboctahedral configuration represents a marked contrast with the centered icosahedral geometry observed in the core unit of [Ag20{E2P(OiPr)2}12] (E = S, Se) and [Ag21{S2P(OiPr)2}12]+.16 It is worth mentioning that no guest element exists in the dodecahedral structures of [Cu12S8]4−, [Cu12(NPh)8]4−, [(tBu3SiP)6Cu12], and [Cu12E6(PR3)8] (E = S, Se, Te).17 Whereas a couple of examples of Au12 and Ag12 dodecahedra encapsulating a sodium or silver atom, respectively, are known,18 compounds 1–5 are the first examples of a copper cuboctahedron encapsulating another atom (except for Lang's compound of ref. 4h). In the case of 1a, the metallic core is, to the best of our knowledge, the first example of a copper-centred Cu13 cuboctahedron, identical to that observed in the fcc structure of bulk copper.
| Xcent | Xcent–Cu | Cu–Cu | CC |
Cucubo–C | Cucubo–S | |
|---|---|---|---|---|---|---|
| 1a 9 | Cu | 2.605–2.669 | 2.522–2.786 | 1.187–1.213 | 2.001–2.076 | 2.257–2.320 |
| Avg. 2.636 | Avg. 2.636 | Avg. 1.202 | Avg. 2.035 | Avg. 2.289 | ||
| 2a | S | 2.589–2.934 | 2.521–3.091 | 1.179–1.220 | 1.993–2.241 | 2.256–2.328 |
| Avg. 2.706 | Avg. 2.709 | Avg. 1.201 | Avg. 2.094 | Avg. 2.295 | ||
| 2b | S | 2.561–2.892 | 2.549–3.128 | 1.143–1.200 | 2.002–2.203 | 2.264–2.359 |
| Avg. 2.713 | Avg. 2.717 | Avg. 1.178 | Avg. 2.092 | Avg. 2.302 | ||
| 3d | Cl | 2.694–2.957 | 2.495–3.226 | 1.222–1.223 | 1.982–2.095 | 2.206–2.332 |
| Avg. 2.831 | Avg. 2.844 | Avg. 1.223 | Avg. 2.019 | Avg. 2.274 | ||
| 3e | Cl | 2.807–3.035 | 2.527–3.212 | 1.205–1.257 | 1.956–2.075 | 2.243–2.291 |
| Avg. 2.926 | Avg. 2.884 | Avg. 1.225 | Avg. 2.025 | Avg. 2.267 | ||
| 4e | Br | 2.881–3.072 | 2.563–3.306 | 1.165–1.217 | 1.943–2.100 | 2.238–2.311 |
| Avg. 2.977 | Avg. 2.975 | Avg 1.190 | Avg. 2.029 | Avg. 2.269 | ||
| 5a | Cl | 2.635–2.911 | 2.563–3.245 | 1.059–1.174 | 1.985–2.173 | 2.249–2.316 |
| Avg. 2.778 | Avg. 2.781 | Avg. 1.134 | Avg. 2.084 | Avg. 2.279 |
The X-ray structure of 5a (Fig. 5 and Table 2) can be derived from that of 3 by replacing one of the four μ3-alkynyl moieties by an isolobal μ3-Cl ligand, which lowers the cluster ideal symmetry from Td to C3v. Apart from this substitution, the structure of 5a is similar to that of clusters 3. Not considering bonding with the encapsulated chloride, three among the twelve copper atoms are in the CuS2Cl coordination, leaving nine other metals in a CuS2C coordination. 5a exhibits a broad range of Cu–Cu distances (2.563–3.245 Å). The corresponding average value (2.781 Å) is shorter than that observed in 3d (2.844 Å). The average Cu–(μ12-Cl) distance in 5a (2.778 Å) is substantially larger than that corresponding to the Cu–(μ3-Cl) distance (2.321 Å). Interestingly, the CC distances of 5a (avg. 1.134 Å) are significantly shorter than that of the tetra-alkynyl species reported in Table 2 (avg. 1.19–1.22 Å).
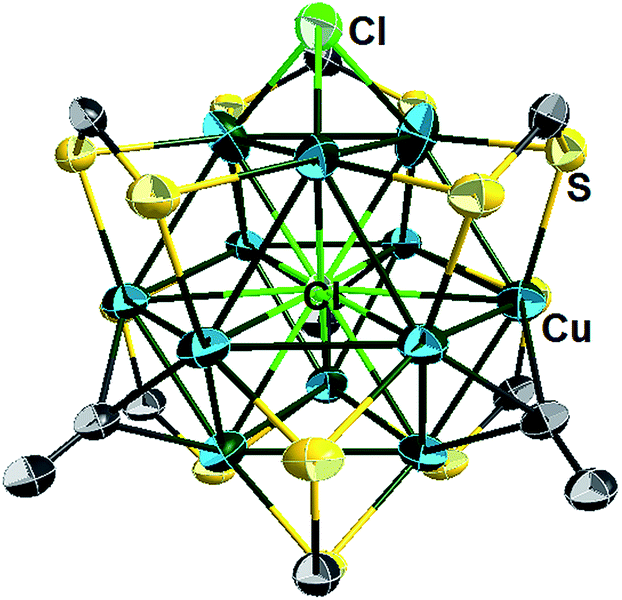 | ||
| Fig. 5 Single crystal structure of the cluster cation 5a with 30% thermal probability ellipsoids. All NnBu2 and C(O)OCH3 moieties are omitted for clarity. | ||
Optical properties
It is fascinating that a single atom alteration between clusters 1–3 can lead to diverse variances in their UV-vis spectra (Fig. 6). The homo-nuclear Cu13 cluster (1a) looks pinkish to the naked eye, whereas the sulfide- (2a) and chloride- (3a) centred clusters appear to be orange. The UV-vis spectrum of 1a shows broad multiband optical absorption (at 337, 513, 540, 571 nm) and an intense absorption band at 287 nm, whereas the inverse coordination clusters 2a (317, 450 nm) and 3a (312 nm) show different patterns in their UV-vis spectrum. Substitution of the central metal atom (Cu) in 1 with main-group elements like sulfur and halogen increases the intensity of photoemission. At 77 K clusters 2a and 3a exhibit a structureless emission band, centred at 562 and 585 nm, respectively (Fig. S13†). On the other hand, the compound 1 is almost non-emissive.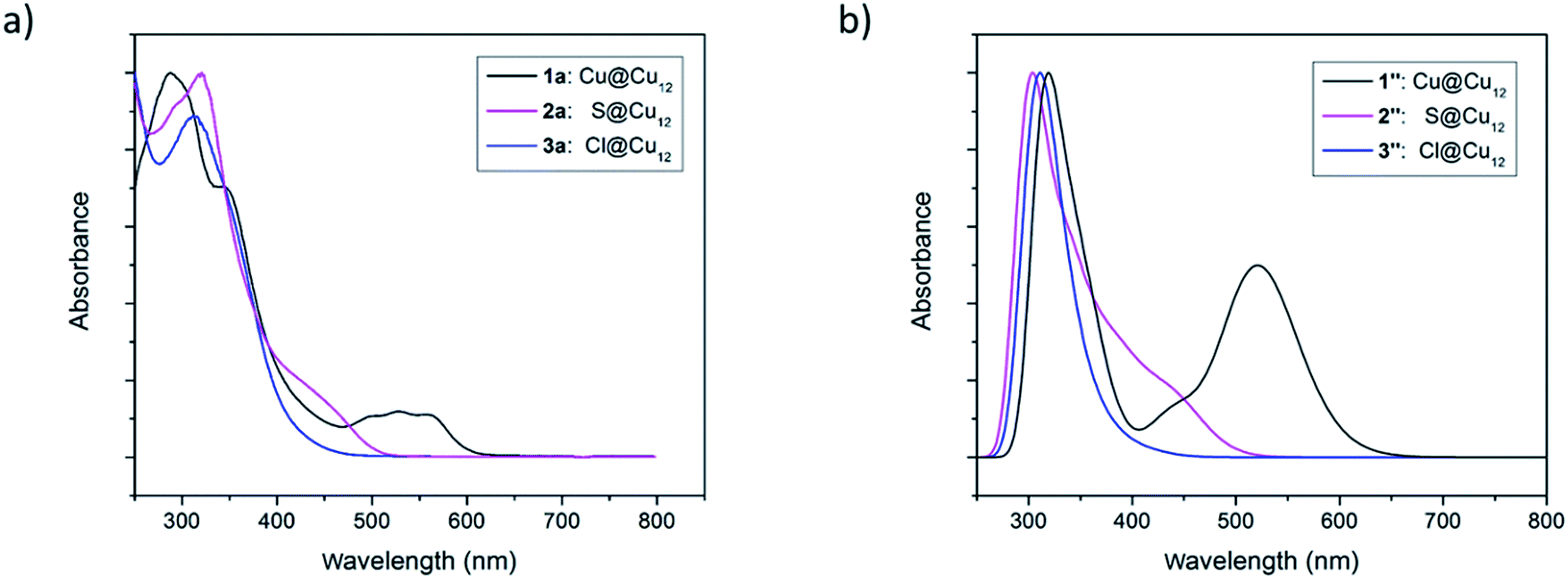 | ||
| Fig. 6 (a) Experimental UV-vis absorption spectra of the clusters 1–3. (b) TDDFT-simulated UV-vis absorption spectra of the clusters 1′′–3′′. | ||
Theoretical investigations
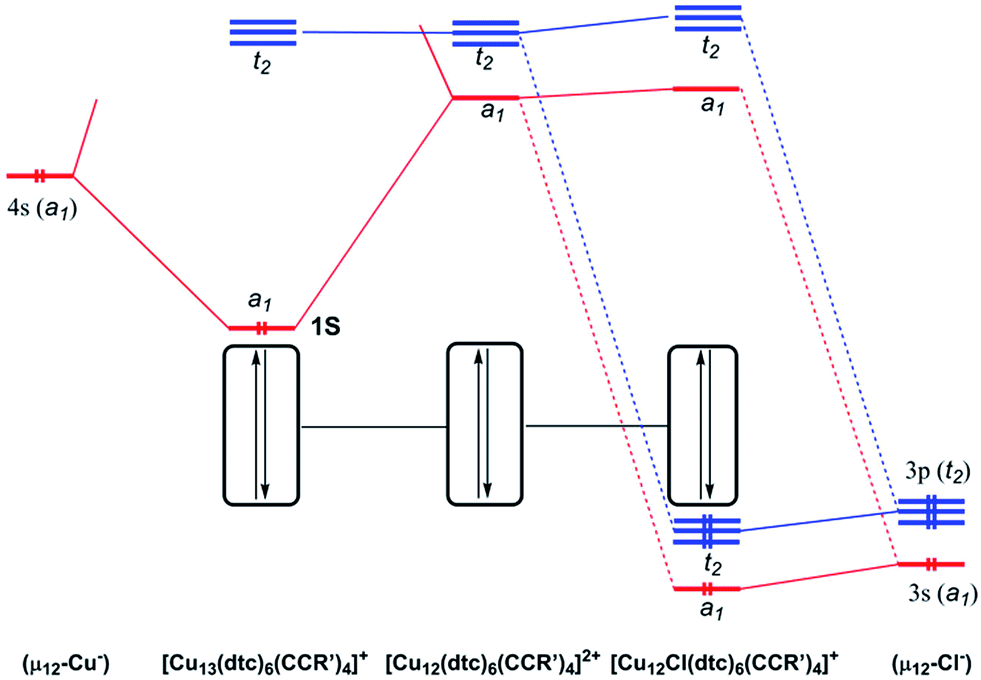
In order to shed some light on the bonding and properties of the reported inverse-coordinated clusters, density functional theory (DFT) calculations were performed on various model clusters. The simplest homologs of compounds 1–4, namely 1′–4′, were built with S2CNR2 = S2CNH2 and CCR′ = CCH. Relevant computed data are given in Table 3. The optimized geometries of 1′–4′ were all found to be of exact Td symmetry (no imaginary vibrational frequency). Their metrical parameters are in good agreement with the averaged experimental values of compounds 1–4 (Table 2). Unsurprisingly, the computed natural atomic orbital (NAO) charges are consistent with the formal oxidation state of the encapsulated element X being Cu−, S2−, Cl− and Br− in clusters 1′ to 4′, respectively, whereas those of the 12 cuboctahedral metals always indicate the Cu+ state. However, the differences between the computed and formal charges of X vary with its nature, indicating that the covalent component of the host–guest interaction decreases as Cu > S > Br ≈ Cl. The Cu–X Wiberg indices (Table 3) are also consistent with this view. Thus 1′ (X = Cu) is substantially more covalent than 3′ (X = Cl). The simplified interaction diagrams of Fig. 7 illustrate this situation. Considering that each approximately planar tricoordinated CuI cuboctahedral vertex has a 4p vacant orbital pointing toward the middle of the cage, one is left with 12 vacant combinations (a1 + e + t1 + 2t2) for the whole empty cage, of which the lowest ones (a1 + t2) constitute a nice set of accepting orbitals. In the case of X = Cu, the occupied 4s orbital of the encapsulated formally Cu1− metal and the a1 accepting orbital of the cage interact strongly, because of their proximity in energy. The resulting bonding a1 MO is substantially delocalized on the 13 copper atoms and therefore both Cucent–Cucage and Cucage–Cucage bonding arise. This MO can be identified as the 1S jellium orbital10 containing the 2 electrons of the superatom 1′.10 In the case of X = Cl, the occupied halide valence 3s and 3p orbitals can interact with the a1 and t2 accepting orbitals of the cage. However, because of the poor energy match between the interacting orbitals, the covalent interaction is weak. Thus, in the case of X = halogen or chalcogen, the host–guest bonding is dominated by its ionic component. Similar structural and bonding conclusions can be drawn for 5′ (simplified model for 5a) and the hypothetical [Cu12(μ12-Cl)(dtc)6Cl4]+ (6′).| X | HOMO–LUMO gap (eV) | Cu–Xavg. [range]a (Å) | WI(Cu–X)avg. [range]b | Cu–Curangea,b (Å) | WI(Cu–Cu) rangec | q(X)d | q(Cu)avg.a,d | |
|---|---|---|---|---|---|---|---|---|
| a Cu from the Cu12 cuboctahedron. b In the Td symmetry, there are two symmetry-independent cuboctahedral Cu–Cu edges. c WI: Wiberg index. d q: Natural atomic charge. | ||||||||
| 1′ (Td) | Cu | 3.08 | 2.666 | 0.061 | 2.595–2.725 | 0.047–0.050 | −0.54 | +0.69 |
| 1′′ (C1) | Cu | 3.08 | 2.675 [2.637–2.722] | [0.047–0.074] | 2.556–2.795 | 0.038–0.053 | −0.53 | +0.70 |
| 2′ (Td) | S | 3.56 | 2.674 | 0.047 | 2.619–2.728 | 0.033–0.034 | −1.61 | +0.74 |
| 2′′ (C1) | S | 3.53 | 2.747 [2.371–3.018] | 0.049 [0.014–0.104] | 2.532–3.276 | 0.008–0.048 | −1.59 | +0.75 |
| 3′ (Td) | Cl | 3.84 | 2.899 | 0.023 | 2.707–3.085 | 0.019–0.036 | −0.82 | +0.75 |
| 3′′ (C1) | Cl | 3.73 | 2.967 [2.721–3.271] | 0.023 [0.012–0.049] | 2.522–3.379 | 0.007–0.057 | −0.81 | +0.76 |
| 4′ (Td) | Br | 3.82 | 2.942 | 0.026 | 2.708–3.168 | 0.015–0.036 | −0.81 | +0.75 |
| 5′ (C3v) | Cl | 3.72 | 2.931 [2.791–3.071] | 0.024 [0.017–0.036] | 2.719–3.133 | 0.012–0.040 | −0.81 | +0.74 |
| 6′ (Td) | Cl | 4.07 | 2.971 | 0.026 | 2.829–3.111 | 0.039–0.054 | −0.80 | +0.70 |
 | ||
| Fig. 7 Simplified MO interaction diagram illustrating the strength of the covalent interaction between the [Cu12(dtc)6(CCR′)4]2+ cage and its host: left: Cu−, strong; right Cl−, weak (ideal Td symmetry assumed). | ||
In order to better reproduce the electronic properties of the experimental alkynyl ligands, models with CCR′ = CC(COOH) were also computed, keeping dtc = S2CNH2. These models, namely 1′′, 2′′ and 3′′, were considered for X = Cu, S and Cl, respectively. Interestingly, the resulting optimized structures exhibited distorted geometries of C1 symmetry (see Table 3). Whereas the distortion remains small in the case of 1′′, it is substantially larger for 2′′ and 3′′. This is exemplified by the large dispersion of the Cu–X distances in 2′′ and 3′′ (∼2.4–3.0 Å and ∼2.7–3.3 Å, respectively), as compared to that in 1′′ (∼2.6–2.7 Å). Nevertheless, the averaged values computed for 1′′–3′′ (Table 3) are very close to that of the symmetrical 1′–3′ models. So are also the X NAO charges. It is noteworthy that the distortions away from ideal Td symmetry afforded by 2′′–3′′ are not equivalent to those exhibited by the clusters 2 and 3 reported in Table 2. These distortions appear rather random and likely result principally from steric and/or crystal packing forces in the investigated clusters. The fact that in solution clusters 2–4 show only one set of ligands (in line with Td symmetry) at the NMR time scale is consistent with the primarily ionic character of the bonding between the encapsulated halide or chalcogenide and its [Cu12]12+ cage, as well as with the weak Cu+–Cu+ interaction along the cuboctahedral edges. As a whole, our experimental and computed data indicate that clusters of the type 2–4 have a soft flexible shape resulting from the ionic, non-directed, nature of their host–guest interaction.
Time-dependent DFT (TD-DFT) calculations were performed to simulate the UV-vis spectra of clusters 1–3. Because of their high symmetry, the spectra obtained for the 1′–3′Td models (Fig. S14†) are more structured than that of their 1′′–3′′ homologs (Fig. 6b), the latter being thus closer to the experimental ones (Fig. 6a). The low-energy band observed for 1a at 540 nm is computed at 538 nm for 1′ and corresponds to a HOMO (a1)–LUMO (t2) transition, a mixture of MMCT and MLCT (L = dtc) characters. As illustrated above in Fig. 7, the 1S HOMO present in 1′ does not exist in the halide- or chalcogenide-centered species. Consequently, the latter cannot exhibit the same low-energy band. The band observed for 2a at 450 nm corresponds to a HOMO (t2) → LUMO (t2) transition computed at 446 nm for 2′. It is of MLCT (L = dtc) nature. A similar low-energy MLCT transition is computed at 390 nm for 3′. For the three models, the major transitions of higher energy are mainly of MLCT character.
Conclusions
In summary, we have isolated and fully characterized [Cu13(alkynyl)4(dtc)6](PF6) clusters, the first copper-centred cuboctahedral copper NCs, a miniature of the bulk copper fcc structure, with partial Cu(0) character confirmed by XANES. Furthermore, they have been reacted to synthesize novel chalcogen- and halogen-centered cuboctahedral copper clusters [Cu12(μ12-X)(alkynyl)4(dtc)6]z+ (E = Cl, Br, S). These clusters are the first examples of compounds in which a sulfide, chloride or bromide ion holds a so large coordination number (12). Prior to this report, the highest coordination number for sulfur and bromine was nine, and eight for chlorine. Bonding interactions between the Cu12 cuboctahedral cage and the encapsulated element (X), rationalized by DFT calculations, indicate that the covalent component of the host–guest bonding interaction decreases as Cu > S > Br ≈ Cl. While the nature of the low-energy band observed for 1a can be reasonably assigned as a mixture of MMCT and MLCT (L = dtc) characters, it is primarily MLCT transition (L = dtc) for 2 and 3. Strikingly, new compounds have been prepared via replacing alkynyl with chloride. This synthetic methodology may open an avenue for the rational synthesis of organometallic compounds other than the spontaneous self-assembly. The new compounds synthesized are well characterized and the physical properties are explained by both theory and experimental methods.Experimental section
General procedures and instrumentation
All chemicals were purchased from commercial sources and used as received. Solvents were purified following standard protocols. All reactions were performed in oven-dried Schlenk glassware using standard inert atmosphere techniques. All reactions were carried out in a N2 atmosphere by using standard Schlenk techniques. [Cu28H15(S2CNnBu2)12]PF6 was prepared by a slightly modified procedure reported previously in the literature and characterized.19 NMR spectra were recorded on a Bruker Advance DPX300 FT-NMR spectrometer operating at 300 MHz. The chemical shift (δ) and coupling constant (J) are reported in ppm and Hz, respectively. 31P NMR spectra were referenced to external 85% H3PO4 at δ 0.00. The ESI-mass spectrum was recorded on a Fison Quattro Bio-Q (Fisons Instruments, VG Biotech, UK). XANES spectra at the Cu K-edge were recorded in transmission mode at beamline TLS-17C1 of the National Synchrotron Radiation Research Center (NSRRC), Taiwan. The electron storage ring was operated at 1.5 GeV with a beam current of 360 mA under top-up injection. A double-crystal Si(111) monochromator was employed for energy scanning. Incident and transmitted beam intensities were measured using gas-filled ionization chambers. An appropriate amount of each sample was adopted to reach the optimal thickness with the spectral edge jump being roughly unity. A standard Cu foil was measured simultaneously by using a third ionization chamber so that energy calibration could be performed scan by scan.General synthetic method for the isolation of 1
In a flame-dried Schlenk tube, [Cu28(H)15(S2CNR2)12](PF6) (0.1 mmol) was suspended in THF (5 cm3) along with the terminal alkyne (1 mmol) and the resulting mixture was stirred at 30 °C for 24 h. The solvent was evaporated under vacuum and the residue was washed with diethyl ether (3 × 5 mL) to remove impurities from the ligand and the dark red residue was extracted in methanol. Finally, the solvent was evaporated to dryness under vacuum to get 1 as a pure powder in 40–70% yields. In this reaction, the corresponding alkene and [Cu8H(S2CNR2)6]PF6 were produced as by-products.![[triple bond, length as m-dash]](https://www.rsc.org/images/entities/b_char_e002.gif) CCOOEt)4]PF6 (1b).
(0.150 g, 42%, based on Cu): ESI-MS: m/z 2438.6 (M+). 1H NMR (300 MHz, CDCl3): 4.15 (br, 8H, OCH2), 4.02 (t, 24H, NCH2), 1.79 (br, 24H, CH2), 1.36 (br, 24H, CH2CH3), 1.27 (t, 12H, OCH2CH3), 0.94 (t, 36H, CH3) ppm; 13C NMR (300 MHz, CDCl3): 203.6, 152.7, 78.2, 74.8, 62.8, 52.1, 29.2, 20.1, 14.2, 13.7; 31P NMR (300 MHz, CDCl3): −143.5 ppm; FT-IR data in KBr pellet (cm−1): 2972.1, 1503, 942, 843.
CCOOEt)4]PF6 (1c).
(0.150 g, 65%, based on Cu): ESI-MS: m/z 2270.3 (M+). 1H NMR (300 MHz, CDCl3): 5.96 (br, 6H, NCH), 4.18 (br, 6H, NCH), 3.95 (br, 8H, OCH2), 1.63 (br, 36H, CH3), 1.31 (br, 36H, CH3), 1.29 (t, 12H, OCH2CH3) ppm; 13C NMR (300 MHz, CDCl3): 201.2, 152.5, 78.5, 74.8, 62.6, 57.6, 20.5, 13.6; 31P NMR (300 MHz, CDCl3): −143.5 ppm; FT-IR data in KBr pellet (cm−1): 2961.1, 2931.7, 2872.7, 2009.1, 1594.0, 1498.4, 1233.3, 1143.2, 1080.0, 1027.5, 941.4, 835.3, 719.8, 557.2.
CC6H3(CF3)2}4]PF6 (1d).
(0.150 g, 55%, based on Cu): ESI-MS: m/z 2830.3 (M+). 1H NMR (CDCl3): 7.87 (br, 12H, ArH), 3.95 (br, 24H, NCH2), 1.86 (br, 24H, CH2CH3), 0.96 (t, 36H, CH3) ppm; 13C NMR (300 MHz, CDCl3): 200.8, 132.7, 130.9, 123.3, 122.8, 88.5, 78.2, 55.7, 20.3, 12.2; 31P NMR (CDCl3): −143.5 ppm; FT-IR data in KBr pellet (cm−1): 2972.1, 1503, 942, 843.
CCOOEt)4]PF6 (1b).
(0.150 g, 42%, based on Cu): ESI-MS: m/z 2438.6 (M+). 1H NMR (300 MHz, CDCl3): 4.15 (br, 8H, OCH2), 4.02 (t, 24H, NCH2), 1.79 (br, 24H, CH2), 1.36 (br, 24H, CH2CH3), 1.27 (t, 12H, OCH2CH3), 0.94 (t, 36H, CH3) ppm; 13C NMR (300 MHz, CDCl3): 203.6, 152.7, 78.2, 74.8, 62.8, 52.1, 29.2, 20.1, 14.2, 13.7; 31P NMR (300 MHz, CDCl3): −143.5 ppm; FT-IR data in KBr pellet (cm−1): 2972.1, 1503, 942, 843.
CCOOEt)4]PF6 (1c).
(0.150 g, 65%, based on Cu): ESI-MS: m/z 2270.3 (M+). 1H NMR (300 MHz, CDCl3): 5.96 (br, 6H, NCH), 4.18 (br, 6H, NCH), 3.95 (br, 8H, OCH2), 1.63 (br, 36H, CH3), 1.31 (br, 36H, CH3), 1.29 (t, 12H, OCH2CH3) ppm; 13C NMR (300 MHz, CDCl3): 201.2, 152.5, 78.5, 74.8, 62.6, 57.6, 20.5, 13.6; 31P NMR (300 MHz, CDCl3): −143.5 ppm; FT-IR data in KBr pellet (cm−1): 2961.1, 2931.7, 2872.7, 2009.1, 1594.0, 1498.4, 1233.3, 1143.2, 1080.0, 1027.5, 941.4, 835.3, 719.8, 557.2.
CC6H3(CF3)2}4]PF6 (1d).
(0.150 g, 55%, based on Cu): ESI-MS: m/z 2830.3 (M+). 1H NMR (CDCl3): 7.87 (br, 12H, ArH), 3.95 (br, 24H, NCH2), 1.86 (br, 24H, CH2CH3), 0.96 (t, 36H, CH3) ppm; 13C NMR (300 MHz, CDCl3): 200.8, 132.7, 130.9, 123.3, 122.8, 88.5, 78.2, 55.7, 20.3, 12.2; 31P NMR (CDCl3): −143.5 ppm; FT-IR data in KBr pellet (cm−1): 2972.1, 1503, 942, 843.
General synthetic method for the isolation of 2
In a flame-dried Schlenk tube, [Cu13(S2CNR2)6(CCR′)4](PF6) (0.1 mmol) was suspended in THF (5 cm3) along with K[S2CNR2] (0.22 mmol) and the resulting mixture was stirred at 0 °C for 24 h. The solvent was evaporated under vacuum and the desired compound was extracted in diethyl ether. Finally, the solvent was evaporated to dryness under vacuum to get 2 as a pure orange powder in 20–30% yields.
CCOOMe)4] (2a).
ESI-MS: m/z 2351.6 (M+). 1H NMR (300 MHz, CDCl3): 4.03 (t, 24H, NCH2), 3.73 (s, 12H, OCH3), 1.80 (br, 24H, CH2), 1.40 (br, 24H, CH2CH3), 0.99 (t, 36H, CH3) ppm; 13C NMR (300 MHz, CDCl3): 203.4, 152.5, 96.6, 84.5, 54.2, 51.9, 28.8, 20.2, 14.0; FT-IR data in KBr pellet (cm−1): 2962.2, 2937.2, 2874.3, 2015.1, 1694.3, 1502.3, 1297.7, 1218.2, 929.0, 845.3.
CCOOEt)4] (2b).
(0.150 g, 42%, based on Cu): ESI-MS: m/z 2407.5 (M+). 1H NMR (300 MHz, CDCl3): 4.14 (br, 8H, OCH2), 4.02 (t, 24H, NCH2), 1.78 (br, 24H, CH2), 1.37 (br, 24H, CH2CH3), 1.27 (t, 12H, OCH2CH3), 0.95 (t, 36H, CH3) ppm; 13C NMR (300 MHz, CDCl3): 203.8, 152.6, 78.5, 74.7, 62.7, 51.9, 28.9, 19.8, 14.4, 13.5; FT-IR data in KBr pellet (cm−1): 2972.1, 1503, 942, 843.
CCOOEt)4] (2c).
(0.150 g, 65%, based on Cu): ESI-MS: m/z 2239.0 (M+). 1H NMR (300 MHz, CDCl3): 5.92 (br, 6H, NCH), 4.10 (br, 6H, NCH), 3.92 (br, 8H, OCH2), 1.69 (br, 36H, CH3), 1.30 (br, 36H, CH3), 1.26 (t, 12H, OCH2CH3) ppm; 13C NMR (300 MHz, CDCl3): 200.7, 152.1, 78.8, 74.8, 62.3, 57.8, 21.2, 13.4; FT-IR data in KBr pellet (cm−1): 2961.1, 2931.7, 2872.7, 2009.1, 1594.0, 1498.4, 1233.3, 1143.2, 1080.0, 1027.5, 941.4, 835.3, 719.8, 557.2.
General synthetic method for the isolation of 3
In a flame-dried Schlenk tube, [Cu13(S2CNR2)6(CCR′)4](PF6) (0.1 mmol) was suspended in CH2Cl2 (5 cm3) and the resulting mixture was stirred at room temperature for 3 days. The solvent was evaporated under vacuum and the residue was washed with hexane, diethyl ether and methanol and the yellow residue was extracted in CH2Cl2. Finally, the solvent was evaporated to dryness and subjected to column chromatography to get 3 as a pure powder in 11–30% yields. Compound 5a was isolated as a byproduct in 5% yield.
CPh (0.08 mmol) and few drops of triethylamine were added and the reaction mixture was stirred at 0 °C for 10 minutes. To the reaction mixture, Bu4NX (0.02 mmol) was added and stirred for 12 hours. The solvent was evaporated and the residue was washed with hexane, ether and methanol. The yellow residue was extracted in dichloromethane and purified by passing through alumina, which yielded 3e and 4e in 45 and 52% yields respectively.
CCOOMe)4]PF6 (3a).
ESI-MS: m/z 2354.8 (M+). 1H NMR (300 MHz, CDCl3): 4.04 (t, 24H, NCH2), 3.71 (s, 12H, OCH3), 1.79 (br, 24H, CH2), 1.41 (br, 24H, CH2CH3), 0.98 (t, 36H, CH3) ppm; 13C NMR (300 MHz, CDCl3): 203.7, 150.2, 98.2, 81.8, 51.7, 53.0, 29.2, 21.1, 13.4; 31P NMR (300 MHz, CDCl3): −143.5 ppm; FT-IR data in KBr pellet (cm−1): 2960.2, 2937.0, 2873.5, 2017.5, 1690.4, 1498.2, 1292.4, 1220.6, 928.5, 844.6.
CCOOEt)4]PF6 (3b).
(0.150 g, 42%, based on Cu): ESI-MS: m/z 2410.7 (M+). 1H NMR (300 MHz, CDCl3): 4.15 (br, 8H, OCH2), 4.03 (t, 24H, NCH2), 1.80 (br, 24H, CH2), 1.37 (br, 24H, CH2CH3), 1.26 (t, 12H, OCH2CH3), 0.95 (t, 36H, CH3) ppm; 13C NMR (300 MHz, CDCl3): 201.5, 153.5, 77.9, 74.5, 62.6, 52.0, 28.9, 20.2, 14.3, 13.3; 31P NMR (300 MHz, CDCl3): −143.5 ppm; FT-IR data in KBr pellet (cm−1): 2972.1, 1503, 942, 843.
CCOOEt)4]PF6 (3c).
(0.150 g, 65%, based on Cu): ESI-MS: m/z 2242.5 (M+). 1H NMR (300 MHz, CDCl3): 5.95 (br, 6H, NCH), 4.16 (br, 6H, NCH), 4.10 (br, 8H, OCH2), 1.65 (br, 36H, CH3), 1.30 (br, 36H, CH3), 1.28 (t, 12H, OCH2CH3) ppm; 13C NMR (300 MHz, CDCl3): 202.1, 151.6, 78.7, 74.5, 62.3, 57.5, 20.6, 13.7; 31P NMR (300 MHz, CDCl3): −143.5 ppm; FT-IR data in KBr pellet (cm−1): 2961.1, 2931.7, 2872.7, 2009.1, 1594.0, 1498.4, 1233.3, 1143.2, 1080.0, 1027.5, 941.4, 835.3, 719.8, 557.2.
CC6H3(CF3)2}4]PF6 (3d).
(0.150 g, 55%, based on Cu): ESI-MS: m/z 2802.3 (M+). 1H NMR (300 MHz, CDCl3): 7.88 (br, 12H, ArH), 3.95 (br, 24H, NCH2), 1.85 (br, 24H, CH2CH3), 0.98 (t, 36H, CH3) ppm; 13C NMR (300 MHz, CDCl3): 199.8, 132.8, 131.6, 123.5, 123.0, 88.9, 78.6, 55.5, 20.2, 11.9; 31P NMR (300 MHz, CDCl3): −143.5 ppm; FT-IR data in KBr pellet (cm−1): 2972.1, 1503, 942, 843.
CPh)4]PF6 (3e).
ESI-MS: m/z 2426.4 (M+). 1H NMR (300 MHz, CDCl3): 7.15–7.56 (m, 20H, C6H5), 3.81 (t, 24H, NCH2), 1.62 (br, 24H, CH2), 1.26 (br, 24H, CH2CH3), 0.82 (t, 36H, CH3), ppm; 13C NMR (300 MHz, CDCl3): 202.5, 131.4, 128.1, 124.2, 59.4, 29.2, 20.4, 13.9; 31P NMR (300 MHz, CDCl3): −143.5 ppm; FT-IR data in CsI pellet (cm−1): 2957.8, 2931.8, 2887.8, 2018.9, 1739.4, 1502.2, 1292.6, 1220.5, 926.8, 843.4.
CPh)4]PF6 (4e).
ESI-MS: m/z 2470.5 (M+). 1H NMR (300 MHz, CDCl3): 7.15–7.56 (m, 20H, C6H5), 3.81 (t, 24H, NCH2), 1.62 (br, 24H, CH2), 1.26 (br, 24H, CH2CH3), 0.82 (t, 36H, CH3), ppm; 13C NMR (300 MHz, CDCl3): 202.0, 131.6, 128.4, 124.2, 58.9, 28.8, 20.4, 14.2; 31P NMR (300 MHz, CDCl3): −143.5 ppm; FT-IR data in CsI pellet (cm−1): 2959.4, 2932.0, 2889.2, 2020.4, 1739.6, 1502.2, 1292.6, 1220.6, 926.9, 843.4.
CCOOMe)3]+ (5a).
ESI-MS: m/z 2308.4 (M+). 1H NMR (300 MHz, CDCl3): 4.03 (t, 24H, NCH2), 3.70 (s, 9H, OCH3), 1.79 (br, 24H, CH2), 1.39 (br, 24H, CH2CH3), 0.97 (t, 36H, CH3) ppm; 13C NMR (300 MHz, CDCl3): 203.5, 150.7, 95.8, 82.7, 54.6, 51.8, 28.8, 21.2, 13.7; 31P NMR (300 MHz, CDCl3): −143.5 ppm; FT-IR data in KBr pellet (cm−1): 2960.6, 2933.5, 2877.5, 2020.2, 1686.4, 1507.6, 1292.4, 1220.8, 928.7, 842.9.
X-ray structure determination
Single crystals suitable for X-ray diffraction analysis of 2a–b, 3d–e, 4e and 5a were obtained by slowly diffusing hexane into a concentrated dichloromethane/acetone solution at ambient temperature. The single crystals were mounted on the tip of glass fibre coated in paratone oil, then frozen. Data were collected on a Bruker APEX II CCD diffractometer using graphite monochromated Mo Kα radiation (λ = 0.71073 Å) at 100 (3d, 3e), 150 (2a, 5a) and 296 (2b, 4e) K. Data reduction was performed with SAINT.20 Absorption corrections for the area detector were performed by using the SADABS program.21 The structure was solved by direct methods and refined by least-squares against F2 using the SHELXL-2018/3 package,22 incorporated in SHELXTL/PC V6.14.23 All non-hydrogen atoms were refined anisotropically. Geometric restraints for the sp3 carbon–carbon bond of these atoms were applied. In the crystal of 2a, the C(O)OMe motifs on two of four methyl propiolate groups were disordered over two positions with equal occupancy. Structures 2b, 3e and 4e contain large solvent-accessible voids, with substantial peaks of electron density visible inside these voids which could be due to the loss of solvent while mounting a single crystal at ambient temperature. In 3d, the cocrystallization of [Cl@Cu12(S2CNnPr2)6{CCC6H3(CF3)2}4]PF6 and [Cu@Cu12(S2CNnPr2)6{CCC6H3(CF3)2}4]PF6 was found. The central atom in the Cu12 cuboctahedral cage was refined with 70% Cl and 30% Cu. Cu1 and Cu1B are refined with occupancy ratio 0.7![[thin space (1/6-em)]](https://www.rsc.org/images/entities/char_2009.gif) :0.3. Thus, the composition in crystal 3d is {[Cl@Cu12(S2CNnPr2)6{CCC6H3(CF3)2}4]PF6}0.7{[Cu@Cu12(S2CNnPr2)6{CCC6H3(CF3)2}4]PF6}0.3. In 5a, eight cationic [Cu12(μ12-Cl)(μ3-Cl)(S2CNnBu2)6(CCCOOMe)3]+ molecules, four PF6− anions, and four Cl− anions were found in one unit cell. The chloride atom was further disordered at multiple positions. Thus, the composition in crystal 5a is [Cu12(μ12-Cl)(μ3-Cl)(S2CNnBu2)6(CCCOOMe)3](PF6)0.5(Cl)0.5. CCDC 1501795 (1a), 1815418 (2a), 1815419 (2b), 1815421 (3d), 1815422 (3e), 1815423 (4e) and 1815424 (5a) contain the ESI crystallographic data for this paper.†
:0.3. Thus, the composition in crystal 3d is {[Cl@Cu12(S2CNnPr2)6{CCC6H3(CF3)2}4]PF6}0.7{[Cu@Cu12(S2CNnPr2)6{CCC6H3(CF3)2}4]PF6}0.3. In 5a, eight cationic [Cu12(μ12-Cl)(μ3-Cl)(S2CNnBu2)6(CCCOOMe)3]+ molecules, four PF6− anions, and four Cl− anions were found in one unit cell. The chloride atom was further disordered at multiple positions. Thus, the composition in crystal 5a is [Cu12(μ12-Cl)(μ3-Cl)(S2CNnBu2)6(CCCOOMe)3](PF6)0.5(Cl)0.5. CCDC 1501795 (1a), 1815418 (2a), 1815419 (2b), 1815421 (3d), 1815422 (3e), 1815423 (4e) and 1815424 (5a) contain the ESI crystallographic data for this paper.†
Crystallographic data of 2a: C70H120Cu12N6O8S13, orthorhombic, P212121, a = 18.2449(13) Å, b = 23.2180(15) Å, c = 23.3841(17) Å. α = 90°, β = 90°, γ = 90°. V = 9905.7(12) Å3, Z = 4, ρ calcd = 1.578 cm−3, μ = 2.840 mm−1, 56212 measured reflections, 17421 independent reflections (Rint = 0.0477), R1 = 0.0717 [I > 2σ(I)], wR2 = 0.2124 (all data), flack parameter: 0.05(3), goodness-of-fit on F2: 1.069. Crystallographic data of 2b: C74H128Cu12N6O8S13, orthorhombic, P212121, a = 19.1023(9) Å, b = 23.8001(11) Å, c = 24.5421(12) Å. α = 90°, β = 90°, γ = 90°. V = 11157.7(9) Å3, Z = 4, ρ calcd = 1.434 cm−3, μ = 2.523 mm−1, 125549 measured reflections, 19663 independent reflections (Rint = 0.0374), R1 = 0.0490 [I > 2σ(I)], wR2 = 0.1406 (all data), flack parameter: −0.004(4), goodness-of-fit on F2: 1.043. Crystallographic data of 3d: C85H102Cl0.7Cu12.3F30N6OPS12, orthorhombic, Pnna, a = 21.8103(5) Å, b = 22.9770(6) Å, c = 22.0395(6) Å. α = 90°, β = 90°, γ = 90°. V = 11044.8(5) Å3, Z = 4, ρ calcd = 1.814 cm−3, μ = 2.670 mm−1, 90620 measured reflections, 9730 independent reflections (Rint = 0.0303), R1 = 0.0450 [I > 2σ(I)], wR2 = 0.1122 (all data), goodness-of-fit on F2: 1.099. Crystallographic data of 3e: C175H262Cl2Cu24F12N12OP2S24, triclinic, P![[1 with combining macron]](https://www.rsc.org/images/entities/char_0031_0304.gif) , a = 17.6501(6) Å, b = 19.8146(6) Å, c = 32.8484(11) Å. α = 86.5157(9)°, β = 89.7691(9)°, γ = 75.7750(8)°. V = 11114.5(6) Å3, Z = 2, ρ calcd = 1.555 cm−3, μ = 2.561 mm−1, 83631 measured reflections, 39024 independent reflections (Rint = 0.0260), R1 = 0.0664 [I > 2σ(I)], wR2 = 0.1885 (all data), goodness-of-fit on F2: 1.107. Crystallographic data of 4e: C86H128BrCu12F6N6PS12, triclinic, P, a = 17.7551(15) Å, b = 19.6625(17) Å, c = 32.767(3) Å. α = 85.8425(17)°, β = 85.6980(17)°, γ = 76.1094(16)°. V = 11055.9(16) Å3, Z = 4, ρ calcd = 1.573 cm−3, μ = 2.911 mm−1, 63677 measured reflections, 38372 independent reflections (Rint = 0.0533), R1 = 0.0806 [I > 2σ(I)], wR2 = 0.2652 (all data), goodness-of-fit on F2: 1.047. Crystallographic data of 5a: C132H234Cl5Cu24F6N12O12PS24, monoclinic, C2/c, a = 31.396(3) Å, b = 19.8294(17) Å, c = 33.181(3) Å. α = 90°, β = 97.8261(17)°, γ = 90°. V = 20465(3) Å3, Z = 4, ρ calcd = 1.557 cm−3, μ = 2.804 mm−1, 56963 measured reflections, 17945 independent reflections (Rint = 0.0445), R1 = 0.0997 [I > 2σ(I)], wR2 = 0.2334 (all data), goodness-of-fit on F2: 1.015.
, a = 17.6501(6) Å, b = 19.8146(6) Å, c = 32.8484(11) Å. α = 86.5157(9)°, β = 89.7691(9)°, γ = 75.7750(8)°. V = 11114.5(6) Å3, Z = 2, ρ calcd = 1.555 cm−3, μ = 2.561 mm−1, 83631 measured reflections, 39024 independent reflections (Rint = 0.0260), R1 = 0.0664 [I > 2σ(I)], wR2 = 0.1885 (all data), goodness-of-fit on F2: 1.107. Crystallographic data of 4e: C86H128BrCu12F6N6PS12, triclinic, P, a = 17.7551(15) Å, b = 19.6625(17) Å, c = 32.767(3) Å. α = 85.8425(17)°, β = 85.6980(17)°, γ = 76.1094(16)°. V = 11055.9(16) Å3, Z = 4, ρ calcd = 1.573 cm−3, μ = 2.911 mm−1, 63677 measured reflections, 38372 independent reflections (Rint = 0.0533), R1 = 0.0806 [I > 2σ(I)], wR2 = 0.2652 (all data), goodness-of-fit on F2: 1.047. Crystallographic data of 5a: C132H234Cl5Cu24F6N12O12PS24, monoclinic, C2/c, a = 31.396(3) Å, b = 19.8294(17) Å, c = 33.181(3) Å. α = 90°, β = 97.8261(17)°, γ = 90°. V = 20465(3) Å3, Z = 4, ρ calcd = 1.557 cm−3, μ = 2.804 mm−1, 56963 measured reflections, 17945 independent reflections (Rint = 0.0445), R1 = 0.0997 [I > 2σ(I)], wR2 = 0.2334 (all data), goodness-of-fit on F2: 1.015.
Computational details
Geometry optimizations were performed using DFT calculations with the Gaussian 09 package,24 using the PBE0 functional25 and the all-electron Def2-TZVPP set from EMSL Basis Set Exchange Library.26 All the optimized geometries were characterized as true minima on their potential energy surface by harmonic vibrational analysis. The Wiberg bond indices were computed with the NBO 5.0 program.27 The UV-visible transitions were calculated by means of TD-DFT calculations,28 at the PBE0/Def2-TZVP level. Only singlet–singlet, i.e. spin-allowed, transitions were computed. The UV-visible spectra were simulated from the computed TD-DFT transitions and their oscillator strengths by using the SWizard program,29 each transition being associated with a Gaussian function of half-height width equal to 1500 cm−1. The compositions of the molecular orbitals were calculated using the AOMix program.30Conflicts of interest
There are no conflicts to declare.Acknowledgements
This work was supported by the Ministry of Science and Technology in Taiwan (MOST 106-2113-M-259-010). The GENCI-CINES and GENCI-IDRISS French national computer centres are acknowledged for computational resources (grant x2016-087367).Notes and references
-
(a) I. Haiduc, Coord. Chem. Rev., 2017, 338, 1–26 CrossRef
; (b) I. Haiduc, Coord. Chem. Rev., 2017, 348, 71–91 CrossRef
-
(a) C. W. Liu, H.-W. Chang, C.-S. Fang, B. Sarkar and J.-C. Wang, Chem. Commun., 2010, 46, 4571–4573 RSC
-
(a) R. S. Dhayal, J.-H. Liao, Y.-R. Lin, P.-K. Liao, S. Kahlal, J.-Y. Saillard and C. W. Liu, J. Am. Chem. Soc., 2013, 135, 4704–4707 CrossRef PubMed
-
(a) J.-H. Liao, C. Latouche, B. Li, S. Kahlal, J.-Y. Saillard and C. W. Liu, Inorg. Chem., 2014, 53, 2260–2267 CrossRef PubMed
-
(a) B. Li, J.-H. Liao, H.-T. Tang, Y.-J. Li and C. W. Liu, Dalton Trans., 2013, 42, 14384–14387 RSC
- F. Scherbaum, A. Grohmann, B. Huber, C. Krgger and H. Schmidbaur, Angew. Chem., Int. Ed. Engl., 1988, 27, 1544–1546 CrossRef
-
(a) Y.-Q. Hu, M.-H. Zeng, K. Zhang, S. Hu, F.-F. Zhou and M. Kurmoo, J. Am. Chem. Soc., 2013, 135, 7901–7908 CrossRef PubMed
-
(a) S. J. Hilsenbeck, V. G. Young Jr and R. E. McCarley, Inorg. Chem., 1994, 33, 1822–1832 CrossRef
-
(a) R. P. B. Silalahi, K. K. Chakrahari, J.-H. Liao, S. Kahlal, Y.-C. Liu, M.-H. Chiang, J.-Y. Saillard and C. W. Liu, Chem.–Asian J., 2018, 13, 500–504 CrossRef PubMed
-
(a) W. A. de Heer, Rev. Mod. Phys., 1993, 65, 611–675 CrossRef
- T.-A. D. Nguyen, Z. R. Jones, B. R. Goldsmith, W. R. Buratto, G. Wu, S. L. Scott and T. W. Hayton, J. Am. Chem. Soc., 2015, 137, 13319–13324 CrossRef PubMed
- T.-A. D. Nguyen, Z. R. Jones, D. F. Leto, G. Wu, S. L. Scott and T. W. Hayton, Chem. Mater., 2016, 28, 8385–8390 CrossRef
- A. W. Cook, Z. R. Jones, G. Wu, S. L. Scott and T. W. Hayton, J. Am. Chem. Soc., 2018, 140, 394–400 CrossRef PubMed
- H.-Y. Chao, L. Wu, B.-C. Su and X.-L. Feng, Inorg. Chem. Commun., 2011, 14, 122–124 CrossRef
- G. Hogarth, Prog. Inorg. Chem., 2005, 53, 71 Search PubMed
-
(a) R. S. Dhayal, J.-H. Liao, Y.-C. Liu, M.-H. Chiang, S. Kahlal, J.-Y. Saillard and C. W. Liu, Angew. Chem., Int. Ed., 2015, 54, 3702–3706 CrossRef PubMed
-
(a) P. Betz, B. Krebs and G. Henkel, Angew. Chem., Int. Ed. Engl., 1984, 23, 311–312 CrossRef
-
(a) S.-P. Huang and M. G. Kanatzidis, Angew. Chem., Int. Ed. Engl., 1992, 31, 787–789 CrossRef
- P. V. V. N. Kishore, J.-H. Liao, H.-N. Hou, Y.-R. Lin and C. W. Liu, Inorg. Chem., 2016, 55, 3663–3673 CrossRef PubMed
-
SAINT V4.043: Software for CCDC Detector System, Bruker Analystic X-ray Systems, Madison, WI, 1995 Search PubMed
-
G. M. Sheldrick, SADABS, University of Göttingen, Göttingen, Germany, 1996 Search PubMed
- G. M. Sheldrick, Acta Crystallogr., 2015, C71, 3 CrossRef PubMed
-
SHELXL v6.14 (PC version) Program Library for Structure Solution and Molecular Graphics, Bruker Analytical X-ray Systems, Madison, WI, 1998 Search PubMed
-
M. J. Frisch, G. W. Trucks, H. B. Schlegel, G. E. Scuseria, M. A. Robb, J. R. Cheeseman, G. Scalmani, V. Barone, B. Mennucci, G. A. Petersson, H. Nakatsuji, M. Caricato, X. Li, H. P. Hratchian, A. F. Izmaylov, J. Bloino, G. Zheng, J. L. Sonnenberg, M. Hada, M. Ehara, K. Toyota, R. Fukuda, J. Hasegawa, M. Ishida, T. Nakajima, Y. Honda, O. Kitao, H. Nakai, T. Vreven, J. A. Montgomery Jr, J. E. Peralta, F. Ogliaro, M. Bearpark, J. J. Heyd, E. Brothers, K. N. Kudin, V. N. Staroverov, R. Kobayashi, J. Normand, K. Raghavachari, A. Rendell, J. C. Burant, S. S. Iyengar, J. Tomasi, M. Cossi, N. Rega, J. M. Millam, M. Klene, J. E. Knox, J. B. Cross, V. Bakken, C. Adamo, J. Jaramillo, R. Gomperts, R. E. Stratmann, O. Yazyev, A. J. Austin, R. Cammi, C. Pomelli, J. W. Ochterski, R. L. Martin, K. Morokuma, V. G. Zakrzewski, G. A. Voth, P. Salvador, J. J. Dannenberg, S. Dapprich, A. D. Daniels, O. Farkas, J. B. Foresman, J. V. Ortiz, J. Cioslowski and D. J. Fox, Gaussian 09, Revision E.01, Gaussian, Inc., Wallingford CT, 2009 Search PubMed
-
(a) J. P. Perdew, M. Ernzerhof and K. Burke, J. Chem. Phys., 1996, 105, 9982–9985 CrossRef
- F. Weigend and R. Ahlrichs, Phys. Chem. Chem. Phys., 2005, 7, 3297–3305 RSC
-
E. D. Glendening, J. K. Badenhoop, A. E. Reed, J. E. Carpenter, J. M. Bohmann, C. M. Morales and F. Weinhold, Theoretical Chemistry Institute, University of Wisconsin, Madison, WI, 2001, http://www.chem.wisc.edu/%7Enbo5
-
K. Burke and E. K. U. Gross, A guided tour of Time-Dependent Density Functional Theory, in Density Functionals: Theory and Applications, (Lecture Notes in physics), ed. D. Joubert, Springer, 1998, vol. 500 Search PubMed
-
S. I. Gorelsky, SWizard program, revision 4.5, http://www.sg-chem.net/ Search PubMed
-
S. I. Gorelsky, AOMix program, http://www.sg-chem.net/ Search PubMed
Footnote |
| † Electronic supplementary information (ESI) available. CCDC 1501795, 1815418, 1815419, 1815421–1815424. For ESI and crystallographic data in CIF or other electronic format see DOI: 10.1039/c8sc01508b |
| This journal is © The Royal Society of Chemistry 2018 |