 Open Access Article
Detection and identification of designer drugs by nanoparticle-based NMR chemosensing†
Luca
Gabrielli‡
,
Daniele
Rosa-Gastaldo‡
 ,
Marie-Virginie
Salvia§
 ,
Sara
Springhetti
,
Federico
Rastrelli
,
Sara
Springhetti
,
Federico
Rastrelli
 and
Fabrizio
Mancin
 *
*
Dipartimento di Scienze Chimiche, Università di Padova, Via Marzolo 1, 35131 Padova, Italy. E-mail: fabrizio.mancin@unipd.it
First published on 25th April 2018
Abstract
Properly designed monolayer-protected nanoparticles (2 nm core diameter) can be used as nanoreceptors for selective detection and identification of phenethylamine derivatives (designer drugs) in water. The molecular recognition mechanism is driven by the combination of electrostatic and hydrophobic interactions within the coating monolayer. Each nanoparticle can bind up to 30–40 analyte molecules. The affinity constants range from 105 to 106 M−1 and are modulated by the hydrophobicity of the aromatic moiety in the substrate. Detection of drug candidates (such as amphetamines and methamphetamines) is performed by using magnetization (NOE) or saturation (STD) transfer NMR experiments. In this way, the NMR spectrum of the drug is isolated from that of the mixture, allowing broad-class multianalyte detection and even identification of unknowns. The introduction of a dimethylsilane moiety in the coating monolayer allows performing STD experiments in complex mixtures. In this way, a detection limit of 30 μM is reached with standard instruments.
Introduction
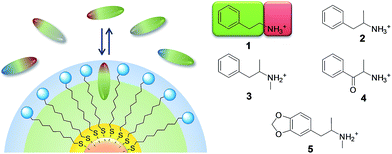
“Designer drugs” are psychotropic substances usually synthesized by modification of existing drugs.1 Being new substances, they elude both classification as illicit substances and identification by standard analytical methods. For this reason, and because the emergence of such drugs has dramatically increased in the past few years, the threat they pose to society is relevant.2 In 2014–2017, 265 new psychoactive substances were reported to the EU's early warning system.3 Two of the most relevant families of designer drugs are amphetamines (2–3, Fig. 1) and cathinones (4), which share a quite similar chemical structure based on the 2-phenylethanamine (phenethylamine, 1, Fig. 1) backbone.Detection and identification of these substances, which lack certified analytical standards, is a major challenge for forensic and customs laboratories.4 Standard procedures for the identification of new substances require time-consuming isolation and careful identification by NMR spectroscopy.4,5 On-site detection kits are commercially available for early screening and even “in-home” quality control. These are based on chromogenic chemical reactions6 or antibody-based immunoassays.7 However, they provide qualitative results which need validation by more sophisticated analysis and may easily fail in identifying new substances.7
Chemosensors provide an alternative detection approach that can be applied both to “on field” testing and quantitative determination.8 In addition, they can usually operate directly on the sample under analysis, without the need for any pre-treatment.9 A few supramolecular chemosensors have recently been proposed for the detection of drugs of abuse.10 Most of the systems reported are based on cavitand hosts, such as cucurbituril or resorcinarene tetraphosphonate derivatives, capable of recognizing amphiphilic organic cations in water.11–13 Signal generation is obtained by the alteration of the properties of receptor-conjugated fluorescent dyes11a,b,13b or materials, such as organic field-effect transistors,12 or cantilevers of an atomic force microscope (AFM),13 or via indicator displacement.11c All such systems, however, while capable of individuating specific drug classes or subclasses, cannot identify them or distinguish them from similar substances.
The lack of the ability to discriminate and identify different substances is a common drawback for most chemosensors.14 Indeed, the detection arises from the molecular recognition of the target molecule that triggers a signal generation mechanism. The information produced is hence related to the occurrence of the detection event and not to the analyte identity. Consequently, the chemosensor must be highly selective to avoid false positives, and this intrinsically reduces its scope to individual compounds or narrow classes of substances.
Several approaches have been proposed to address this limitation. “Lab-on-a-molecule” probes are chemosensors which can detect different analytes (by using one or more recognition sites) producing orthogonal signals.15 In this way, the chemosensor provides information not only on the presence but also on the nature of the analyte. In general, the number of analytes that can be detected by such systems is still relatively small. This problem has recently been overcome by the new generation of discriminative chemosensors, introduced by the groups of T. Swager16 and A. Schiller,17 which allow the identification of large numbers of molecules belonging to a related class. This result is obtained by taking advantage of the 19F-NMR signal of one or more fluorine atoms inserted into the chemosensor. The intrinsic high variability of 19F chemical shifts results in the generation of signals with a characteristic resonance frequency for each analyte. Even in this case, however, new molecules can be assigned to a specific class, but not identified.
A different and successful approach to multianalyte detection is “differential chemosensing”, which is based on arrays of sensing systems.14 The response pathway of the array provides a fingerprint typical of each analyte. This approach has recently been applied by Anzenbacher to the quantitative detection of opiates and their metabolites in human urine, by using an array of acyclic fluorescent cucurbiturils.11a,b In selected cases, unknown analytes can be assigned to a specific class14 but, again, they cannot be unequivocally identified.
In this framework, we recently proposed “nanoparticle-assisted NMR chemosensing” as a general method for direct detection and identification of broad analyte classes.18 In this approach, monolayer protected gold nanoparticles (MPGNs) act as self-organized receptors. Nanoparticle recognition is then exploited to extract the analyte NMR spectrum from that of the mixture, by use of diffusion-based experiments (DOSY or diffusion filters),18a along with magnetization (NOE-pumping)18b–d or saturation (STD) transfer protocols.18d
The main advantage of this method is that multianalyte detection can be extended to unknown compounds, since the detailed information contained in the NMR spectrum can lead to identification of a tentative structure.
In this paper we report the design and synthesis of a family of nanoparticle receptors capable of recognizing phenethylamine-related designer drugs, and we demonstrate their suitability for NMR-based detection, discrimination and identification of designer drugs in water, without any pre-treatment and at micromolar concentrations (Fig. 2).19
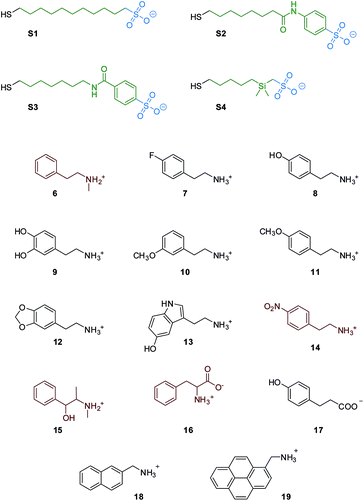 | ||
| Fig. 2 Nanoparticle coating thiols and substrates used in this work; substrates colored in red are not luminescent. | ||
Results and discussion
Nanoreceptor design
It is well known that small MPGNs coated with amphiphilic thiols, featuring a hydrocarbon chain and a polar end-group, can bind organic molecules with an amphiphilic structure in water.20,21 We recently showed that such a recognition is driven, in selected cases, by the formation of “cavitand-like” pockets in the coating monolayer.22 Affinity for amphiphilic organic anions can be strongly enhanced by decorating the monolayer with positively charged head-groups.18,23 The accommodation of the hydrophobic portion of the substrate in the alkyl portion of the monolayer and the simultaneous ion-pairing interaction with the head groups grant selectivity and high affinity (Fig. 1).Nicely enough, most psychoactive drugs, and in particular those based on the phenethylamine backbone, feature, at physiological pH, an amphiphilic structure with a positively charged ammonium group and lipophilic aromatic or carbocyclic moieties (Fig. 1). Consequently, we hypothesized that MPGNs coated with thiols featuring a hydrophobic portion and an anionic head-group should be able to act as broad-class receptors for phenethylamine derivatives.
With this in mind, we selected and synthesized thiols S1–S4. In S1 the hydrophobic portion is a simple alkyl chain, while in S2 and S3 a phenyl moiety was added via amide linkage. In S4 a dimethylsilane group was introduced for STD-NMR purpose, since it allows selective NP saturation without overlapping with the analyte signals. S1–S4 were used to synthesize MPGNs (S1/S4-AuNP) with an average gold core diameter of 1.6 ± 0.3 nm. The average molecular formula is Au140SR50 (see the ESI†). In all the cases the resulting nanoparticles were well soluble in water.
Nanoreceptor molecular recognition ability
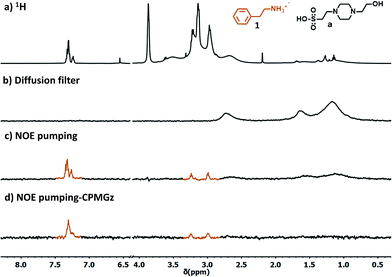
We selected the simplest S1-AuNP as the front-line candidate to test the ability of anionic nanoparticles to detect phenethylamine derivatives. The nanoparticles, at 15 μM concentration (corresponding to 1 mM concentration of coating molecules), were mixed with 2.0 mM phenethylamine (1) in deuterated water buffered at pD 7.0. Then, an “NOE pumping-CPMGz” experiment was performed (Fig. 3).18b,24 In this experiment, a diffusion filter, an NOE sequence and a T2 relaxation filter are concatenated before recording the signal. The diffusion filter dephases the magnetization of all the fast diffusing species in the sample but not that of the slow-diffusing nanoparticles (Fig. 3b). During the following NOE step, a part of the residual magnetization is transferred from the nanoparticles to any molecular species interacting (in a fast exchange regime) with them (Fig. 3c). Eventually, the T2 relaxation filter attenuates the signal of the slowly tumbling and conformationally hindered nanoparticle-coating ligands.25 As a result, only the signals of the molecules recognized by the nanoparticle receptor are present in the spectrum (Fig. 3d).The results reported in Fig. 3 confirmed the ability of S1-AuNP to recognize and detect phenethylamine. The four signals belonging to the five groups of magnetically equivalent protons in the substrate (two of them overlap to form a multiplet at 7.3 ppm) are the sole signals present in the NOE pumping-CPMGz spectrum and allow easy identification of the detected molecule. Interestingly, signals of other species present in the sample, such as water, residual solvents, and in particular the HEPES buffer, are not present in the final spectrum. Consequently, the two triplets at 2.9 and 3.2 ppm arising from the ethyl residue of 1, which are not visible in the 1H-NMR spectrum due to the overlap of the broad and intense HEPES signals, are clearly extracted in the final spectrum.
The ability of S1-AuNP nanoparticles to recognize the cationic amphiphilic structure of many designer drugs was confirmed by investigating the detection of other molecules with a similar structure (Fig. 4), including some neurotransmitters and drug precursors. Phenethylamine derivatives such as N-methylphenethylamine (6), 4-fluoro-phenethylamine (7), tyramine (8), dopamine (9), 3-methoxyphenethylamine (10), 4-methoxyphenethylamine (11), 3,4-methylenedioxyphenethyl amine (12), serotonine (13), 4-nitro-phenethylamine (14) and ephedrine (15) were all detected and identified from their distinctive 1H-NMR signals. On the other hand, molecules with similar structures but devoid of the cationic head group, such as phenylalanine (16), as well as hydrophilic organic molecules, such as HEPES, glucose and lactose (not shown), did not produce any signal in the NOE pumping experiments.
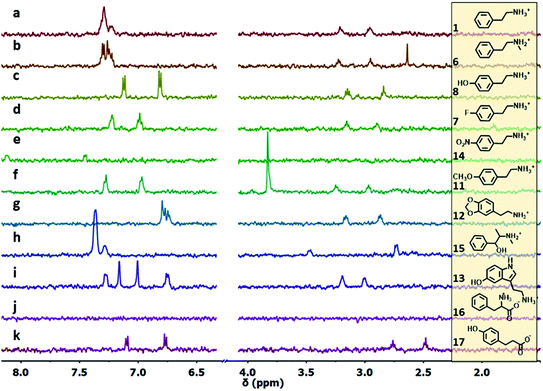 | ||
| Fig. 4 1H-NMR NOE pumping-CPMGz sub-spectra (3072 scans, 4 h) of AuNP-S1 (14 μM in D2O), HEPES buffer (10.0 mM) and different analytes (2 mM): (a)–(k). For 4-nitrophenethylamine (e), the NOE pumping spectrum is shown (same acquisition parameters). For 12 (g) and 15 (h), the signals respectively at 5.92, 5.11 and 1.04 ppm, present in the spectrum, are outside the spectral window shown for clarity (full spectra are reported in Fig. S23†). | ||
Surprisingly, phloretic acid (17) is detected, even if with lower sensitivity. This suggests that the electrostatic repulsion between the anionic headgroups of the nanoparticles and the carboxylate moiety of the amphiphilic substrate may not be sufficient to completely prevent the interaction. Still, even if the NMR spectrum of 17 is quite similar to that of the corresponding phenethylamine 8, identification of the compound as a carboxylate is quite simple, as the signals of the aliphatic methylenes shift from the region typical of phenethylamines (2.7–3.3 ppm) to that of phenethylcarboxylates (2.3–2.7 ppm).
To gain more insight into the recognition properties of S1-AuNP, we measured their affinity for different analytes by fluorescence titrations, taking advantage of the luminescence properties of molecules 7–13 and 17–19. The experiments were performed by adding increasing amounts of analytes to a 1.4 μM (0.1 mM concentration of coating molecules) solution of S1-AuNP in water at pH 7 (HEPES buffer 10 mM).26 Gold nanoparticles effectively quench the emission of dyes bound to the coating monolayer. When the affinity of the analytes for S1-AuNP was high enough, an initial quenching of the emission was observed (indicating the binding of the dye to the AuNPs) followed by a linear emission increase after saturation was reached (see ESI, Fig. S17 and S18†).
Emission intensity versus analyte concentration plots were fitted with a 1![[thin space (1/6-em)]](https://www.rsc.org/images/entities/char_2009.gif) :
:![[thin space (1/6-em)]](https://www.rsc.org/images/entities/char_2009.gif) 1 binding model. It is important to point out that this model assumes that multiple, equivalent and independent binding sites are present in the nanoparticle-coating monolayer. The results of the fittings are summarized in Table 1. Binding constant (K) values in the range 1 × 10⁵ to 1.3 × 10⁶ M−1 were found. Such values are consistent with those previously measured for the interaction of cationic nanoparticles with organic anions.18c Remarkably, a good linear correlation (Fig. 5) was found between log(K) values of the different analytes and their n-octanol/water partition coefficients computationally predicted at pH 7.4 (log
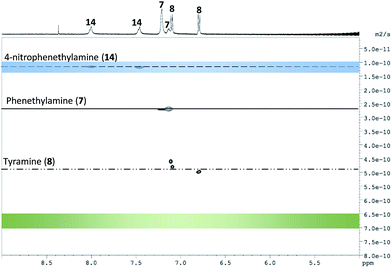
1 binding model. It is important to point out that this model assumes that multiple, equivalent and independent binding sites are present in the nanoparticle-coating monolayer. The results of the fittings are summarized in Table 1. Binding constant (K) values in the range 1 × 10⁵ to 1.3 × 10⁶ M−1 were found. Such values are consistent with those previously measured for the interaction of cationic nanoparticles with organic anions.18c Remarkably, a good linear correlation (Fig. 5) was found between log(K) values of the different analytes and their n-octanol/water partition coefficients computationally predicted at pH 7.4 (log![[thin space (1/6-em)]](https://www.rsc.org/images/entities/char_2009.gif) D). This confirms that the interaction between the nanoparticles and the analytes is modulated by the accommodation of the aromatic moiety in the hydrophobic portion of the monolayer (being the ion-pairing headgroup interaction similar in all the cases). The relatively small slope (0.26) suggests that hydrophobic “stabilization”27 provided by the alkyl chains in the monolayer is less effective than n-octanol solvation. The linear plot of Fig. 5 may in principle be used to extrapolate affinities for non-fluorescent analytes as 1, 14 and 15 (Table 1). To verify the reliability of the correlation and of the estimated data, we investigated the affinity of these analytes for S1-AuNPs by diffusion-ordered NMR spectroscopy (DOSY). The success of these experiments is based on the ability of the bulky nanoparticles to effectively perturb the apparent diffusion coefficients of the interacting analytes. In particular, being in a fast exchange regime on the NMR timescale, the apparent diffusion coefficient of each analyte will be the average between those of the free species and of the nanoparticles, weighted on the relative populations of bound and unbound analyte.18a,28 We selected phenethylamine (7), 4-nitrophenethylamine (14) and, as a control, tyramine (8), whose affinity for S1-AuNP had been measured by fluorescence titration.
D). This confirms that the interaction between the nanoparticles and the analytes is modulated by the accommodation of the aromatic moiety in the hydrophobic portion of the monolayer (being the ion-pairing headgroup interaction similar in all the cases). The relatively small slope (0.26) suggests that hydrophobic “stabilization”27 provided by the alkyl chains in the monolayer is less effective than n-octanol solvation. The linear plot of Fig. 5 may in principle be used to extrapolate affinities for non-fluorescent analytes as 1, 14 and 15 (Table 1). To verify the reliability of the correlation and of the estimated data, we investigated the affinity of these analytes for S1-AuNPs by diffusion-ordered NMR spectroscopy (DOSY). The success of these experiments is based on the ability of the bulky nanoparticles to effectively perturb the apparent diffusion coefficients of the interacting analytes. In particular, being in a fast exchange regime on the NMR timescale, the apparent diffusion coefficient of each analyte will be the average between those of the free species and of the nanoparticles, weighted on the relative populations of bound and unbound analyte.18a,28 We selected phenethylamine (7), 4-nitrophenethylamine (14) and, as a control, tyramine (8), whose affinity for S1-AuNP had been measured by fluorescence titration.
| Analyte | K, M−1 | [Binding sites], M | log![[thin space (1/6-em)]](https://www.rsc.org/images/entities/char_2009.gif) D (pH 7.4)b D (pH 7.4)b |
|---|---|---|---|
| a [1-AuNP] = 10 × 10−5 M, pH = 7.0 (HEPES buffer 10 mM). b Predicted with the ACD/Labs Percepta module, http://www.chemspider.com. c Not measurable as the substrate is not fluorescent. d Estimated from the plot in Fig. 5. e Values obtained by 9-displacement titration. f No binding observed. | |||
| 1 | 3.6 × 10⁵ , | —c | −0.84 |
| [(7.9 ± 0.8) × 105]e | [(3.8 ± 0.1) × 10−5]e | ||
| 7 | (2.6 ± 0.6) × 105 | (4.5 ± 0.3) × 10−5 | −0.85 |
| [(4.1 ± 0.4) × 105]e | [(4.2 ± 0.1) × 10−5]e | ||
| 8 | (1.3 ± 0.2) × 105 | (3.5 ± 0.2) × 10−5 | −2.01 |
| 9 | (1.2 ± 0.2) × 105 | (2.8 ± 0.2) × 10−5 | −2.18 |
| 10 | (4.1 ± 0.4) × 105 | (4.2 ± 0.1) × 10−5 | −1.04 |
| 11 | (4.8 ± 0.5) × 105 | (3.9 ± 0.1) × 10−5 | −1.04 |
| 12 | (3.9 ± 0.3) × 105 | (4.1 ± 0.1) × 10−5 | −0.87 |
| 13 | (2.7 ± 0.3) × 105 | (2.9 ± 0.1) × 10−5 | −1.71 |
| 14 | 4.6 × 10⁵ , | —c | −0.43 |
| 15 | 3.7 × 10⁵ , | —c | −0.75 |
| 16 | —c | —c | −1.46 |
| 17 | —f | —f | −1.24 |
| 18 | (6.1 ± 1.4) × 105 | (3.3 ± 0.1) × 10−5 | 0.55 |
| 19 | (2.2 ± 0.1) × 106 | (5.5 ± 0.1) × 10−5 | 2.16 |
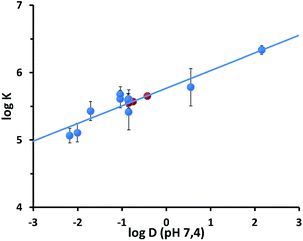 | ||
Fig. 5 Plot of the log![[thin space (1/6-em)]](https://www.rsc.org/images/entities/char_2009.gif) K vs. log K vs. log![[thin space (1/6-em)]](https://www.rsc.org/images/entities/char_2009.gif) D (pH = 7.4) values relative to the binding of the luminescent analytes 8–13 and 17–19 to S1-AuNP. The lines represent the linear fit of the data (R = 0.885). Red circles report the affinity values estimated for substrates 1, 14 and 15 on the basis of their log D (pH = 7.4) values relative to the binding of the luminescent analytes 8–13 and 17–19 to S1-AuNP. The lines represent the linear fit of the data (R = 0.885). Red circles report the affinity values estimated for substrates 1, 14 and 15 on the basis of their log![[thin space (1/6-em)]](https://www.rsc.org/images/entities/char_2009.gif) D values and the fitting parameters. The error bars reported represent the confidence intervals (3σ) calculated from standard deviations reported in Table 1. D values and the fitting parameters. The error bars reported represent the confidence intervals (3σ) calculated from standard deviations reported in Table 1. | ||
According to the estimated values of the binding constants, affinity of the three analytes for S1-AuNP should follow the order 14 > 1 > 7 (Table 1). When the mixture of the three molecules, each at 0.5 mM concentration, was analysed by DOSY-NMR in the presence of S1-AuNPs (45 μM), the three components were nicely separated according to their apparent diffusion coefficients, which decreased in perfect agreement with the predicted affinity order (Fig. 6). Nicely enough, the DOSY experiment reported in Fig. 6 also proves that S1-AuNP allows a multianalyte detection by solution-state “chromatographic NMR” as well.29
The number of binding sites in S1-AuNPs estimated with the luminescence titrations is in most cases between 30% and 40% of the number of coating thiols (Table 1), suggesting that each binding pocket in the monolayer is formed by about 3 thiols and that each nanoparticle can bind between 20 and 30 analyte molecules.
A displacement titration performed with 7 (Table 1) in the presence of 9 provided a number of binding sites similar to that obtained with the direct titration. This suggests that the incoming guest molecules occupy the same binding pockets of the leaving ones. The affinity constant measured with the displacement experiment is slightly larger than that obtained with direct titration.
Affinity tuning
NOE-pumping NMR and fluorescence titrations on selected analytes were then used to investigate the different recognition abilities of S1-, S2-, S3- and S4-AuNPs (Fig. 7). Modification of the nanoparticle coating thiols by introducing either an aromatic or a dimethylsilane moiety resulted in a reduction of the affinity for the analytes with respect to S1-AuNP. log![[thin space (1/6-em)]](https://www.rsc.org/images/entities/char_2009.gif) K versus log
K versus log![[thin space (1/6-em)]](https://www.rsc.org/images/entities/char_2009.gif) D plots (see ESI, Fig. S21†) remain linear, indicating that also with these nanoparticles the ion pairing and the hydrophobic interaction are the main, if not the sole, interactions at play. In the case of S4-AuNP, the slope of the plot (0.29) is very close to that obtained with S1-AuNP (0.26), indicating a similar sensitivity to substrate hydrophobicity and suggesting that the affinity decrease might arise from a weaker ion pairing interaction. The electron-donating propensity of the silicon atom may reduce the charge density of the sulfonate. In the case of S2-AuNP the slope is 0.37, indicating a stronger sensitivity to substrate hydrophobicity. Still, affinities measured are always smaller than those of S1-AuNPs. The aromatic residue produces apparently two different effects: on one hand it decreases, via delocalization, the charge density at the sulfonate; on the other hand, it increases the stabilization of the hydrophobic portion of the substrates. The reduction of ion pairing ability is presumably stronger with S3-AuNP due to the presence of the electron-withdrawing carbonyl group in the para position. Indeed, affinity generally decreases below the threshold that can be detected by fluorescence titrations, which is around 5 × 10⁴ M−1 (see ESI, Fig. S19†). Only with substrate 19, where the strong hydrophobic interaction maintains the affinity for the nanoparticles in the measurable interval, we could determine the binding constant for S3-AuNPs, which is 6-fold smaller than that for S1-AuNP.
D plots (see ESI, Fig. S21†) remain linear, indicating that also with these nanoparticles the ion pairing and the hydrophobic interaction are the main, if not the sole, interactions at play. In the case of S4-AuNP, the slope of the plot (0.29) is very close to that obtained with S1-AuNP (0.26), indicating a similar sensitivity to substrate hydrophobicity and suggesting that the affinity decrease might arise from a weaker ion pairing interaction. The electron-donating propensity of the silicon atom may reduce the charge density of the sulfonate. In the case of S2-AuNP the slope is 0.37, indicating a stronger sensitivity to substrate hydrophobicity. Still, affinities measured are always smaller than those of S1-AuNPs. The aromatic residue produces apparently two different effects: on one hand it decreases, via delocalization, the charge density at the sulfonate; on the other hand, it increases the stabilization of the hydrophobic portion of the substrates. The reduction of ion pairing ability is presumably stronger with S3-AuNP due to the presence of the electron-withdrawing carbonyl group in the para position. Indeed, affinity generally decreases below the threshold that can be detected by fluorescence titrations, which is around 5 × 10⁴ M−1 (see ESI, Fig. S19†). Only with substrate 19, where the strong hydrophobic interaction maintains the affinity for the nanoparticles in the measurable interval, we could determine the binding constant for S3-AuNPs, which is 6-fold smaller than that for S1-AuNP.
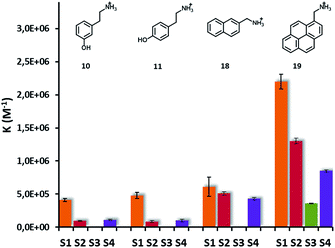 | ||
| Fig. 7 Graphical representation of binding constants of analytes 10, 11, 18, 19 and S1-, S2-, S3- and S4-AuNPs. Values of association constants and binding sites with their uncertainties are reported in Table S1 in the ESI.† | ||
The affinity reduction observed has a small effect on the sensitivity of the NOE pumping experiments (see the ESI†). Indeed, the detection limit remains at around 0.5 mM concentration for all the nanoparticles. On the other hand, the binding selectivity is substantially improved. Signals of phloretic acid (17), which was detected under these conditions with S1-AuNP (Fig. 4), are not present in the NOE pumping spectra with S2-AuNP (see ESI, Fig. S24†). Clearly the affinity decrease brought about by thiol S2 on the likely already small binding constant of 17 prevents an effective interaction with the nanoparticles.
Field testing
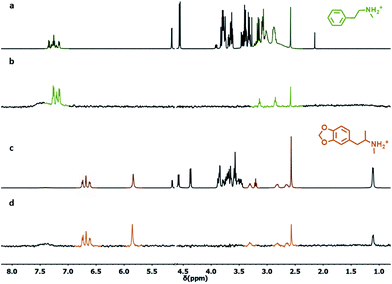
Having established the ability of S1/4-AuNPs to bind and signal phenethylamine derivatives via diffusion and magnetization transfer NMR experiments, we turned our attention to their usability under relevant conditions. In this experiment, S2-AuNP was used since, while featuring a detection limit similar to S1-AuNP, it detects only phenethylamine derivatives.In the first experiment, we simulated the composition of a hypothetical “designer drug” tablet by mixing in the NMR tube N-methyl-phenethylamine (6, 2 mM) as a designer drug model, phenylalanine (14, 2 mM) as a “tentative” masking agent, and an excess (20 mM) of glucose as a possible excipient. The resulting 1H-NMR spectrum in HEPES buffered D2O is very complex, and identification of the target compound is hampered by severe signal crowding (Fig. 8a). Upon addition of S2-AuNP, the NOE pumping-CPMGz sequence reveals the sole signals arising from N-methylphenethylamine (Fig. 7b).
In a second experiment, a seized “street” tablet was analysed.30 Sample preparation was as simple as dissolving a crushed quarter tablet (60 mg) in D2O, adding a small amount of S2-AuNP solution and recording the NOE pumping CPMGz-spectrum. Also in this case, the 1H-NMR spectrum shows a large number of signals arising from the drug and lactose present in the tablet (Fig. 7c). In contrast, the NOE pumping-CPMGz spectrum contains only a set of 9 signals (Fig. 7d) whose analysis readily leads to the identification of the compound as MDMA (5), the active component of ecstasy.
Saturation transfer difference (STD)
The main limitation of NOE-based chemosensing is the low sensitivity, which results in relatively high limits of detection, as discussed earlier. The experimental results in Fig. 7 reveal that this is not a problem in the analysis of seized samples, since the amount of drug present even in a part of a single tablet is more than sufficient to reach the necessary concentration. On the other hand, the analysis of biological samples such as urine, where concentrations of drugs and biogenic amines such as dopamine are in the 10–200 μM range,31 is out of reach.In our first report on nanoparticle-based NMR chemosensing, we demonstrated that sensibly lower limits of detection can be reached by using Saturation Transfer Difference (STD) experiments in place of NOE pumping ones.18d In this experiment, one signal of the receptor is selectively saturated and the saturation is spread to the whole receptor by spin diffusion, to ultimately reach the interacting analytes. The signals of the interacting molecules, as well as the receptor ones, decrease and are revealed by subtraction from a reference equilibrium spectrum. While conceptually similar to an NOE experiment, STD provides stronger signals because, when the monolayer magnetization is saturated, any binding event generates the same enhancement. In contrast, the magnetization transfer in the NOE experiment is efficient for analytes binding to the monolayer soon after the inversion of its magnetization, but it drops significantly for late binding events.
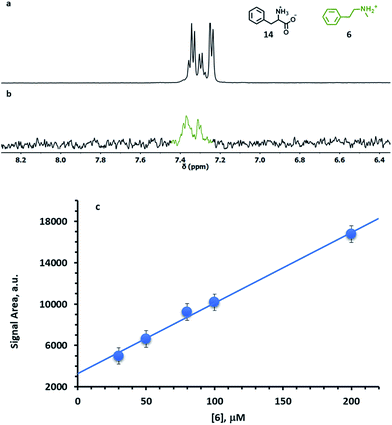
One limitation of STD is that, in order to avoid the generation of artefacts, there must be no overlap between the signals of the unknown analytes and the signal of the receptor to be saturated. In order to overcome such a limitation, S4-AuNP was designed, where the dimethylsilane protons resonate at 0.1 ppm. Indeed, this signal lies at the edge of the spectral window for most organic species, thus allowing a selective saturation of the nanoparticle monolayer. The effectiveness of S4-AuNP in the detection of drug models at low concentration was tested by analysing HEPES buffered D2O solutions (pD 7.0) containing 1 mM phenylalanine (14) and 50 μM N-methylphenethylamine (6). The severe spectral crowding and the low signal intensity prevent the detection of 6 in the sample with a standard 1H experiment. However, a STD spectrum featuring a 2 s saturation time (Fig. 9a) selectively reveals the presence of 6. No interference is observed from the overlapping signal of phenylalanine, even when it is present in 20-fold excess. Concentration dependent STD experiments confirmed that the integrated intensities of the signal from 6 increased linearly with dopamine concentration in the physiologically relevant concentration range 10–200 μM, which allows the quantitative determination of the analyte (Fig. 9b and S26†). The lowest concentration of 6 that could be detected under these conditions is 30 μM.
Conclusions
In this work, we designed monolayer protected nanoparticles capable of broad-class recognition of amphiphilic organic cations in water by exploiting strong ion pairing and hydrophobic interactions. The association of nanoparticle-based receptors with magnetization or saturation transfer NMR experiments allows the straightforward detection and identification of N-phenethylamine derivatives even in complex mixtures, at micromolar concentrations and without any pre-treatment. “Cocktails” of different drugs can be analysed using DOSY experiments. No other chemosensing-based system can reach a similar performance. In principle, by using this protocol it should be possible to propose a tentative chemical structure of a new “designer” drug a few hours after the seizure of a single tablet. The introduction of a dimethylsilane group in proximity to the sulfonate moiety allowed the synthesis of AuNPs tailored for STD-NMR experiments, where the monolayer can be saturated without interference from the sample's signals. This approach successfully decreased the detection limit down to the low micromolar range, thus opening the way to the screening of biological fluids such as urine or blood. It must be underlined that STD is expected to deliver a further relevant sensitivity increase when performed on spectrometers equipped with cryoprobes.Simple thiols such as those used here can be synthesized in a few days and assembled on the nanoparticles in a few hours. Even if the insertion of aromatic residues apparently did not result in the establishment of additional interactions with the analyte, modifications in the hydrophobic layer resulted in a modified selectivity. This suggests that the next issue to address is to improve the design of the nanoreceptor in order to reach more sophisticated molecular recognition. More studies are needed in order to deeply understand the effect of thiol modifications on the monolayer properties and structure and in particular on how coating molecules interact with vicinal ones and with external analytes as well. Yet, a binding site reproducing the structure of natural receptors could provide not only structural but also functional evidence against new illicit drugs.
Conflicts of interest
The authors declare no competing financial interests.Acknowledgements
This work was funded by the ERC Starting Grants Project MOSAIC (grant no. 259014), Progetto Strategico di Ateneo NAMECA (Università degli Studi di Padova) and P-DiSC (grant #09BIRD2017-UNIPD, Dipartimento di Scienze Chimiche, Università degli Studi di Padova).Notes and references
- E. Airuehia, L. Y. Walker and J. Nittler, Journal of Child & Adolescent Substance Abuse, 2015, 24, 186–190 Search PubMed.
- E. Underwood, Science, 2015, 347, 469–473 CrossRef CAS PubMed.
- European Drug Report, Trends and Developments, EMCDDA, Lisbon, 2017 Search PubMed.
- F. Reniero, J. Lobo Vicente, H. Chassaigne, M. Holland, S. Tirendi, K. Kolar, C. Guillou, JCR Science and Policy Report: Report on characterisation of New Psychoactive Substances (NPS), 2014 Search PubMed.
- Ambient ionization high resolution mass spectroscopy techniques are also being investigated to obtain direct information on the chemical structure of new compounds, see: J. Znaleziona, P. Ginterová, J. Petr, P. Ondra, I. Válka, J. Ševčík, J. Chrastina and V. Maier, Anal. Chim. Acta, 2015, 874, 11–25 CrossRef CAS PubMed.
- K. M. Elkins, A. C. Weghorst, A. A. Quinn and S. Acharya, Drug Test. Anal., 2017, 9, 306–310 CrossRef CAS PubMed.
- F. Franz, V. Angerer, H. Jechle, M. Pegoro, H. Ertl, G. Weinfurtner, D. Janele, C. Schlogl, M. Friedl, S. Gerl, R. Mielke, R. Zehnle, M. Wagner, B. Moosmann and V. Auwarter, Clin. Chem. Lab. Med., 2017, 55, 1375–1384 CrossRef CAS PubMed.
- (a) B. Daly, J. Ling and A. P. de Silva, Chem. Soc. Rev., 2015, 44, 4203–4211 RSC; (b) E. V. Anslyn, J. Org. Chem., 2007, 72, 687–699 CrossRef CAS PubMed.
- A. Hulanicki, S. Glab and F. Ingman, Pure Appl. Chem., 1991, 63, 1247–1250 CrossRef.
- (a) A. Porchetta, A. Vallée-Bélisle, K. W. Plaxco and F. Ricci, J. Am. Chem. Soc., 2012, 134, 20601–20604 CrossRef CAS PubMed; (b) D. Moreno, B. D. Grenu, B. Garcia, S. Ibeas and T. Torroba, Chem. Commun., 2012, 48, 2994–2996 RSC.
- (a) E. G. Shcherbakova, B. Zhang, S. Gozem, T. Minami, P. Y. Zavalij, M. Pushina, L. D. Isaacs and P. Anzenbacher, J. Am. Chem. Soc., 2017, 139, 14954–14960 CrossRef CAS PubMed; (b) T. Minami, N. A. Esipenko, A. Akdeniz, B. Zhang, L. Isaacs and P. Anzenbacher, J. Am. Chem. Soc., 2013, 135, 15238–15243 CrossRef CAS PubMed; (c) L. A. Baumes, M. Buaki Sogo, P. Montes-Navajas, A. Corma and H. Garcia, Chem.–Eur. J., 2010, 16, 4489–4495 CrossRef CAS PubMed.
- Y. Jang, M. Jang, H. Kim, S. J. Lee, E. Jin, J. Y. Koo, I.-C. Hwang, Y. Kim, Y. H. Ko, I. Hwang, J. H. Oh and K. Kim, Chem, 2017, 3, 641–651 CAS.
- (a) D. Masseroni, E. Biavardi, D. Genovese, E. Rampazzo, L. Prodi and E. Dalcanale, Chem. Commun., 2015, 51, 12799–12802 RSC; (b) E. Biavardi, S. Federici, C. Tudisco, D. Menozzi, C. Massera, A. Sottini, G. G. Condorelli, P. Bergese and E. Dalcanale, Angew. Chem., Int. Ed., 2014, 53, 9183–9188 CrossRef CAS PubMed.
- L. You, D. J. Zha and E. V. Anslyn, Chem. Rev., 2015, 115, 7840–7892 CrossRef CAS PubMed.
- K. Chen, Q. H. Shu and M. Schmittel, Chem. Soc. Rev., 2015, 44, 136–160 RSC.
- (a) Y. C. Zhao, L. Chen and T. M. Swager, Angew. Chem., Int. Ed., 2016, 55, 917–921 CrossRef CAS PubMed; (b) Y. C. Zhao and T. M. Swager, J. Am. Chem. Soc., 2015, 137, 3221–3224 CrossRef CAS PubMed; (c) Y. C. Zhao, G. Markopoulos and T. M. Swager, J. Am. Chem. Soc., 2014, 136, 10683–10690 CrossRef CAS PubMed; (d) Y. C. Zhao and T. M. Swager, J. Am. Chem. Soc., 2013, 135, 18770–18773 CrossRef CAS PubMed.
- (a) J. Axthelm, S. H. C. Askes, M. Elstner, G. U. Reddy, H. Gorls, P. Bellstedt and A. Schiller, J. Am. Chem. Soc., 2017, 139, 11413–11420 CrossRef CAS PubMed; (b) J. Axthelm, H. Gorls, U. S. Schubert and A. Schiller, J. Am. Chem. Soc., 2015, 137, 15402–15405 CrossRef CAS PubMed.
- (a) M. Diez-Castellnou, M. V. Salvia, S. Springhetti, F. Rastrelli and F. Mancin, Chem.–Eur. J., 2016, 22, 16955–16961 CrossRef PubMed; (b) M. V. Salvia, G. Salassa, F. Rastrelli and F. Mancin, J. Am. Chem. Soc., 2015, 137, 11399–11406 CrossRef CAS PubMed; (c) M. V. Salvia, F. Ramadori, S. Springhetti, M. Diez-Castellnou, B. Perrone, F. Rastrelli and F. Mancin, J. Am. Chem. Soc., 2015, 137, 886–892 CrossRef CAS PubMed; (d) B. Perrone, S. Springhetti, F. Ramadori, F. Rastrelli and F. Mancin, J. Am. Chem. Soc., 2013, 135, 11768–11771 CrossRef CAS PubMed.
- M. V. Salvia, G. Salassa, L. Gabrielli, S. Springhetti, D. Rosa-Gastaldo, L. Trevisan, F. Rastrelli, F. Mancin, Patent application PD 102015000040417, 30/7/2015.
- (a) M. Boccalon, S. Bidoggia, F. Romano, L. Gualandi, P. Franchi, M. Lucarini, P. Pengo and L. Pasquato, J. Mater. Chem. B, 2015, 3, 432–439 RSC; (b) M. Lucarini, P. Franchi, G. F. Pedulli, C. Gentilini, S. Polizzi, P. Pengo, P. Scrimin and L. Pasquato, J. Am. Chem. Soc., 2005, 127, 16384–16385 CrossRef CAS PubMed; (c) M. Lucarini, P. Franchi, G. F. Pedulli, P. Pengo, P. Scrimin and L. Pasquato, J. Am. Chem. Soc., 2004, 126, 9326–9329 CrossRef CAS PubMed.
- G. Guarino, F. Rastrelli and F. Mancin, Chem. Commun., 2012, 48, 1523–1525 RSC.
- L. Riccardi, L. Gabrielli, X. H. Sun, F. De Biasi, F. Rastrelli, F. Mancin and M. De Vivo, Chem, 2017, 3, 92–109 CAS.
- (a) G. Pieters, C. Pezzato and L. J. Prins, Langmuir, 2013, 29, 7180–7185 CrossRef CAS PubMed; (b) R. Bonomi, F. Selvestrel, V. Lombardo, C. Sissi, S. Polizzi, F. Mancin, U. Tonellato and P. Scrimin, J. Am. Chem. Soc., 2008, 130, 15744–15745 CrossRef CAS PubMed.
- A. D. Chen and M. J. Shapiro, J. Am. Chem. Soc., 2000, 122, 414–415 CrossRef CAS.
- F. Rastrelli, S. Jha and F. Mancin, J. Am. Chem. Soc., 2009, 131, 14222–14223 CrossRef CAS PubMed.
- G. Pieters, A. Cazzolaro, R. Bonomi and L. J. Prins, Chem. Commun., 2012, 48, 1916–1918 RSC.
- We use here the term hydrophobic stabilization in a broad sense to include all the possible positive and negative contributions to binding as the release of high energy water molecules, the cost for the formation of cavities and dispersive interactions.
- S. Yapar, M. Oikonomou, A. H. Velders and S. Kubik, Chem. Commun., 2015, 51, 14247–14250 RSC.
- (a) T. Gonzalez-Garcia, T. Margola, A. Silvagni, F. Mancin and F. Rastrelli, Angew. Chem., Int. Ed., 2016, 55, 2733–2737 CrossRef CAS PubMed; (b) G. N. M. Reddy, R. Ballesteros-Garrido, J. Lacour and S. Caldarelli, Angew. Chem., Int. Ed., 2013, 52, 3255–3258 CrossRef PubMed; (c) G. Pages, C. Delaurent and S. Caldarelli, Angew. Chem., Int. Ed., 2006, 45, 5950–5953 CrossRef CAS PubMed.
- The MDMA sample used in this work was an aliquot of a casework file. The MDMA content of the tablet was confirmed by GC/MS. Permission to use small quantities of illicit drugs was granted to F. M. by the Italian Ministero della Salute (permission No. SP/180 of 27.10.2015).
- (a) M. Nieddu, A. Carta, L. Burrai, M. A. Pirisi and G. Boatto, Appl. Magn. Reson., 2014, 45, 135–144 CrossRef CAS; (b) T. T. Abraham, A. J. Barnes, R. H. Lowe, E. A. K. Spargo, G. Milman, S. O. Pirnay, D. A. Gorelick, R. S. Goodwin and M. A. Huestis, J. Anal. Toxicol., 2009, 33, 439–446 CrossRef CAS PubMed.
Footnotes |
| † Electronic supplementary information (ESI) available. See DOI: 10.1039/c8sc01283k |
| ‡ These authors contributed equally. |
| § Present address: CRIOBE EPHE-CNRS-UPVD, 58 Avenue Paul Alduy, 66860 Perpignan CEDEX, France. |
| This journal is © The Royal Society of Chemistry 2018 |

