
 Open Access Article
 This Open Access Article is licensed under a Creative Commons Attribution-Non Commercial 3.0 Unported Licence
Long distance ion–water interactions in aqueous sulfate nanodrops persist to ambient temperatures in the upper atmosphere
Matthew J.
DiTucci
,
Christiane N.
Stachl
and
Evan R.
Williams
 *
*
Department of Chemistry, University of California, Berkeley, B42 Hildebrand Hall, Berkeley, CA 94270, USA. E-mail: erw@berkeley.edu
First published on 4th April 2018
Abstract
The effect of temperature on the patterning of water molecules located remotely from a single SO42− ion in aqueous nanodrops was investigated for nanodrops containing between 30 and 55 water molecules using instrument temperatures between 135 and 360 K. Magic number clusters with 24, 36 and 39 water molecules persist at all temperatures. Infrared photodissociation spectroscopy between 3000 and 3800 cm−1 was used to measure the appearance of water molecules that have a free O–H stretch at the nanodroplet surface and to infer information about the hydrogen bonding network of water in the nanodroplet. These data suggest that the hydrogen bonding network of water in nanodrops with 45 water molecules is highly ordered at 135 K and gradually becomes more amorphous with increasing temperature. An SO42− dianion clearly affects the hydrogen bonding network of water to at least ∼0.71 nm at 135 K and ∼0.60 nm at 340 K, consistent with an entropic drive for reorientation of water molecules at the surface of warmer nanodrops. These distances represent remote interactions into at least a second solvation shell even with elevated instrumental temperatures. The results herein provide new insight into the extent to which ions can structurally perturb water molecules even at temperatures relevant to Earth's atmosphere, where remote interactions may assist in nucleation and propagation of nascent aerosols.
1 Introduction
The chemistry and physics of ion-containing aqueous nanodrops are vital to understanding the behavior of atmospheric aerosols.1,2 Aerosols impact global radiative forcing,3,4 act as cloud condensation nuclei to limit the rate of droplet coalescence and suppress rainfall,5,6 and, in high concentrations, can lead to haze pollution, which negatively impacts human health and agricultural sustainability.7,8 Sources of atmospheric aerosols are both natural and anthropogenic, ranging from oceanic waves and wind erosion to the use of coal and other fossil fuels.9 Stratospheric aerosol modification strategies are being considered to mitigate the increase in global temperatures via seeding ice clouds to increase the reflection of solar radiation and furthermore diminishing the presence of homogeneously formed cirrus clouds, which contribute negatively to climate warming.10–12 Aerosol formation in the lower stratosphere can occur through ion-induced nucleation, in which embryonic nanometer-sized clusters act to expedite the rate of aerosol growth.13,14 An appreciation of the fundamental interactions originating from ions in small aqueous nanodrops is therefore essential for accurately modeling and investigating the chemistry of atmospheric aerosols.A property of fundamental interest concerning ion–water interactions is the length to which a water molecule can “see” an ion, i.e., the distance ions structurally or dynamically perturb the hydrogen-bonding network of water molecules. Although a previous report suggests that ions act only locally to directly coordinated water molecules,15 several opposing results have demonstrated that interactions persist into extended hydration shells.16–28 Small-angle X-ray scattering experiments indicate an increased water molecule density with respect to bulk water surrounding SO42− and PO43− extending to ∼2.9 and ∼3.6 Å, respectively.29 More recently, long-distance perturbations as a result of ion–water interactions were reported using terahertz spectroscopy, which showed that tri- and tetraanionic hexacyanoferrates, Fe(CN)63− and Fe(CN)64−, affect water molecule dynamics beyond the inner coordination shell.28 An intrinsic complication with solution-phase studies of ion–water interactions is the presence of counterions, which can themselves affect the hydrogen bonding network of water molecules, form ion pairs, and otherwise shield the electrostatic interactions with water. Furthermore, the high ionic concentrations typically required for adequate signal lead to close ion–ion proximities with potentially overlapping solvation shells and ion pairing. To overcome these issues, aqueous droplet studies have emerged as a useful means to investigate the physical and chemical properties of ions while excluding influence from cosolutes in order to provide information about effects of an individual ion on the hydrogen bonding network of water molecules in the effective limit of infinite dilution.
Ion-containing aqueous nanodrops of Xz−(H2O)n can be readily formed via nanoelectrospray ionization of aqueous solutions. The structures of nanodrops containing SO42− have been extensively studied between n = 3 and 24.30–33 For instance, photoelectron spectroscopy of SO42−(H2O)n has shown that formation of water–water hydrogen bonds are favored over ion–water bonding after n > 4 due to sufficient shielding of the negative charges.34 Comparison of infrared photodissociation (IRPD) spectroscopy to computational structures for n = 6 has revealed formation of cyclic water rings.33 Similarly, IRPD measurements for the structure of n = 12, which has an enhanced abundance in the mass spectrum with respect to the neighboring hydration sizes, suggest either a completion of the inner coordination shell,31 or a highly symmetrical structure with three water molecules in a second solvation shell.32 In the latter investigation, the lowest-energy structures for the n = 11 and n = 13 clusters are described by either removal or addition of a single water molecule from the structural motif present in the especially stable n = 12 cluster.
Long-distance anion–water interactions in aqueous nanodrops can be measured as a function of size by investigating the structural orientation of surface water molecules, which preferentially orient with their dipoles facing inward as a result of interactions with the solvated anion.24–27 Previous measurements of nanodrops containing SO42− show that the structure of the hydrogen bonding network is perturbed up to ∼0.7 nm.25 Further studies on the multivalent hexacyanoferrates Fe(CN)63− and Fe(CN)64− reveal ion–water interactions persisting to ∼0.8 and ∼1.0 nm, respectively.26,27 These experiments were performed with the instrument cooled to 133 K in order to slow the dissociation of nanodrops due to rapid water molecule evaporation from the trapped clusters. However, relevant atmospheric temperatures are ∼180 K for mesospheric and ∼220 K for stratospheric aerosols. Therefore, a structural investigation of aqueous nanodrops as a function of temperature could provide information regarding their structures and stabilities as well as the extent of ion–water interactions within nanodrops that more closely resemble nascent atmospheric aerosols.
Herein, we investigate the temperature dependence of ion–water interactions in aqueous sulfate nanodrops, SO42−(H2O)n, between n = 30 and 55. Mass spectral measurements reveal specific cluster sizes, n, with enhanced abundances attributed to unique hydrogen-bonding structures that remain with temperatures elevated above ambient conditions. Remarkably, structural ion–water interactions between the solvated SO42− and water molecules residing at the droplet surface persist up to 340 K in n = 30, which suggests that these long range interactions are prevalent at ambient atmospheric conditions. These experiments are the first temperature-dependent studies of extensively hydrated anions and provide new insight into fundamental intermolecular properties that exist at relevant atmospheric temperatures.
2 Experimental methods
2.1 Mass spectra
All experimental data were acquired using a home-built 7.0 T Fourier transform ion cyclotron resonance (FT-ICR) mass spectrometer that has been modified from an instrument described in detail elsewhere to incorporate a 7.0 T magnet.35 Briefly, hydrated ions are formed via nanoelectrospray ionization (nESI) of 5 mM aqueous solutions of copper sulfate (Fischer Chemical, Fair Lawn, NJ) using Milli-Q purified water (Millipore, Billerica, MA). Solutions are loaded into borosilicate capillaries (Sutter Instrument, Novato, CA) with tips pulled to an inner diameter of ∼1 μm. The hydrated ions are formed by applying ∼700 V (relative to the entrance capillary of the mass spectrometer) to a platinum wire that is inserted into the solution. The emitter tip is positioned ∼1 mm from the heated (∼80 °C) metal entrance capillary of the mass spectrometer.Ions are guided via a set of electrostatic lenses through five stages of differential pumping toward the ion cell, which is surrounded by a copper jacket.36 The jacket is temperature-regulated to within ±3 K using a solenoid controlled with home-built regulation software to time pulses of liquid nitrogen for cooling, or with a resistive blanket wrapped around the vacuum chamber containing the cell for heating. The copper jacket is thermalized to the set temperature for at least ∼8 h prior to data acquisition. A pulse of dry nitrogen gas is introduced during ion accumulation to bring the cell region to ∼2 × 10⁻⁶ Torr, which assists in both the trapping and thermalization of ions. After ∼6 s, the cell pressure returns to ∼5 × 10⁻⁹ Torr. Precursor ions are isolated using a stored waveform inverse Fourier transform excitation and can thereafter be activated by IRPD prior to detection to measure photon energy dependent dissociation kinetics for acquiring infrared spectra. A weighted average ensemble method, in which three consecutive cluster sizes are isolated, is implemented to improve the signal-to-noise ratios of these measurements.37 This technique uses the average dissociation kinetics of the precursor ensemble instead of the dissociation rate of a single nanodrop size. To clearly specify an ensemble distribution versus a single nanodrop size, the notation ne is used to represent an n ± 1 ensemble, i.e., ne = 45 ≡ n = 44–46.
2.2 Infrared spectroscopy
IRPD spectra between 3000 and 3800 cm−1 are measured using infrared photons from a tunable OPO/OPA system (LaserVision, Bellevue, WA) pumped by the 1064 nm fundamental of a Nd:YAG laser (Continuum Surelight I-10, Santa Clara, CA) operating at a 10 Hz repetition rate. Ions are irradiated between 0.25 and 1.0 s (between 2 and 10 pulses) to achieve substantial, but not complete, dissociation of the precursor distribution. A first-order dissociation rate constant is determined from the weighted average of products with respect to the initial precursor distribution using the ensemble method.37 IRPD rate constants are corrected for dissociation due to the absorption of blackbody photons originating from the instrument walls by subtracting the blackbody infrared dissociation (BIRD) rate constant, which is measured separately in the absence of infrared radiation. IRPD rate constants are also corrected for frequency dependent variations in laser power.3 Results and discussion
3.1 Magic number clusters
nESI of a 5 mM aqueous copper sulfate solution produces ion-containing aqueous nanodrops over a broad size range (Fig. 1). Cluster distributions can be shifted to larger or smaller values of hydration size, n, by adjusting the entrance capillary temperature and potentials applied to source optics. Increasing the temperature of the copper jacket surrounding the ion cell from 135 K (Fig. 1a) to 360 K (Fig. 1b) results in a shift of the most abundant peaks to a lower value of m/z, but the range of cluster sizes trapped is comparable for both temperatures. Both SO42−(H2O)n and HSO4−(H2O)n are produced by nESI and at 135 K and 360 K, the largest clusters observed are n ≃ 125 for SO42−(H2O)n and n ≃ 35 for HSO4−(H2O)n. The smallest clusters detected are limited by the excitation waveform conditions used in these experiments. Thermodynamic stabilities for small clusters of SO42−(H2O)n and HSO4−(H2O)n have been extensively investigated previously.38–44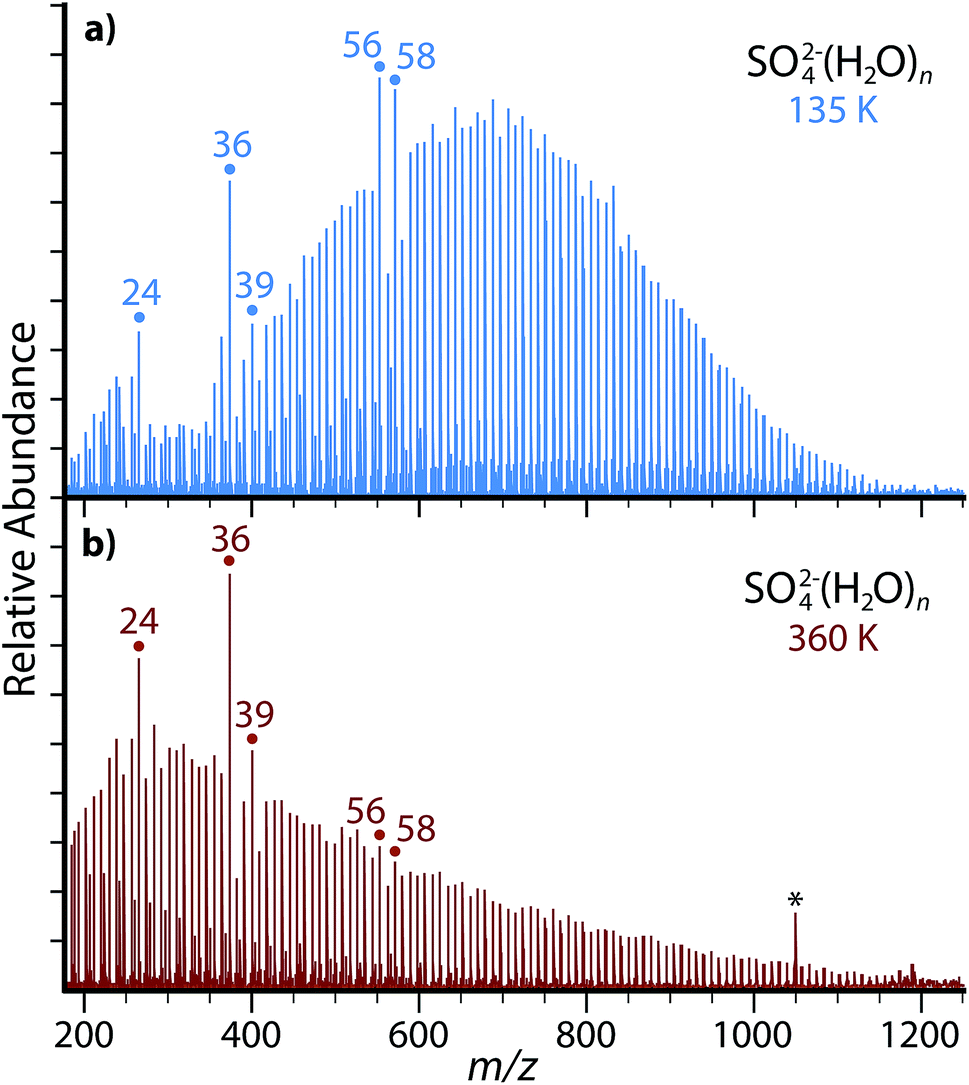 | ||
| Fig. 1 Nanoelectrospray mass spectra acquired from 5 mM aqueous copper sulfate with the copper jacket temperature (a) cooled to 135 K or (b) elevated to 360 K. Magic number clusters of SO42−(H2O)n with n = 24, 36 and 39 are prominent for both temperatures. Frequency noise is labeled with an asterisk (*). | ||
The relative abundances of SO42−(H2O)n with n = 24, 36, 39, 56, 58 at low temperature (Fig. 1a) are anomalously high relative to the neighboring hydration states. At higher temperature (Fig. 1b), the n = 24, 36 and 39 clusters remain more prominent in abundance, but the n = 56 and 58 clusters much less so. Enhanced abundances, commonly referred to as magic number clusters (MNCs), originate from either a higher stability of the nanodroplet at that size or an inherent instability of the neighboring n + 1 cluster. MNCs have been previously observed with a diverse range of hydrated species, including the hydrated electron,45,46 hydrated proton,47,48 monatomic ions,49,50 small organic ions,51–54 transition metal complexes26,27 and peptides.55–57 Previous photodissociation experiments and theory have revealed the presence of pentagonal dodecahedral clathrate structures leading to enhanced stability in n = 20 hydrates of H3O+, NH4+, Cs+, Rb+, and K+.47,48,50–52 Similar cage-like structural motifs may be responsible for the enhanced abundance of the observed SO42−(H2O)n MNC nanodrops. There are also alternating MNCs between n = 49 and 58 for (H2O)n−,45,46 H+(H2O)n,58 protonated amines,53,57 and halides,49 which alternatively suggests that SO42−(H2O)n clusters at n = 56 and 58 may originate from the inclusion of SO42− into similar structural motifs without significantly disrupting the enhanced structure of the hydrogen bonding network. The continued presence of MNCs with n = 24, 36 and 39 at high temperature in these experiments suggests that these stable configurations may be relevant to nascent aerosols at ambient atmospheric temperatures.
3.2 Temperature dependence of bonded O–H stretches
To investigate the hydrogen bonding network and water molecule orientations as a function of temperature, IRPD spectra were acquired for SO42−(H2O)n with ne = 45 and with the copper jacket at a fixed temperature between 135 and 215 K (Fig. 2). The broad feature spanning ∼3000–3650 cm−1 is characteristic of absorptions from hydrogen-bonded O–H stretches. This region can be further subdivided based on the local colligative physical state of water molecules, which depends on both the number of hydrogen bonds involved and the O–H–O angles for hydrogen bonding.59 In the bulk phase, water molecules that accept and donate two hydrogen bonds (AADD: acceptor–acceptor–donor–donor) in a near-optimal, i.e. O–H||O–O, four-coordinate tetrahedral conformation, absorb low energy photons near ∼3300 cm−1 and can be referred to as highly-ordered oscillators.60,61 Amorphous hydrogen bonding oscillators, in which either four-coordinate water molecules adopt less-optimal distorted tetrahedral structures, or the water molecules are three-coordinate (ADD: acceptor–donor–donor), are blue-shifted and absorb photons near ∼3450 cm−1. The relative ratios of these two regions have been explored as a function of droplet size for both neutral water and ion-containing nanodrops up to n = 550 in order to explore the onset of crystallinity.23,62 Although small nanodrops with n = 30–55 do not have a discrete phase, these absorptive regions observed in bulk water can be used to describe changes in the composite structure of the hydrogen bonding network as a function of hydration.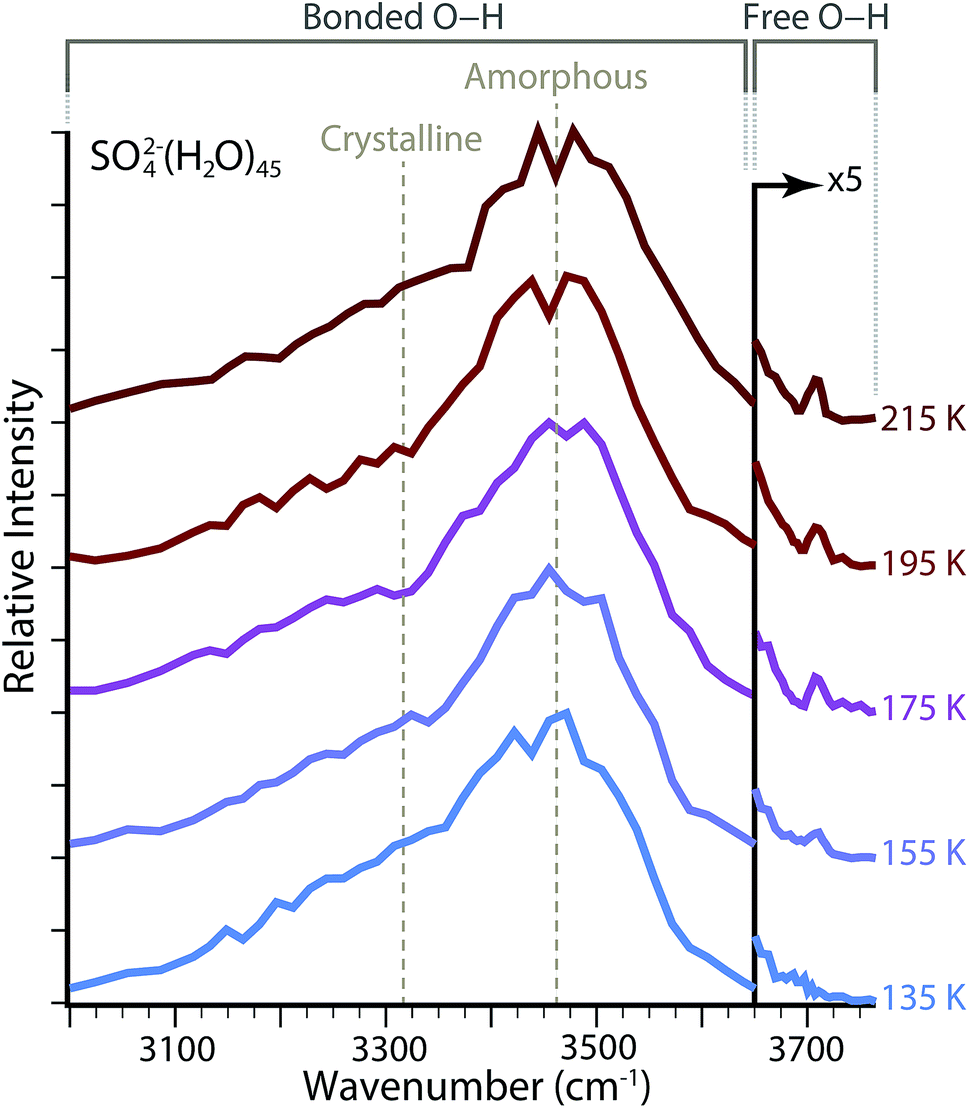 | ||
| Fig. 2 Full O–H stretching region for IRPD of SO42−(H2O)n with ne = 45 and copper jacket temperatures thermalized between 135 and 215 K. | ||
Temperature dependence of the amorphous to highly-ordered hydrogen bonding ratio for SO42−(H2O)n with ne = 45 was determined by fitting the bonded O–H region with two Gaussian lineshapes for absorptions centered at ∼3470 cm−1 and ∼3320 cm−1, respectively. Fitting parameters for these lineshapes are provided in Table 1. There is no systematic change in the width of these two absorptive regions over the temperature range investigated. There is a minor blue shift by Δv = 7 cm−1 from 3470 cm−1 to 3477 cm−1 for the center frequency of amorphous hydrogen bonding across the temperatures measured, whereas the center of the highly-ordered water absorption center blue shifts from 3323 cm−1 to 3325 cm−1, a difference of only Δv = 2 cm−1. The largest systematic change is the ratio of relative abundances for these two peaks. Using the integrated areas of the Gaussian lineshapes, the hydrogen bonding network composition for ne = 45 is ∼40% amorphous at 135 K and becomes less ordered as the copper jacket temperature is elevated, which results in an increase of the amorphous contribution to ∼46% at 215 K. Because the intensity of absorptive bands can depend nonlinearly on single photon absorption cross sections using IRPD,63 these integrated bands may provide a more qualitative than quantitative measure of structural change with increasing temperature. However, the increase in the ratio for amorphous to highly-ordered bands indicates that the nanodrop structures have less-optimal O–H–O hydrogen-bonding angles and a decrease in water molecule coordination.
![[thin space (1/6-em)]](https://www.rsc.org/images/entities/char_2009.gif) exp[−((x − b)/c)2]. The ±% for 2σ standard error for least squares fitting is provided as a relative percentage in parentheses following the parameter, (%)
exp[−((x − b)/c)2]. The ±% for 2σ standard error for least squares fitting is provided as a relative percentage in parentheses following the parameter, (%)
| a am | b am | c am | a ho | b ho | c ho | % am | |
|---|---|---|---|---|---|---|---|
| 135 K | 0.0787 (10) | 3470 (0.1) | 96.23 (7.5) | 0.0570 (8.0) | 3323 (0.5) | 199.6 (6.3) | 40.0 |
| 155 K | 0.0987 (6.3) | 3472 (0.1) | 89.73 (5.6) | 0.0571 (6.6) | 3327 (0.4) | 206.1 (5.1) | 42.6 |
| 175 K | 0.0823 (2.9) | 3476 (0.1) | 92.15 (3.5) | 0.0467 (4.1) | 3324 (0.4) | 220.1 (4.6) | 42.5 |
| 195 K | 0.0977 (9.3) | 3468 (0.1) | 97.13 (7.3) | 0.0425 (13) | 3325 (0.8) | 204.9 (9.2) | 47.9 |
| 215 K | 0.0794 (10) | 3477 (0.1) | 99.50 (8.2) | 0.0436 (11) | 3325 (0.8) | 210.7 (8.2) | 46.2 |
3.3 Temperature dependence of long-distance interactions
Information about the extent of ion–water interactions between the solvated SO42− and surface water molecules as a function of temperature can be determined from IRPD spectra of SO42−(H2O)n. Dangling or “free” O–H stretches at the surface of the water droplet that do not participate in hydrogen bonding (A: acceptor, AD: acceptor–donor, or AAD: acceptor–acceptor–donor) occur between ∼3650 and 3800 cm−1. Water molecules in the first coordination shell orient with their hydrogen atoms facing inward toward SO42−.32,33 This is due to both the Coulombic interaction between the anion and the partial positive charge of the hydrogen atoms and to hydrogen-bonding between water and the anion. These interior water molecules donate both hydrogen atoms for hydrogen bonding to either the anion or to other water molecules (DD, ADD, or AADD). With increasing n and the formation of subsequent solvation shells, the distance between the anion and surface water molecules lengthens and the magnitude of interactions resulting in patterning the orientation of water molecules at the surface diminishes. This decreasing impetus for water molecules to orient inward is eventually overcome by both the entropic drive to incorporate free O–H water molecules and the enthalpic drive to optimize hydrogen bonding at the surface as occurs in neutral and cationic clusters as well as the bulk air–water interface. Therefore, the onset of spectroscopic features at ∼3700 cm−1 measured as a function of n provides an effective distance to which the anion can strongly orient water molecules at the droplet surface.In the IRPD spectra of SO42−(H2O)n with ne = 45 and T = 135 K (Fig. 2), all of the spectral intensity between 3650 and 3800 cm−1 is attributable to the shoulder of the hydrogen-bonding feature centered at 3470 cm−1, consistent with previous size-dependent experiments of SO42− at low temperature.25 A distinct band at ∼3707 cm−1 emerges at 155 K and gradually increases in intensity with temperature, indicating that there are an increasing number of free O–H oscillators at the surface. Therefore, although the surface of ne = 45 is composed entirely of inward doubly donating water molecules at 135 K, these nanodrops begin to incorporate free O–H water molecules at 155 K, where the free O–H reorientation becomes competitive with long distance ion–water interactions between SO42− and the surface. It is important to note that the onset of the free O–H is not equivalent to a complete loss of interaction between the anion and surface, but rather the onset for the loss of strong structural orientation at the surface.
The appearance of free O–H oscillators in SO42−(H2O)n clusters with ne between 35 and 55 and copper jacket temperatures between 135 and 175 K was measured (Fig. 3). The free O–H ADD stretch at ∼3707 cm−1 that is not observed for ne = 45 at 135 K appears at ne = 50, and the intensity of this peak is higher for ne = 55. The ion–water distance between the solvated anion and surface water molecules, which can be calculated from the density of water with the assumption that clusters are spherical,† is approximately 0.71 nm for ne = 50. Therefore, the strong structural influences from SO42− extend to ∼0.71 nm when the copper jacket is at 135 K. When the copper jacket temperature is increased to 155 K, the onset of the free O–H occurs with ne = 45 (∼0.69 nm) and therefore, the increased temperature has slightly diminished the distal extent to which SO42− can strongly orient water molecules. Similarly, the free O–H band emerges at ne = 40 (∼0.66 nm) with the copper jacket at 175 K. This corresponds to a decrease of the orientation extent by ∼0.03 nm for each 20 K increase for this size range.
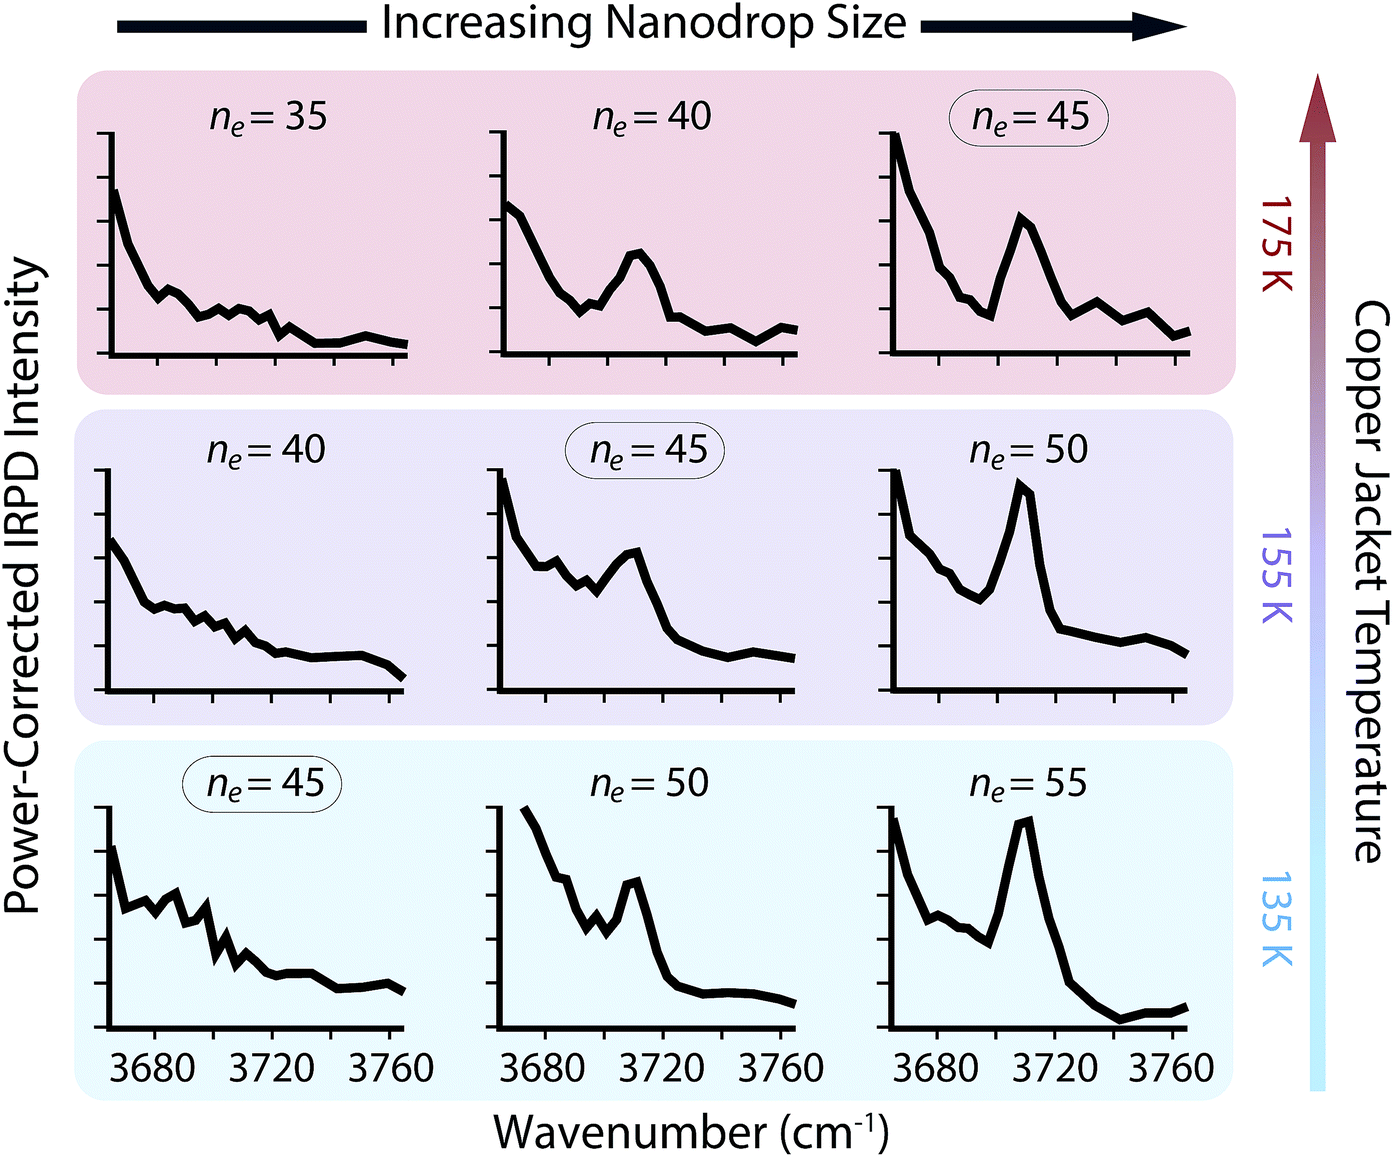 | ||
| Fig. 3 Dependence of the nanodrop free O–H band appearance with respect to copper jacket temperature as a function of cluster size between ne = 30 and 55. Within a given cluster size (see ne = 45 above), increasing the temperature results in a greater abundance of the free O–H band, whereas within a static temperature, increased cluster size results in larger free O–H absorbance. The appearance of this peak is due to decreased Coulombic interactions and reorientation of hydrogen-bonding interactions to accommodate water molecules with a free O–H stretch. | ||
There is no free O–H peak in the IRPD spectrum of ne = 35 until the copper jacket is at 295 K (Fig. 4b). Although the free O–H emergence for clusters between ne = 40 and 50 occurs within a small temperature range (ΔT ≃ 40 K), the strong ion–water interactions in the ne = 35 cluster structure the surface until 295 K, or ΔT ≃ 120 K with respect to the free O–H emergence in ne = 40. There are MNCs in the precursor distribution of both ne = 35 and 40 at n = 36 and 39, respectively. Therefore, the large temperature offset is not attributable to an anomalous stability in just one of these precursors. Instead, the increased temperature required for surface reorientation is due to the smaller ion–surface distance that requires higher internal energies to overcome the strong Coulombic and hydrogen-bonding interactions. Remarkably, there is no free O–H band for ne = 30 until the ion cell is heated to 340 K (Fig. 4c). The approximate droplet radii for ne = 30 and 35 are ∼0.60 nm and ∼0.63 nm, respectively. The inner coordination shell for SO42− consists of n ≃ 14 water molecules.30 Thus, the ion–water interactions reported here are each representative of long-range interactions into at least a second solvation shell.
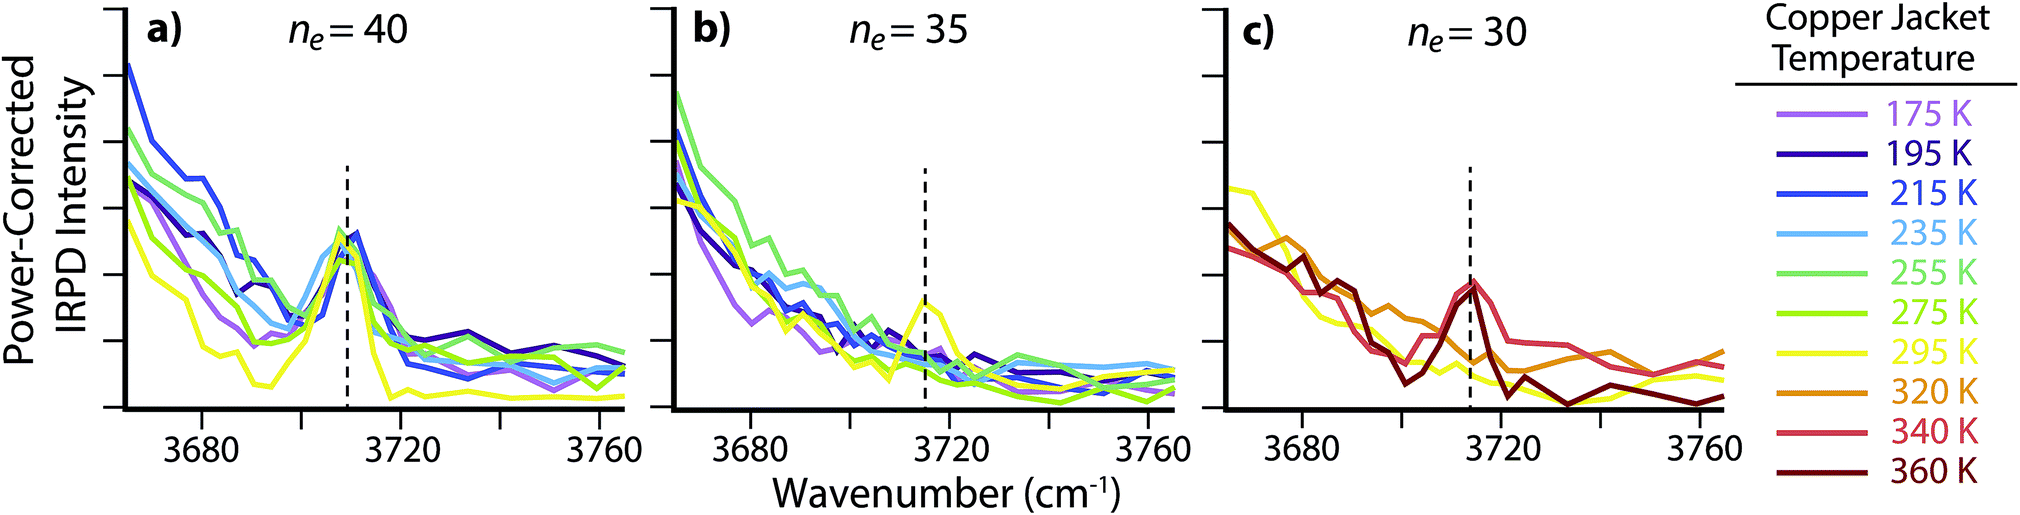 | ||
| Fig. 4 IRPD spectra of the free O–H region for SO42−(H2O)n with (a) ne = 40, (b) ne = 35 and (c) ne = 30 with copper jacket temperatures between 175 and 360 K. | ||
There are no MNCs in the ne = 30 ensemble distribution and as a result, the long-distance structural interactions at elevated temperatures observed here are not a consequence of atypical stabilities. Instead, the structural interactions present in these nanodrops are analogous to ion–water interactions in aqueous solutions at ∼0.60 nm, or roughly a second solvation shell from the anion. These results provide evidence for remote structuring of water molecules beyond the inner coordination shell by dianionic species at ambient temperatures. This is consistent with a recent terahertz investigation of tri- and tetraanionic hexacyanoferrates in ambient temperature aqueous solutions that were found to dynamically perturb a minimum of ∼19 and ∼25 water molecules, respectively.28 Under the low-pressure conditions used in these experiments, water molecules can rapidly evaporate and lead to significant cooling of the nanodrops.64 As a result, the actual “effective” temperatures of these nanodrops are expected to be cooler than the temperatures reported here for the copper jacket. The calculation of quantitative values for these effective temperatures requires extensive modeling to account for energy transfer via water evaporation or the absorption and emission of blackbody photons.36,65–70 Although a detailed investigation into the effective temperatures of nanodrops is underway, preliminary results suggest that SO42−(H2O)n clusters with ne = 30 trapped in an ion cell at 340 K have an effective temperature of ∼180 ± 6 K (ΔT ≃ 160 K). Under these experimental conditions, more than 99% of the ions have an internal energy above the threshold dissociation energy for water molecule loss. The steady state distribution of ion internal energies is much narrower than that of a Boltzmann distribution at 180 K, but the maximum values in the two distributions are centered at the same energy. This effective droplet temperature is comparable to temperatures in the upper atmosphere, where the unique stability of MNCs and strong ion–water interactions beyond the inner coordination shell may aid in nucleation and propagation of nascent atmospheric aerosols.
4 Conclusions
IRPD spectroscopy in the hydrogen bonding region between 3000 and 3800 cm−1 was used to investigate the temperature dependence of ion–water interactions in aqueous SO42−(H2O)n with instrumental temperatures between 135 and 360 K. In this spectral region, absorption of photons at ∼3700 cm−1 is indicative of “free” O–H water molecules at the surface of the droplet that orient one O–H group outward and away from the droplet interior. The appearance of this free O–H band was measured as a function of both temperature and cluster size to determine the onset of diminished structural ion–water interactions at remote distances from the dianion. For a given cluster size, an increase in temperature results in a greater population of free O–H water molecules at the surface as a result of the entropic and enthalpic drives for surface reorientation that are able to overcome the strong Coulombic and hydrogen-bonding interactions with increased internal energies. At smaller cluster size, higher temperatures are required to reorient water molecules as a result of decreased ion–surface distances, where greater Coulombic interactions exist between the solvated ion and surface water molecules. These results are consistent with an increase in the less optimal hydrogen bonding observed in the bonded O–H region of the spectra with increasing nanodrop size. Water molecules beyond the first solvation shell must reorient in order for their dipoles to point outward and away from the solvated anion to accommodate water molecules with a free O–H stretch at the nanodrop surface. In contrast to solution-phase experiments, which generally require high concentrations and consequentially limit the amount of unperturbed bulk water due to counterions, the long distance interactions observed here using anion-containing aqueous nanodrops provide the first unambiguous evidence for remote ion–water interactions by a singular anion at temperatures relevant to Earth's atmosphere. These findings provide new insight into fundamental ion–water interactions that may contribute to favorable nucleation and propagation of nascent aerosols in the upper atmosphere. These same techniques can be used to investigate the temperature dependence of larger anion-containing nanodrops as well as the hydration of clustered anionic cores.Conflicts of interest
There are no conflicts to declare.Acknowledgements
This material is based upon work supported by the National Science Foundation under CHE-1609866 and the Graduate Research Fellowship Program under Grant No. DGE 1752814, as well as the American Chemical Society Division of Analytical Chemistry and Society for Analytical Chemists of Pittsburgh (MJD). The authors would like to acknowledge financial support from the Ford Foundation (CNS), through its pre-doctoral fellowship program, and the National Academies of Sciences, Engineering, and Medicine, the administrative agency for the Ford fellowship program. The authors are grateful for financial support from CalSolv.References
- V. F. McNeill, Annu. Rev. Chem. Biomol. Eng., 2017, 8, 427–444 CrossRef CAS PubMed.
- Atmospheric Aerosols: Characterization, Chemistry, Modeling, and Climate, ed. K. T. Valsaraj and R. R. Kommalapati, American Chemical Society, 2009, vol. 1005 Search PubMed.
- R. J. Charlson, S. E. Schwartz, J. M. Hales, R. D. Cess, J. A. Coakley, J. E. Hansen and D. J. Hofmann, Science, 1992, 255, 423–430 CAS.
- P. Stier, J. H. Seinfeld, S. Kinne and O. Boucher, Atmos. Chem. Phys., 2007, 7, 5237–5261 CAS.
- Q. Zhang, J. Quan, X. Tie, M. Huang and X. Ma, Atmos. Environ., 2011, 45, 665–672 CrossRef CAS.
- M. O. Andreae, D. Rosenfeld, P. Artaxo, A. A. Costa, G. P. Frank, K. M. Longo and M. A. F. Silva-Dias, Science, 2004, 303, 1337–1342 CrossRef CAS PubMed.
- X. Han, Q. Guo, C. Liu, P. Fu, H. Strauss, J. Yang, J. Hu, L. Wei, H. Ren, M. Peters, R. Wei and L. Tian, Sci. Rep., 2016, 6, 29958 CrossRef CAS PubMed.
- X. Tie, R. J. Huang, W. Dai, J. Cao, X. Long, X. Su, S. Zhao, Q. Wang and G. Li, Sci. Rep., 2016, 6, 29612 CrossRef CAS PubMed.
- M. O. Andreae and P. J. Crutzen, Science, 1997, 276, 1052–1058 CrossRef CAS.
- P. J. Crutzen, Clim. Change, 2006, 77, 211–219 CrossRef CAS.
- U. Niemeier and S. Tilmes, Science, 2017, 357, 246–248 CrossRef CAS PubMed.
- U. Lohmann and B. Gasparini, Science, 2017, 357, 248–249 CrossRef CAS PubMed.
- R. Zhang, A. Khalizov, L. Wang, M. Hu and W. Xu, Chem. Rev., 2012, 112, 1957–2011 CrossRef CAS PubMed.
- S.-H. Lee, J. M. Reeves, J. C. Wilson, D. E. Hunton, A. A. Viggiano, T. M. Miller, J. O. Ballenthin and L. R. Lait, Science, 2003, 301, 1886–1889 CrossRef CAS PubMed.
- A. W. Omta, M. F. Kropman, S. Woutersen and H. J. Bakker, Science, 2003, 301, 347–349 CrossRef CAS PubMed.
- R. Mancinelli, A. Botti, F. Bruni, M. A. Ricci and A. K. Soper, Phys. Chem. Chem. Phys., 2007, 9, 2959–2967 RSC.
- M. A. Vovk, M. S. Pavlova, V. I. Chizhik and A. A. Vorontsova, Russ. J. Phys. Chem. A, 2011, 85, 1597–1602 CrossRef CAS.
- W. W. Rudolph and G. Irmer, Appl. Spectrosc., 2007, 61, 1312–1327 CrossRef CAS PubMed.
- J. Stangret and T. Gampe, J. Phys. Chem. A, 2002, 106, 5393–5402 CrossRef CAS.
- R. Buchner, Pure Appl. Chem., 2008, 80, 1239–1252 CrossRef CAS.
- A. Eiberweiser, A. Nazet, G. Hefter and R. Buchner, J. Phys. Chem. B, 2015, 119, 5270–5281 CrossRef CAS PubMed.
- F. Böhm, V. Sharma, G. Schwaab and M. Havenith, Phys. Chem. Chem. Phys., 2015, 17, 19582–19591 RSC.
- R. J. Cooper, M. J. DiTucci, T. M. Chang and E. R. Williams, J. Am. Chem. Soc., 2016, 138, 96–99 CrossRef CAS PubMed.
- J. T. O'Brien and E. R. Williams, J. Am. Chem. Soc., 2012, 134, 10228–10236 CrossRef PubMed.
- J. T. O'Brien, J. S. Prell, M. F. Bush and E. R. Williams, J. Am. Chem. Soc., 2010, 132, 8248–8249 CrossRef PubMed.
- M. J. DiTucci, S. Heiles and E. R. Williams, J. Am. Chem. Soc., 2015, 137, 1650–1657 CrossRef CAS PubMed.
- M. J. DiTucci and E. R. Williams, Chem. Sci., 2017, 8, 1391–1399 RSC.
- M. J. DiTucci, F. Böhm, G. Schwaab, E. R. Williams and M. Havenith, Phys. Chem. Chem. Phys., 2017, 19, 7297–7306 RSC.
- C. Chen, C. Huang, I. Waluyo, T. Weiss, L. Pettersson and A. Nilsson, Phys. Chem. Chem. Phys., 2015, 17, 8427–8430 RSC.
- F. Thaunay, C. Clavaguéra and G. Ohanessian, Phys. Chem. Chem. Phys., 2015, 17, 25935–25945 RSC.
- J. Zhou, G. Ssantambrogio, M. Brümmer, D. T. Moore, L. Wöste, G. Meijer, D. M. Neumark and K. R. Asmis, J. Chem. Phys., 2006, 125, 111102 CrossRef PubMed.
- F. Thaunay, A. A. Hassan, R. J. Cooper, E. R. Williams, C. Clavaguéra and G. Ohanessian, Int. J. Mass Spectrom., 2017, 418, 15–23 CrossRef CAS.
- M. F. Bush, R. J. Saykally and E. R. Williams, J. Am. Chem. Soc., 2007, 129, 2220–2221 CrossRef CAS PubMed.
- X. B. Wang, J. B. Nicholas and L. S. Wang, J. Chem. Phys., 2000, 113, 10837–10840 CrossRef CAS.
- M. F. Bush, J. T. O'Brien, J. S. Prell, R. J. Saykally and E. R. Williams, J. Am. Chem. Soc., 2007, 129, 1612–1622 CrossRef CAS PubMed.
- R. L. Wong, K. Paech and E. R. Williams, Int. J. Mass Spectrom., 2004, 232, 59–66 CrossRef CAS.
- J. S. Prell, J. T. O'Brien and E. R. Williams, J. Am. Soc. Mass Spectrom., 2010, 21, 800–809 CrossRef CAS PubMed.
- N. Mardirossian, D. S. Lambrecht, L. McCaslin, S. S. Xantheas and M. Head-Gordon, J. Chem. Theory Comput., 2013, 9, 1368–1380 CrossRef CAS PubMed.
- D. S. Lambrecht, L. McCaslin, S. S. Xantheas, E. Epifanovsky and M. Head-Gordon, Mol. Phys., 2012, 19, 2513–2521 CrossRef.
- L. C. Smeeton, J. D. Farrell, M. T. Oakley, D. J. Wales and R. L. Johnston, J. Chem. Theory Comput., 2015, 11, 2377–2384 CrossRef CAS PubMed.
- R. L. Wong and E. R. Williams, J. Phys. Chem. A, 2003, 107, 10976–10983 CrossRef CAS.
- A. Whitehead, R. Barrios and J. Simons, J. Chem. Phys., 2002, 116, 2848–2851 CrossRef CAS.
- Y. Xin, X. B. Wang and L. S. Wang, J. Phys. Chem. A, 2002, 106, 7607–7616 CrossRef.
- B. Gao and Z. Liu, J. Chem. Phys., 2005, 123, 224302 CrossRef PubMed.
- L. Ma, K. Majer, F. Chirot and B. v. Issendorff, J. Chem. Phys., 2009, 131, 144303 CrossRef PubMed.
- M. Knapp, O. Echt, D. Kreisle and E. Recknagel, J. Phys. Chem., 1987, 91, 2601–2607 CrossRef CAS.
- M. Miyazaki, A. Fujii, T. Ebata and N. Mikami, Science, 2004, 304, 1134–1137 CrossRef CAS PubMed.
- J. A. Fournier, C. T. Wolke, C. J. Johnson, M. A. Johnson, N. Heine, S. Gewinner, W. Schöllkopf, T. K. Esser, M. R. Fagiani, H. Knorke and K. R. Asmis, Proc. Natl. Acad. Sci. U. S. A., 2014, 111, 18132–18137 CrossRef CAS PubMed.
- S. Chakrabarty and E. R. Williams, Phys. Chem. Chem. Phys., 2016, 18, 25483–25490 RSC.
- R. J. Cooper, T. M. Chang and E. R. Williams, J. Phys. Chem. A, 2013, 117, 6571–6579 CrossRef CAS PubMed.
- E. G. Diken, N. I. Hammer, M. A. Johnson, R. A. Christie and K. D. Jordan, J. Chem. Phys., 2005, 123, 164309 CrossRef PubMed.
- T. M. Chang, R. J. Cooper and E. R. Williams, J. Am. Chem. Soc., 2013, 135, 14821–14830 CrossRef CAS PubMed.
- S.-W. Lee, H. Cox, W. A. Goddard and J. L. Beauchamp, J. Am. Chem. Soc., 2000, 122, 9201–9205 CrossRef CAS.
- K. Sekimoto and M. Takayama, J. Mass Spectrom., 2011, 46, 50–60 CrossRef CAS PubMed.
- S. E. Rodrigez-Cruz, J. S. Klassen and E. R. Williams, J. Am. Soc. Mass Spectrom., 1999, 10, 958–968 CrossRef.
- S. E. Rodriguez-Cruz, J. S. Klassen and E. R. Williams, J. Am. Soc. Mass Spectrom., 1997, 8, 565–568 CrossRef CAS.
- S.-W. Lee, P. Freivogel, T. Schindler and J. L. Beauchamp, J. Am. Chem. Soc., 1998, 120, 11758–11765 CrossRef CAS.
- T. Schindler, C. Berg, G. Niedner-Schatteburg and V. E. Bondybey, Chem. Phys. Lett., 1996, 250, 301–308 CrossRef CAS.
- V. Buch and J. P. Devlin, J. Chem. Phys., 1999, 110, 3437–3443 CrossRef CAS.
- J. B. Brubach, A. Mermet, A. Filabozzi, A. Gerschel and P. Roy, J. Chem. Phys., 2005, 122, 184509 CrossRef PubMed.
- G. D'Arrigo, G. Maisano, F. Mallamace, P. Migliardo and F. Wanderlingh, J. Chem. Phys., 1981, 75, 4264 CrossRef.
- C. C. Pradzynski, R. M. Forck, T. Zeuch, P. Slaviček and U. Buck, Science, 2012, 337, 1529–1532 CrossRef CAS PubMed.
- J. S. Prell, T. C. Correra, T. M. Chang, J. A. Biles and E. R. Williams, J. Am. Chem. Soc., 2010, 132, 14733–14735 CrossRef CAS PubMed.
- R. C. Dunbar, Mass Spectrom. Rev., 2004, 23, 127–158 CrossRef CAS PubMed.
- W. D. Price, P. D. Schnier and E. R. Williams, J. Phys. Chem. B, 1997, 101, 664–673 CrossRef CAS PubMed.
- R. A. Jockush and E. R. Williams, J. Phys. Chem. A, 1998, 102, 4543–4550 CrossRef PubMed.
- E. F. Strittmatter, P. D. Schnier, J. S. Klassen and E. R. Williams, J. Am. Soc. Mass Spectrom., 1999, 10, 1095–1104 CrossRef CAS PubMed.
- W. D. Price and E. R. Williams, J. Phys. Chem. A, 1997, 101, 8844–8852 CrossRef CAS PubMed.
- P. D. Schnier, W. D. Price, E. F. Strittmatter and E. R. Williams, J. Am. Soc. Mass Spectrom., 1997, 8, 771–780 CrossRef CAS PubMed.
- R. C. Dunbar, T. B. McMahon, D. Thölmann, D. S. Tonner, D. R. Salahub and D. Wei, J. Am. Chem. Soc., 1995, 117, 12819–12825 CrossRef CAS.
Footnote |
| † This approximation uses the density of water at room temperature and does not consider any specific ion or structural effects. However, these approximations provide distances similar to those calculated using molecular mechanics simulations for specific hydrated ions.27 |
| This journal is © The Royal Society of Chemistry 2018 |