 Open Access Article
A bright FIT-PNA hybridization probe for the hybridization state specific analysis of a C → U RNA edit via FRET in a binary system†
Ge-min
Fang
ab,
Jasmine
Chamiolo
a,
Svenja
Kankowski
c,
Felix
Hövelmann
a,
Dhana
Friedrich
de,
Alexander
Löwer
 de,
Jochen C.
Meier
 c and
Oliver
Seitz
 *a
*a
aDepartment of Chemistry, Humboldt-Universität zu Berlin, Brook-Taylor-Strasse 2, D-12489 Berlin, Germany. E-mail: oliver.seitz@chemie.hu-berlin.de
bInstitute of Physical Science and Information Technology, Anhui University, Hefei, Anhui 230601, China
cZoological Institute, Technical University Braunschweig, Spielmannstr. 7, D-38106 Braunschweig, Germany
dMax Delbrück Centrum für Molekulare Medizin, Robert Rössle Straße 10, 13125 Berlin, Germany
eTechnische Universität Darmstadt, Department of Biology, Schnittspahnstraße 13, 64287 Darmstadt, Germany
First published on 2nd May 2018
Abstract
Oligonucleotide probes that show enhanced fluorescence upon nucleic acid hybridization enable the detection and visualization of specific mRNA molecules, in vitro and in cellulo. A challenging problem is the analysis of single nucleotide alterations that occur, for example, when cellular mRNA is subject to C → U editing. Given the length required for uniqueness of the targeted segment, the commonly used probes do not provide the level of sequence specificity needed to discriminate single base mismatched hybridization. Herein we introduce a binary probe system based on fluorescence resonance energy transfer (FRET) that distinguishes three possible states i.e. (i) absence of target, (ii) presence of edited (matched) and (iii) unedited (single base mismatched) target. To address the shortcomings of read-out via FRET, we designed donor probes that avoid bleed through into the acceptor channel and nevertheless provide a high intensity of FRET signaling. We show the combined use of thiazole orange (TO) and an oxazolopyridine analogue (JO), linked as base surrogates in modified PNA FIT-probes that serve as FRET donor for a second, near-infrared (NIR)-labeled strand. In absence of target, donor emission is low and FRET cannot occur in lieu of the lacking co-alignment of probes. Hybridization of the TO/JO-PNA FIT-probe with the (unedited RNA) target leads to high brightness of emission at 540 nm. Co-alignment of the NIR-acceptor strand ensues from recognition of edited RNA inducing emission at 690 nm. We show imaging of mRNA in fixed and live cells and discuss the homogeneous detection and intracellular imaging of a single nucleotide mRNA edit used by nature to post-transcriptionally modify the function of the Glycine Receptor (GlyR).
Introduction
Fluorogenic oligonucleotide probes are invaluable molecular tools for detecting and localizing RNA molecules inside live cells.1–3 These probes bind a complementary nucleic acid strand via Watson–Crick-type recognition, which elicits a fluorescence response that distinguishes target-bound from unbound molecules.4–11 A key challenge in RNA imaging is the detection of single base alterations12–14 such as C → U or A → I RNA editing; a mechanism used by cells for the posttranscriptional regulation of gene expression.15 For applications in cells, oligonucleotide probes must exceed a certain length (typically 18 nt) in order to assure the uniqueness of the recognized target segment. However, at this length the commonly used oligonucleotide probes will bind the RNA target regardless of a single base mismatch.In theory, binary probe formats should provide for high target specificity, because the fluorescence signal depends on the simultaneous binding of two oligonucleotide probes.16 A commonly used approach involves two fluorescence labeled probes, which interact via fluorescence energy transfer (FRET) when adjacent hybridization brings the donor and acceptor dye in proximity.7,17 In practice, the achievable signal-to-background ratios are limited. The efficiency of the FRET process is high when donor emission overlaps with acceptor absorption. Given that typical Stokes shifts are smaller than 50 nm, a bright “FRET signal” (acceptor emission upon donor excitation) requires a rather narrow spectral gap between the two dyes. However, the commonly applied organic dyes have rather broad emission bands and in many instances, the donor signal will bleed through and become apparent in the acceptor channel despite the absence of target. This reduces signal-to-background.
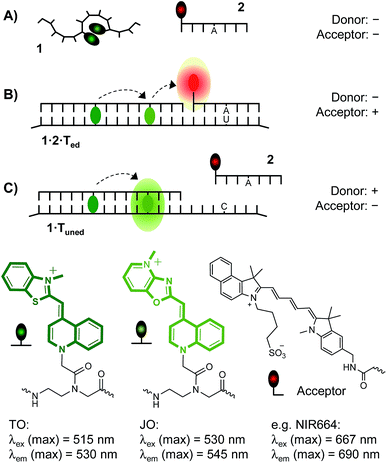
To address this issue, the spectral gap between donor and acceptor emission was increased.18–20 This, however, affects the brightness of the FRET signal. Alternatively, a three-dye system has been used, in which one dye serves as a FRET relay.18 Herein, we describe a binary probe concept that allows avoidance of bleed through by using a dual labeled hybridization probe that is weakly emissive in the absence of target, yet becomes fluorescent and acts as donor for FRET upon target binding. The approach bears resemblance to the dual molecular beacon method introduced by Bao.21 Our method, however, provides a large 190 nm apparent Stokes shift and, for the first time, distinguishes all of the three possible states – that is (i) absence of RNA target, and presence of (ii) C → U edited RNA or (iii) unedited RNA target (Fig. 1). To demonstrate the usefulness of the probes and the high target specificity we show imaging of mRNA in fixed and live cells and discuss the intracellular imaging of a single nucleotide mRNA edit used by nature to post-transcriptionally modify the function of the Glycine Receptor (GlyR).15,22
Results and discussion
In the pursuit of a probe set that allows the detection of the RNA target in both edited and unedited state, we considered the use of a fluorogenic hybridization probe as FRET donor. In an ideal scenario, the spectral gap between donor and acceptor emission should be larger than the width of the donor emission band. This however affects the efficiency of FRET. To compensate for the inevitable loss of the FRET signal intensity, donor emission should be bright. We figured that the desired property i.e. a bright and hybridization-responsive probe is in the reach of our recently developed TO/JO FIT-probes which contain the highly responsive thiazole orange (TO) dye and the highly emissive oxazolopyridine (JO) analogue as fluorescent base surrogates.23,24 In contrast to previous work, we explored PNA-based TO/JO probes. PNA has higher affinity for complementary nucleic acids than DNA and, therefore, permits the use of shorter hybridization probes that provide high sequence specificity required for the discrimination of single base mismatches.25 In addition, PNA is intrinsically stable to nuclease and – unlike DNA – does not require special modifications for usage in live cell RNA imaging.26,27In the unbound state, TO/JO-PNA FIT-probe 1 should have low fluorescence when TO and JO interact via formation of aggregates (Fig. 1A). Owing to the absence of target the two probes 1 and 2 cannot co-align and, therefore, emission in the FRET acceptor channel will remain low as well. Spectral cross-talk between donor emission and FRET emission will be low because the donor is not emissive in absence of target. The presence of the edited RNA target Ted will trigger the adjacent hybridization of both probes and excitation of the donor will induce fluorescence emission in the acceptor channel (Fig. 1B). We were in favour of a FRET acceptor dye that emits at wavelengths > 650 nm, where emission of the TO/JO donor ensemble is very low and selected the NIR664 dye which based on previous reports should still allow sufficient overlap between TO/JO emission and NIR664 absorption.36 The third state, i.e. the presence of the RNA in the unedited, single mismatched state, will be marked by increases of emission in the donor channel when fluorogenic donor probe 1 hybridizes while the mismatched acceptor probe 2 remains unbound (Fig. 1C). Given our previous work on DNA probes, we expected that the JO dye in PNA probe 1 confers a high brightness.24 The JO dye is a bright emitter of fluorescence which may become even brighter when the TO dye serves as a light collector that increases the extinction coefficient and – owing to the small 15 nm shift in emission maxima – efficiently transfers excitation energy to the JO dye. This fosters donor emission in absence on the unedited target (Fig. 1C) or FRET emission on the edited target (Fig. 1B).
Design of dual labelled FRET donor
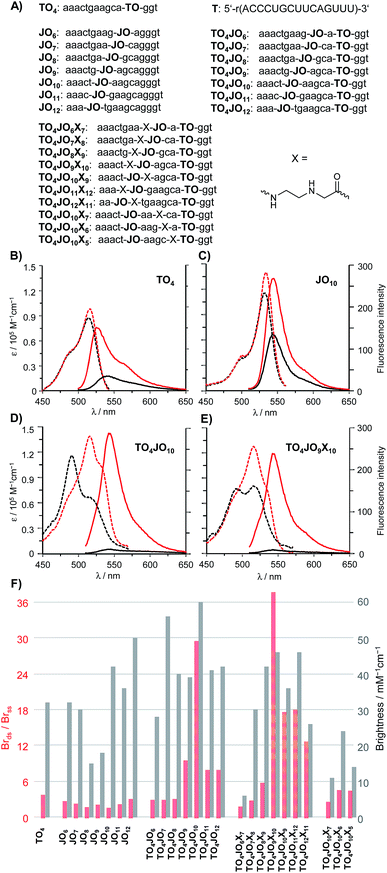
As a first step towards a hybridization probe serving as a bright, albeit responsive FRET donor, we analysed a series of TO/JO-PNA FIT probes that recognise mRNA coding for a human Glycine Receptor (GlyR) (Fig. 2A). Probes, in which the TO and the JO dyes were separated by less than 5 nucleotides afforded a rather modest enhancement of fluorescence brightness upon hybridization (Fig. 2F). The 3-fold increase in emission was inferior to the fluorescence response provided by the TO-only probe TO4 (Brds/Brss = 4, see also Fig. 2B). However, remarkable 10- or 30-fold enhancements of emission brightness were observed when the JO dye was linked in 5 nt (TO4JO9) or 6 nt (TO4JO10) distance, respectively, from the TO dye. Control measurements with the JO-only probes JO9 (Fig. S2†) and JO10 (Fig. 2C) suggested that the enhanced responsiveness (Brds/Brss ≈ 30) was caused by dye–dye communication. Indeed, the increase of the fluorescence responsiveness observed for TO/JO probes TO4JO9 and TO4JO10 correlated with striking changes of the absorption spectra (see Fig. 2D). In the single stranded form, both TO-only (TO4, Fig. 2B) and JO-only (JO10, Fig. 2C) PNA FIT probes have absorption maxima between 515 and 530 nm, and always above 500 nm. In stark contrast, the absorption spectra of the TO/JO probes TO4JO9 and TO4JO10 (Fig. 2D) showed blue-shifted bands at wavelengths smaller than 500 nm. The TO–JO interaction leads to strong quenching of fluorescence. The single stranded TO/JO-PNA FIT probes TO4JO9 and TO4JO10 emit with 25% and 6%, respectively of the brightness expected for the sum of the TO-only and JO-only probes. The hypsochromic shift of absorption and the considerable quenching of fluorescence are indicative for the formation of H-aggregates.The pronounced quenching of fluorescence observed when TO was accompanied by an appropriately positioned JO base surrogate prompted us to consider means of fostering the TO–JO contact. We reckoned that an abasic site adjacent to one of the fluorescent base surrogates (“TO base” or “JO base”) could provide space needed to accommodate a TO–JO complex. To test this hypothesis, we introduced an N-(2-aminoethyl)glycine (aeg) building block (indicated as X in the sequence strings) lacking a nucleobase adjacent to the “JO-base” and repeated the TO–JO-distance screen. Of note, four of the seven tested TO/JO/X-probes afforded hybridization-induced brightness enhancement > 10. We observed a remarkable 38-fold intensification of brightness by using TO4JO9X10 (Fig. 2E). For probes that lacked the aeg unit a 5–6 nt TO–JO distance was required to provide ≥10-fold brightness enhancement. With the aeg unit the spectrum of suitable TO–JO distances was extended to 5–8 nucleotides (and possibly beyond) required that the aminoethylglycine unit was included as JO next neighbour. Control experiments revealed that positioning of the abasic site as next neighbour of the “TO base” afforded rather modest fluorescence responsiveness which is not due to inefficient quenching in the single stranded form but rather caused by a low intensity of emission of the bound probe (Fig. 2F, TO4JO10X5). The intact base stack in the vicinity of the “TO base” is probably required for efficient activation of fluorescence upon hybridization. Likewise, fluorescence activation remained low when the aeg unit was placed between the fluorescent base surrogates in 2–3 nucleotides distance suggesting that the best position for aeg placement is the immediate JO environment. Additional measurements suggested that the beneficial “aeg effect” prevails within another sequence context (Fig. S5†).
An important feature of the binary probe format (Fig. 1) is the brightness of emission from the donor dyes. We found that probe-bound TO/JO probes providing high hybridization-induced fluorescence enhancement also afforded bright emission signals (TO4JO9: Br = 39 mM−1 cm−1; TO4JO10: Br = 60 mM−1 cm−1) that exceeded the intensity of the TO-only probe TO4 (Fig. 2F). We noticed that the placement of the abasic site unit aeg reduced the brightness; for probes with Brds/Brss > 10 by an averaged 10%. However, the brightness of the four aeg-containing probes with Brds/Brss > 10 (TO4JO9X10, TO4JO10X9, TO4JO11X12, TO4JO12X13) was still higher than the brightness of the corresponding TO-only probe TO4.
Cell imaging
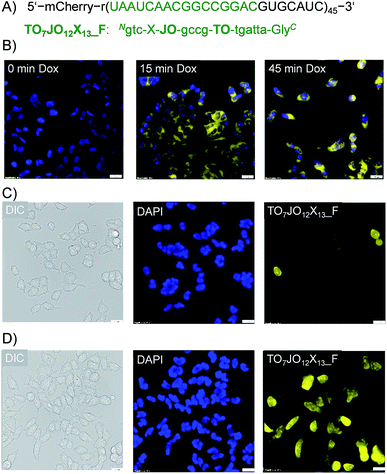
Interactions of the probes with the lipophilic environments inside a cell may perturb dye–dye communication and, thereby, obstruct fluorescence signaling of hybridization with the RNA target. To explore the feasibility of RNA imaging with TO/JO-PNA FIT-probes, we analyzed a stable Flp-InTM 293T-Rex cell line expressing an RNA coding for the fluorescent protein mCherry that was tagged in the 3′-untranslated region with 45 repeats of a 28 nt long sequence (ESI, Chapter 7†) serving as a target for the TO7JO12X13_F probe (Fig. 3A). This probe experienced a 12-fold enhancement of fluorescence upon hybridization (Fig. S5†). Expression of the tagged mCherry RNA was under the control of a doxycycline-responsive promotor. Addition of doxycycline to the cultured cells induced its expression as demonstrated by the emergence of mCherry emission signals measured by fluorescence microscopy, which was absent in untreated cells (Fig. S6†). Next we fixed and permeabilized doxycycline-induced cells before adding 100 nM TO7JO12X13_F probe at 37 °C.28 After 1 h, the buffer was replaced by Dulbecco's phosphate-buffered saline (DPBS). Without further washes, we monitored emission by the TOJOX probe using fluorescence microscopy (Fig. 3B). Immediately after doxycycline addition (0 min), we observed only weak intracellular fluorescence signal, whereas after 15 minutes the cells were stained intensively by TO7JO12X13_F suggesting the presence of intracellular RNA target.Next, we assessed imaging of live cells. For delivery of TO7JO12X13_F, the cells were incubated for 10 min with a 600 nM solution of the FIT-PNA in medium that contained streptolysine O (SLO).27,29 Much stronger fluorescence signals were observed for cells treated with doxycycline (Fig. 3D) than for untreated cells (Fig. 3C). A small number of non-induced cells (3 out of 43, Fig. 3C) shows strong fluorescence. The round shape suggests that these cells undergo apoptosis and we assume that the strong signals are due to increased uptake. A noteworthy observation is that not all of the induced cells show the same intensity of emission from the FIT probe. We assign this phenomenon to cell-to-cell variations of probe delivery. Furthermore, non-synchronized cell lines show cells in different states. This leads to variations of mRNA concentration. In spite of these considerations, the fluorescence microscopy data from fixed and live cells indicates that TO/JO-PNA FIT-probes do allow imaging of intracellular mRNA.
3-State specific analysis of an RNA edit via FRET
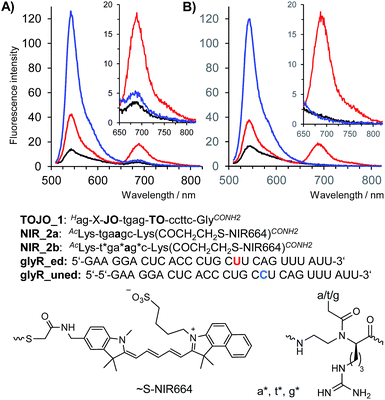
Encouraged by the results of the in vivo measurements we designed a binary probe system for the homogenous detection of C → U editing of mRNA coding for the Glycine Receptor GlyRα2. The binary probe system was comprised of TO/JO-PNA FIT-probe TOJO_1 and NIR664-labeled PNA probe NIR_2a which were designed to target two adjacent segments of the GlyR mRNA. The FRET acceptor strand served the purpose to probe the editing site in RNA glyr_ed. In the absence of target RNA, fluorescence in both donor and acceptor channel was low (Fig. 4A, black curve). Addition of the matched, edited target glyR_ed was accompanied by a 5-fold enhancement of fluorescence emission in the FRET channel at 690 nm (Fig. 4A, red curve). As expected, emission in the FRET channel was weak when the unedited = single base mismatched target was added (Fig. 4A, blue curve), but in this case, the binary system responded by showing an 9-fold increase of the donor emission at 543 nm. We extended the length of NIR664-labeled probe from 6 to 8 nucleobases. However, the longer PNA probes lost the ability to distinguish between edited and unedited RNA (Fig. S8†).A closer inspection revealed a small, yet noticeable FRET signal despite the absence of RNA target (Fig. 4A, inset). We assumed that the faint FRET signal was caused by weak interactions between the two PNA probes. Recently, we have remedied the problem of PNA–PNA interactions in DNA-templated chemistry by using PNA containing positively charged side chains.30 We, therefore, incorporated three guanidino-PNA (GPNA)31 building blocks into NIR664-labeled probe NIR_2b. Gratifyingly, the binary probe system comprised of TO/JO_1 and NIR_2b showed negligible emission in the FRET channel unless matched target glyR_ed was added, in which case emission at 690 nm was intensified by a factor of 14 (Fig. 4B, see also Table 1). Of note, the FRET signal remained on background level upon addition of the mismatched target glyR_uned indicative for a high sequence specificity provided by the binary probe system.
| No RNA target | Edited RNA | Unedited RNA | ||||
|---|---|---|---|---|---|---|
| I 690 | I 690/I543 | I 690 | I 690/I543 | I 690 | I 695/I543 | |
| a Normalized to I690/I543 in absence of RNA target. Conditions: PBS buffer: see caption to Fig. 4. Lysate: 0.5 μM probes, 0.17 μM RNA (when added), 4 × 10⁴ lysed HEK293 cells per mL in PBS buffer, pH 7.2, 41 °C, λex = 500 nm. | ||||||
| PBS | 1.3 ± 0.2 | 0.08 (1)a | 18.0 ± 0.4 | 0.48 (6)a | 0.9 ± 0.1 | 0.0075 (0.09)a |
| Lysate | 3 | 0.06 (1)a | 18 | 0.29 (5)a | 3 | 0.02 (0.33)a |
The apparent quantum yield of the TO/JO/NIR667 ensemble on edited RNA is ∼9.5%, which is lower than that of a single NIR664 dye (∼25%). However, owing to the large extinction coefficient of the TO/JO donor system (150.000 M−1 cm−1 at 520 nm) the brightness of emission at 690 nm can still reach up to 14 mM−1 cm−1. Both apparent Stokes shift and brightness are comparable if not superior to values reported for other large Stokes shift dyes (e.g. ATTO490LS: 150 nm Stokes shift, 12 mM−1 cm−1 brightness).
Measurements of the acceptor/donor emission ratio enable a clear discrimination of the three possible states. Weak signals in the donor and FRET channel characterize the absence of target. The presence of edited target is marked by an 14-fold enhancement of the intensity in the FRET channel and a 6-fold increase of the acceptor/donor emission ratio (Table 1). Increases of the donor emission signal are the hallmark for the presence of the unedited RNA target leading to a 10-fold reduction of the acceptor/donor emission ratio. We explored whether the ability to distinguish the three possible states by means of FRET signaling is sustained in complex matrices such as cell lysate. Indeed, though background in absence of RNA target is higher in cell lysate, the intensity of FRET emission after addition of synthetic edited RNA target is unaffected suggesting that both probes and RNA template remained available for sequence selective hybridization. The increased background in both donor and acceptor emission channels reduced the fold change of acceptor/donor emission ratio. However, the 14-fold change of the FRET ratio determined when edited RNA was replaced by unedited RNA should be sufficient to detect/visualize the RNA editing event by fluorescence microscopy-based cell imaging.
Cellular imaging of an RNA C → U edit
The binary probe system was used to image an mRNA edit in HEK293T cells transiently expressing bicistronic constructs containing mRNA coding for the GlyR a2 protein either in the unedited (GlyR α2192P) or the edited (GlyR α2192L) form (Fig. 5A). We equipped the 3′UTR of the glyrα2 mRNA with 9 MS2 tag repeats, to enable its localisation via an independent method. The genetic information for the required eGFP-tagged MS2 binding protein was added upstream of the GlyR coding sequence and separated by a self-processing A2 peptide.32 The FIT probes were introduced into live transfected HEK293T cells by applying the SLO delivery method. Afterwards, the cells were fixed. The eGFP emission signal served as a control that identifies transfected cells and localizes the target mRNA (Fig. 5B and C). This signal cannot discriminate between edited and unedited states. Furthermore, it has been reported that the MS2 system also detects 3′-UTR segment from degraded mRNA.33,34 However, the signal in the FRET channel is indicative for binding of TO/JO-PNA FIT-probe TOJO_1 and NIR664-labeled PNA probe NIR_2a in the coding region, which suggests that the detected mRNA molecules are intact. Moreover, the fact that target protein coding regions were translated (Fig. S11†) implies a sufficient stability of the mRNA target. We found that the hybridization probes stained cells transfected with the edited RNA (GlyR α2192L) more brightly than cells transfected with the unedited RNA (GlyRα2192P). For a quantitative assessment, we calibrated the intensity of signals from FIT probes with regard to the amount of mRNA target expressed by analysing the ratio between the signals in the FRET channel and those in the eGFP channel. The analysis (Fig. S10†) showed that cells expressing the edited RNA (GlyR α2192L) afforded a nearly two-fold higher intensity of the FRET emission than cells expressing unedited RNA (GlyR α2192P). A comparison with the 6-fold change in FRET emission intensity with synthetic targets in lysate (Table 1) reveals that the ability of the probe system to discriminate between the two RNA single nucleotide variations was compromised in the cells. The decrease in sequence specificity may be due to fixation after probe delivery. We would like to stress that the conditions used to optimize single nucleotide specific signaling in cuvette-type experiments emulate cellular conditions only poorly. For example, high local concentrations of target and/or probe and differences in target folding will affect the Tm differences between matched and single mismatched ternary probe-target complexes.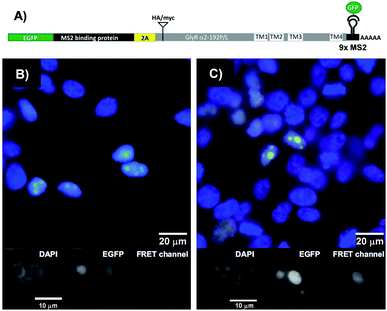 | ||
| Fig. 5 (A) Design of the MS2 reporter construct for in vivo analysis. EGFP-MS2 binding protein (gene 1, green) and the GlyR target (gene 2, gray) α2192P (unedit) or α2192L (edit) including MS2 hairpin repeats in 3′-UTR can be expressed at almost equimolar ratio due to use of the 2A self-processing peptide (yellow) inserted in between. See Fig. S10 and 11† for detailed information about construct design and proof-of-principle. (B and C) Fluorescence microscopy images show target mRNA localization in transfected HEK293 cells expressing (B) GlyR α2192P or (C) α2192L visualized with eGFP-MS2 (green) and TOJO_1+NIR664_2b (red). Cell nuclei are stained with DAPI (blue). Gray scale images of the single fluorescence channels (FIT probe, eGFP-MS2, DAPI) are shown below the superimposed images (blue, green, red). Conditions: 600 nM TOJO_1+NIR664_2b, 30 units SLO, 2 h recovery, then fixation, imaging at 25 °C. Filter set: DAPI (excitation: 350/50x, emission: 470/30 m, beam split: 400), eGFP (excitation: HQ470/40x, emission: HQ522/40 m, beam split: Q497/LP), FRET channel (excitation: HQ470/40x, emission: HQ667/30 m, beam split: Q497/LP). | ||
Enrichment of non-responsive hybridization probes on target can provide sufficient contrast for imaging. We, therefore, performed imaging experiments in the NIR channels. Indeed, the NIR signals showed similar features as observed in the FRET channel, albeit at reduced contrast (Fig. S13†). Though the FRET signal was brightest in cells expressing the edited target mRNA, the signal increase compared to non-transfected cells (i.e. cells lacking the eGFP signal) appears rather modest (Fig. S13†). We speculate that the excess of unbound probes over target is too high. We estimate that transfected cells express 104 to 105 copies of GlyR α2 mRNA. Given the typical dimensions of HEK293 cells this translates to a mean concentration of target mRNA ≤ 101 nM. The 600 nM probe concentration applied during SLO-mediated delivery is much higher. Though the unfavorably large probe/target ratio may be lower at specific cell sites, we infer that typing of the editing state requires the eGFP signal to guide the analysis to the site of mRNA localization.
Conclusions
The fluorogenic probes previously used for detecting single nucleotide variations in RNA did not allow the distinction between absence of target and presence of the single mismatched target.13,14,35 In contrast, our probe system enables to distinguish between three rather than two states. The presence of matched (edited) target is characterised by an increase of the acceptor/donor emission ratio, while decreases of this FRET ratio below background values mark the presence of the mismatched (unedited) RNA target. This feature should facilitate the analysis of intracellular RNA editing by fluorescence microscopy. In this investigation, we demonstrated that the TO/JO-PNA FIT-probes provide a high responsiveness and high brightness of emission at 540 nm that enables FRET to a NIR dye with negligible bleed through. We found that an abasic site adjacent to the JO dye nucleotide improves the responsiveness of the TO/JO-PNA FIT-probes by facilitating TO–JO interactions that have characteristics of H-aggregates. The successful fluorescence microscopic imaging of mRNA in fixed and live cells demonstrated the usefulness of the TO/JO-PNA FIT-probes. We showed that the combination of fluorescence signals from the MS2 mRNA imaging system and the FRET signal from the two hybridization probes provided an indication about the editing state of RNA expressed in HEK293T cells. However, we expect that the full potential of the method will be unleashed when the donor emission will be included in the analysis. In future studies, we will replace the interfering eGFP protein and analyse RNA editing by means of ratio imaging.Conflicts of interest
There are no conflicts to declare.Acknowledgements
We acknowledge support from the Deutsche Forschungsgemeinschaft (SPP 1784, Se 819/11-2, ME 2075/7-1) and the Einstein Foundation Berlin. G.-M. F. is grateful for an Alexander-von-Humboldt-Fellowship. We thank Dr Nancy Kedersha (Boston, MA, USA) for providing a clone coding for EGFP-tagged MS2 binding protein.Notes and references
- G. Bao, W. J. Rhee and A. Tsourkas, Annu. Rev. Biomed. Eng., 2009, 11, 25–47 CrossRef CAS PubMed.
- S. Tyagi, Nat. Methods, 2009, 6, 331–338 CrossRef CAS PubMed.
- A. R. Buxbaum, G. Haimovich and R. H. Singer, Nat. Rev. Mol. Cell Biol., 2015, 16, 95–109 CrossRef CAS PubMed.
- S. Tyagi and F. R. Kramer, Nat. Biotechnol., 1996, 14, 303–308 CrossRef CAS PubMed.
- O. Köhler, D. V. Jarikote and O. Seitz, ChemBioChem, 2005, 6, 69–77 CrossRef PubMed.
- F. Hövelmann and O. Seitz, Acc. Chem. Res., 2016, 49, 714–723 CrossRef PubMed.
- R. A. Cardullo, S. Agrawal, C. Flores, P. C. Zamecnik and D. E. Wolf, Proc. Natl. Acad. Sci. U. S. A., 1988, 85, 8790–8794 CrossRef CAS.
- A. Okamoto, Chem. Soc. Rev., 2011, 40, 5815–5828 RSC.
- Z. Pianowski, K. Gorska, L. Oswald, C. A. Merten and N. Winssinger, J. Am. Chem. Soc., 2009, 131, 6492–6497 CrossRef CAS PubMed.
- L. Holtzer, I. Oleinich, M. Anzola, E. Lindberg, K. K. Sadhu, M. Gonzalez-Gaitan and N. Winssinger, ACS Cent. Sci., 2016, 2, 394–400 CrossRef CAS PubMed.
- H. Abe and E. T. Kool, Proc. Natl. Acad. Sci. U. S. A., 2006, 103, 263–268 CrossRef CAS PubMed.
- I. A. Mellis, R. Gupte, A. Raj and S. H. Rouhanifard, Nat. Methods, 2017, 14, 801–804 CrossRef CAS PubMed.
- Y. Kam, A. Rubinstein, A. Nissan, D. Halle and E. Yavin, Mol. Pharmaceutics, 2012, 9, 685–693 CrossRef CAS PubMed.
- M. V. Sonar, M. E. Wampole, Y. Y. Jin, C. P. Chen, M. L. Thakur and E. Wickstrom, Bioconjugate Chem., 2014, 25, 1697–1708 CrossRef CAS PubMed.
- J. C. Meier, S. Kankowski, H. Krestel and F. Hetsch, Front. Mol. Neurosci., 2016, 9, 124 Search PubMed.
- D. M. Kolpashchikov, Chem. Rev., 2010, 110, 4709–4723 CrossRef CAS PubMed.
- J. L. Mergny, A. S. Boutorine, T. Garestier, F. Belloc, M. Rougée, N. V. Bulychev, A. A. Koshkin, J. Bourson, A. V. Lebedev, B. Valeur, N. T. Thuong and C. Hélène, Nucleic Acids Res., 1994, 22, 920–928 CrossRef CAS PubMed.
- A. A. Martí, X. Li, S. Jockusch, N. Stevens, Z. Li, B. Raveendra, S. Kalachikov, I. Morozova, J. J. Russo, D. L. Akins, J. Ju and N. J. Turro, Tetrahedron, 2007, 63, 3591–3600 CrossRef PubMed.
- Y. Sei-Iida, H. Koshimoto, S. Kondo and A. Tsuji, Nucleic Acids Res., 2000, 28, e59 CrossRef CAS PubMed.
- A. Tsuji, Y. Sato, M. Hirano, T. Suga, H. Koshimoto, T. Taguchi and S. Ohsuka, Biophys. J., 2001, 81, 501–515 CrossRef CAS PubMed.
- P. J. Santangelo, B. Nix, A. Tsourkas and G. Bao, Nucleic Acids Res., 2004, 32, e57 CrossRef PubMed.
- P. Legendre, B. Förstera, R. Jüttner and J. C. Meier, Front. Mol. Neurosci., 2009, 2, 23 Search PubMed.
- L. Bethge, D. V. Jarikote and O. Seitz, Bioorg. Med. Chem., 2008, 16, 114–125 CrossRef CAS PubMed.
- F. Hövelmann, I. Gaspar, A. Ephrussi and O. Seitz, J. Am. Chem. Soc., 2013, 135, 19025–19032 CrossRef PubMed.
- M. Egholm, O. Buchardt, L. Christensen, C. Behrens, S. M. Freier, D. A. Driver, R. H. Berg, S. K. Kim, B. Norden and P. E. Nielsen, Nature, 1993, 365, 566–568 CrossRef CAS PubMed.
- S. Kummer, A. Knoll, E. Socher, L. Bethge, A. Herrmann and O. Seitz, Angew. Chem., Int. Ed., 2011, 50, 1931–1934 CrossRef CAS PubMed.
- S. Kummer, A. Knoll, E. Sucher, L. Bethge, A. Herrmann and O. Seitz, Bioconjugate Chem., 2012, 23, 2051–2060 CrossRef CAS PubMed.
- E. Falconer, E. A. Chavez, A. Henderson, S. S. S. Poon, S. McKinney, L. Brown, D. G. Huntsman and P. M. Lansdorp, Nature, 2010, 463, 93–97 CrossRef CAS PubMed.
- J. M. Fawcett, S. M. Harrison and C. H. Orchard, Exp. Physiol., 1998, 83, 293–303 CrossRef CAS PubMed.
- A. Kern and O. Seitz, Chem. Sci., 2015, 6, 724–728 RSC.
- P. Zhou, M. M. Wang, L. Du, G. W. Fisher, A. Waggoner and D. H. Ly, J. Am. Chem. Soc., 2003, 125, 6878–6879 CrossRef CAS PubMed.
- W. Tang, I. Ehrlich, S. B. Wolff, A. M. Michalski, S. Wolfl, M. T. Hasan, A. Luthi and R. Sprengel, J. Neurosci., 2009, 29, 8621–8629 CrossRef CAS PubMed.
- E. Tutucci, M. Vera, J. Biswas, J. Garcia, R. Parker and R. H. Singer, Nat. Methods, 2018, 15, 81–89 CrossRef CAS PubMed.
- J. F. Garcia and R. Parker, RNA, 2015, 21, 1393–1395 CrossRef CAS PubMed.
- N. Kolevzon, D. Hashoul, S. Naik, A. Rubinstein and E. Yavin, Chem. Commun., 2016, 52, 2405–2407 RSC.
- E. Socher, A. Knoll and O. Seitz, Org. Biomol. Chem., 2012, 10, 7363–7371 CAS.
Footnote |
| † Electronic supplementary information (ESI) available: Including details on synthesis, fluorescence spectra, absorbance spectra and additional experiments are available online. See DOI: 10.1039/c8sc00457a |
| This journal is © The Royal Society of Chemistry 2018 |

