
 Open Access Article
 This Open Access Article is licensed under a Creative Commons Attribution-Non Commercial 3.0 Unported Licence
Monitoring the dynamic photocatalytic activity of single CdS nanoparticles by lighting up H2 nanobubbles with fluorescent dyes†
Hua
Su
 ,
Yimin
Fang
,
Fangyuan
Chen
and
Wei
Wang
*
,
Yimin
Fang
,
Fangyuan
Chen
and
Wei
Wang
*
State Key Laboratory of Analytical Chemistry for Life Science, School of Chemistry and Chemical Engineering, Nanjing University, Nanjing 210023, China. E-mail: wei.wang@nju.edu.cn
First published on 15th January 2018
Abstract
The capability of semiconductor nanomaterials to convert solar energy to chemical energy has led to many promising applications, for instance, photocatalyzed H2 generation. Studying this important photocatalytic reaction at the single nanocatalyst level provides a great opportunity to understand the microscopic reaction kinetics and mechanism by overcoming the chemical and structural heterogeneity among individuals. Here we report a fluorescence (FL) labeling strategy to visualize individual H2 nanobubbles that are generated at single CdS nanoparticles during photocatalysis. In operando imaging of nanobubble growth kinetics allows for determination of the photocatalytic activity of single nanocatalysts, which was found to randomly alternate among high activity, low activity and inactive states. In addition to H2 nanobubbles, the present labeling strategy is also suitable for other types of gas nanobubbles. Since nanomaterial-catalyzed gas generation is widely involved in many important photochemical (water splitting), electrochemical (electrolysis) and chemical (nanomotors) reactions, the present work is promising for the general applicability of single nanoparticle catalysis in broad basic and industrial fields by lighting up nanobubbles under commercial and conventional FL microscopes.
Introduction
Semiconductor nanomaterials have received intensive attention as promising candidates for efficient water splitting via solar photocatalysis due to their excellent photophysical and photochemical properties.1 So far, most semiconductor photocatalysis studies have focused on the averaged properties of a large amount of nanocatalysts in an ensemble system. Ensemble measurements wash out the intrinsic structural and functional heterogeneity among individuals, which hampers the microscopic understanding of the reaction kinetics and mechanisms, and blurs the structure–activity relationship. For example, the discovery of fluorescence (FL) photoblinking of single quantum dots in the 1990s has significantly advanced the fundamental knowledge of the photophysics of semiconductor materials,2,3 which underscores the value of single nanoparticle measurements. In recent years, the concept of studying catalytic reactions at the single nanocatalyst level has emerged rapidly as a powerful complement to traditional ensemble experiments.4–6 Single nanoparticle catalysis studies are often performed on versatile types of optical microscopes that have the capability to monitor individual nanocatalysts in real time. Catalytic reactions occurring on an individual nanocatalyst lead to localized and quantitative changes in a series of time-lapsed optical images, from which the catalytic activity can be interpreted and correlated with each particular nanocatalyst. In situ characterization and manipulation of the chemical composition and structure of the very same individual has paved a bottom-up way towards understanding the structure–activity relationship.7–11 Despite the huge opportunity brought about by single nanoparticle catalysis, the semiconductor catalyzed H2 evolution reaction has not been explored at the single nanoparticle level until recently.12 Considering that the photocatalytic activity of semiconductor nanomaterials is regulated by their photophysical processes, whether the photocatalytic reaction rate at the single nanoparticle level is a constant, or dynamically changes like FL photoblinking, becomes an important question with implications for the reaction mechanism and efficiency.Various optical microscopes have been adopted to watch the nanoscopic catalytic reactions with high spatial and temporal resolution, such as dark-field microscopy (DFM),10,13–15 single molecule fluorescence (SMF) microscopy,8,16–20 Raman microscopy21–24 and infrared microscopy.25 By virtue of the sensitive dependence of the localized surface plasmon resonance effect on the surrounding environment, DFM is a powerful tool for studying plasmonic nanocatalysts such as gold and silver,13 or hybrid nanomaterials containing plasmonic components.10,14,26 It remains challenging to use DFM to study pure dielectric nanomaterials such as semiconductor nanocatalysts. While SMF microscopy is applicable to both plasmonic16,17 and dielectric nanocatalysts,8,18 it often requires a fluorogenic model reaction to indirectly investigate the catalytic activity. The introduction of an artificial fluorogenic reaction may compromise the nature of a catalyst in real, non-fluorogenic reactions such as photocatalytic H2 generation. We recently developed a surface plasmon resonance microscope (SPRM)27,28 and employed it to monitor the electrochemical29,30 and photochemical12,31 reactions of single nanoparticles (NPs). However, home-built SPRM apparatus requires relatively sophisticated instrumentation. The technical requirements of gold-coated coverslips and the corresponding surface plasmon polaritons further affect its general accessibility and feasibility. Here, we propose an in situ FL-labeling strategy to light up hydrogen nanobubbles generated at single semiconductor NPs with conventional FL microscopy, and we report the significant dynamic photocatalytic activity of single CdS NPs.
Results and discussion
Imaging H2 nanobubbles generated at single CdS NPs during photocatalysis
The principle of this strategy is illustrated in Fig. 1a. Individual CdS NPs were sparsely and firmly immobilized on the glass substrate via electrostatic interactions (Fig. S1a and b†). The photocatalytic hydrogen generation activities of bulky CdS NPs were firstly confirmed using traditional ensemble measurement (Fig. S2†). Upon blue light illumination, photogenerated H2 molecules saturated the local medium and nucleated at the nanocatalyst surface to form nanosized H2 bubbles. Subsequently, hydrophobic rhodamine 6G (R6G) FL molecules in the bulk medium were rapidly recruited and accumulated at the nanobubble–liquid interface, leading to enhanced FL emission that lit up the nanobubble under a FL microscope. The capability of R6G to label gas bubbles has been previously reported32 and is validated in the present work (Fig. S3a†). A control experiment further verified the function of R6G dyes for sensitively detecting the photocatalytic process of CdS NPs (Fig. S4†). Correlated SEM characterization and FL imaging provided evidence that nanobubbles were generated on the CdS NPs (Fig. S5†). Therefore, the growth rate of FL emission was subsequently utilized to quantify the photocatalytic activity of single CdS NPs in real time and in operando. Differently to previous SMF approaches, the present labeling strategy is applied to the native products (H2) after the reaction. Therefore, it does not compromise the nature of CdS photocatalysis. A single wavelength (λ = 488 nm) laser beam plays two roles here; it not only triggers the photochemical reactions of CdS NPs, but also excites R6G molecules for FL imaging. In order to minimize the background FL emission from R6G molecules in bulk solution, a commercially available total internal reflection configuration was adopted to achieve near-field illumination via an evanescent wave with a penetration depth of ∼200 nm (Fig. S6a†).33 Note that the proposed labeling strategy is anticipated to be applicable for other types of FL microscopes such as confocal or light-sheet configurations. A wide-field epi-FL microscope was also able to detect these FL-labeled nanobubbles, though the contrast was greatly reduced (Fig. S7b†).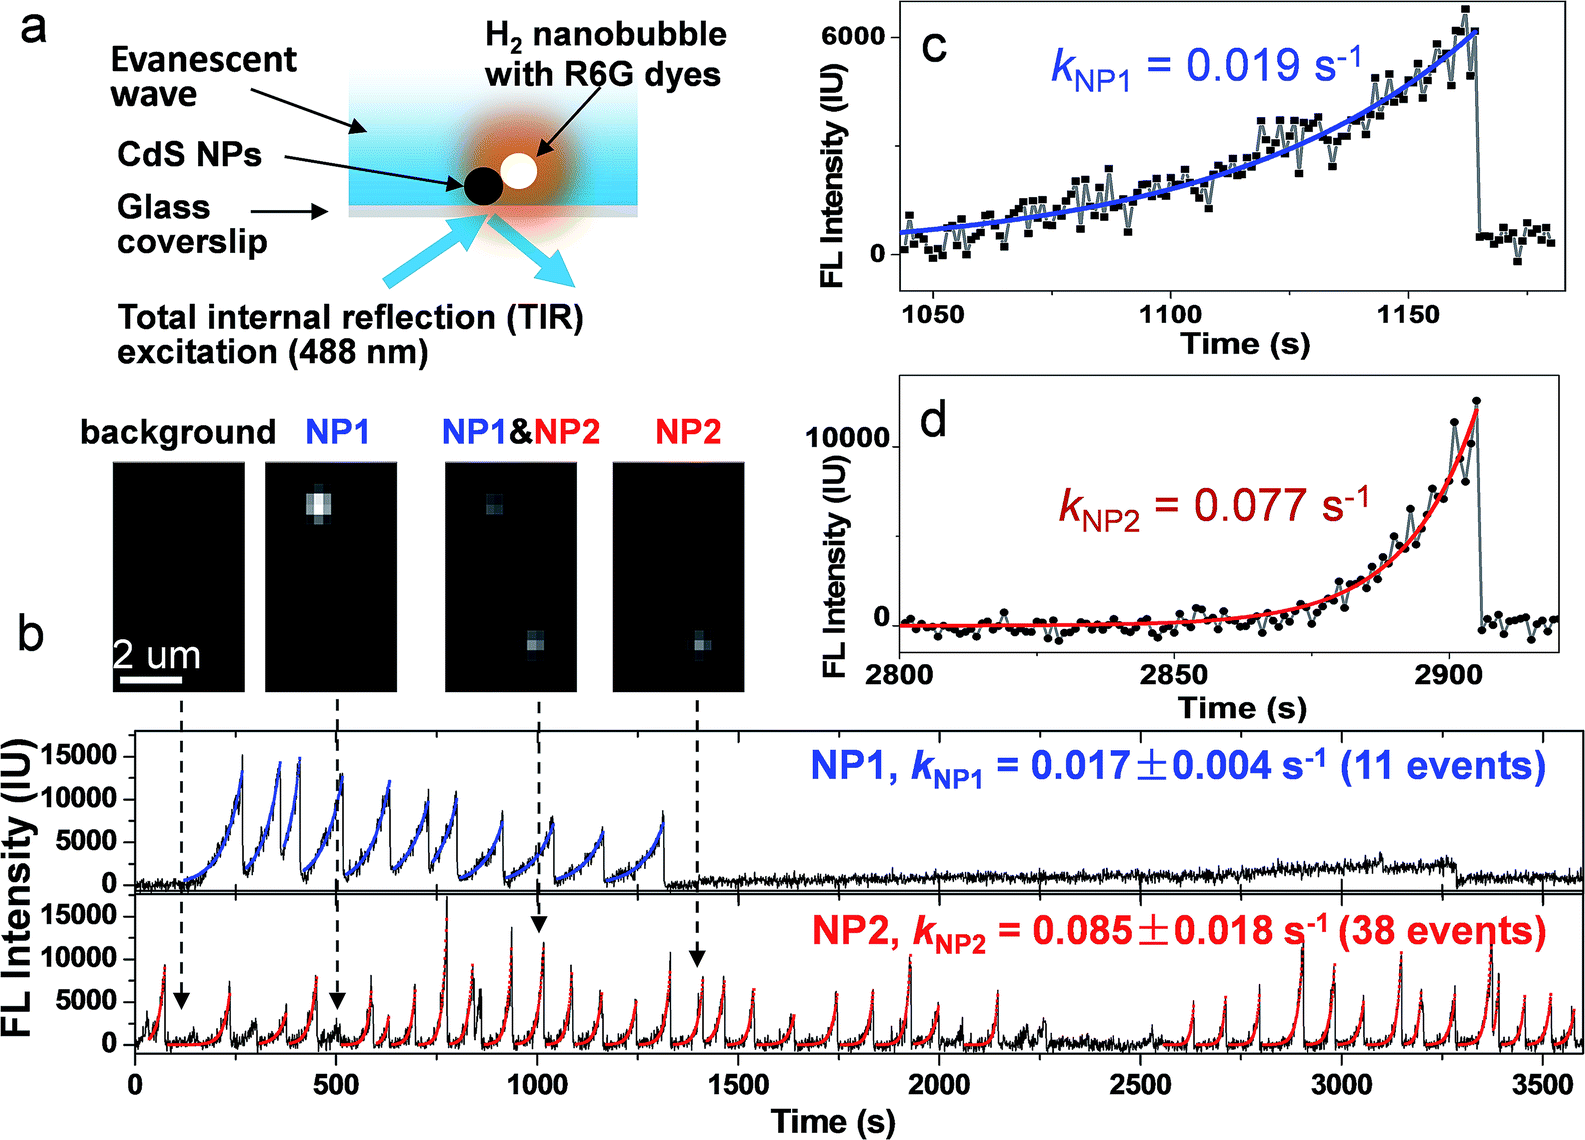 | ||
| Fig. 1 (a) Schematic illustration of the measurement of the photocatalytic activity of single CdS NPs by lighting up H2 nanobubbles with R6G molecules. A 488 nm laser excites an evanescent wave at the surface of the glass coverslip, leading to the photochemical production of H2 nanobubbles at a single CdS nanoparticle. Spontaneous accumulation of R6G molecules at the nanobubble surface results in FL emission (orange color) under a FL microscope. (b) FL trajectory curves of two adjacent CdS NPs. Mono-exponential fitting is displayed as blue (NP1, up panel) and red (NP2, bottom panel). Snapshots of FL images at four moments (109, 516, 1016, and 1412 second) are presented in the inset. Zoom-in curves of two nanobubble events at NP1 (c) and NP2 (d) are also displayed to clarify the kinetic features. | ||
Representative FL trajectories of two adjacent CdS NPs during photocatalysis clearly demonstrate the growth and desolation processes of H2 nanobubbles, as shown in Fig. 1b. Zoom-in curves of two events at NP1 and NP2 are shown in Fig. 1c and d, respectively. A movie showing detailed images and FL trajectories is also provided as Movie S1.† We will describe several features in the observed FL trajectories as follows. First, a monotonic increase in the FL intensity is followed by a rapid drop to its original value, corresponding to the gradual growth and sudden collapse of an individual nanobubble. The FL intensity curve during the growth period can be well fitted by a mono-exponential function, resulting in characteristic rate constants of 0.019 and 0.077 s−1 for NP1 and NP2, respectively. An intensity drop is usually completed within 23 ms (Fig. S8†). The rapid disappearance of the nanobubble is consistent with the classical thermodynamics theory, which predicts that a 1-micron H2 bubble will completely dissolve in water within 6 ms.34,35 Second, FL trajectories are independent and unsynchronized between two adjacent NPs (Fig. 1b insets). In addition, nanobubble growth rate on NP2 (0.085 ± 0.02 s−1) is found to be 5 times larger than that on NP1 (0.017 ± 0.004 s−1). Statistical analysis of 398 nanobubbles at 31 CdS NPs further confirmed that the growth rate was significantly different from nanoparticle to nanoparticle (Fig. S9†). Therefore, we believe that the FL intensity growth rate reflects the intrinsic properties of individual CdS NPs. Third, nanobubbles were sometimes continuously generated, i.e., another nanobubble appeared immediately after the collapse of the previous one. However, resting periods were also observed without any sign of a nanobubble (or with nanobubbles below the detection limit). The time lengths of these resting periods ranged from a few seconds to thousands of seconds. Fourth, the maximal FL intensities vary by up to 10 fold among different nanobubble events at the same CdS nanoparticle (NP2 for instance), demonstrating that nanobubble lifetime or the moment of collapse is not determined by its size. Instead, the loss (or significant reduction) of photocatalytic activity is more likely to stop (or slow down) the H2 supply, thus causing the collapse.
FL images of individual nanobubbles were collected by subtracting the background image from the image just before collapse. Most nanobubbles display a well-defined 2-dimensional Gaussian distribution (Fig. 2a–c), with a full width at half maximum (FWHM) of 280 ± 29 nm. The point spreading function of the present microscope was determined to have a FWHM of 260 ± 18 nm, calculated by taking immobilized quantum dots as standard samples (Fig. S10a†). These results demonstrated that the size of the nanobubbles was smaller than the diffraction limit. The slightly larger FWHM value (280 vs. 260 nm) indicated that most of the nanobubbles were attached to CdS NPs with a certain vertical distance to the substrate, leading to the broadening effect under de-focused conditions. This is expected as the substrate is highly hydrophilic due to the modification with positively charged molecules. Ring-shaped FL images (Fig. 2d–f) are sometimes detected, corresponding to nanobubbles larger than the diffraction limit. This is because R6G is mainly adsorbed at the surface of a nanobubble and the inner core is free of fluorophores (Fig. S3a–c†).
 | ||
| Fig. 2 FL images of H2 nanobubbles generated at single CdS NPs during photocatalysis. Experimental (a) and fitted (b, c) FL images of a single nanobubble smaller than the diffraction limit. For nanobubbles larger than the diffraction limit, the FL image shows a ring-shaped pattern in the 2-dimensional (d) and 3-dimensional (f) views because R6G molecules are adsorbed at the surface of the nanobubble (e). | ||
Measuring the photocatalytic activity of single CdS NPs by imaging nanobubble growth kinetics
We further examined the growth kinetics of individual nanobubbles by estimating their diameter from FWHM analysis. Fig. 3a shows the FL trajectory of a nanobubble with a rate constant of 0.0045 s−1. The gradually increasing FWHM is shown in Fig. 3b (black dots) as obtained by analyzing each of the 510 images. Gaussian fitting is not applicable in the first 160 images due to the weak signal-to-background ratio. In the subsequent period (160th–400th s), FWHM values are between 280 and 320 nm (gray zone in Fig. 3b), suggesting that the nanobubble size is smaller than the diffraction limit. In the final period (400th–510th s), the FWHM gradually increases from 320 to 400 nm, which reveals the actual diameter of the nanobubble. The FL intensity of the nanobubble is found to be proportional to its surface area in this range (Fig. 3c), further supporting the idea that FL emission is from the R6G, accumulated at the nanobubble surface. By extrapolating such linear dependence to the entire period, one can calculate the nanobubble diameter as a function of time (Fig. 3b, red curve). The result shows quasi-linear growth at a speed of 0.72 nm s−1. This result also indicates that the present setup allows for the detection of H2 nanobubbles as small as 80 nm.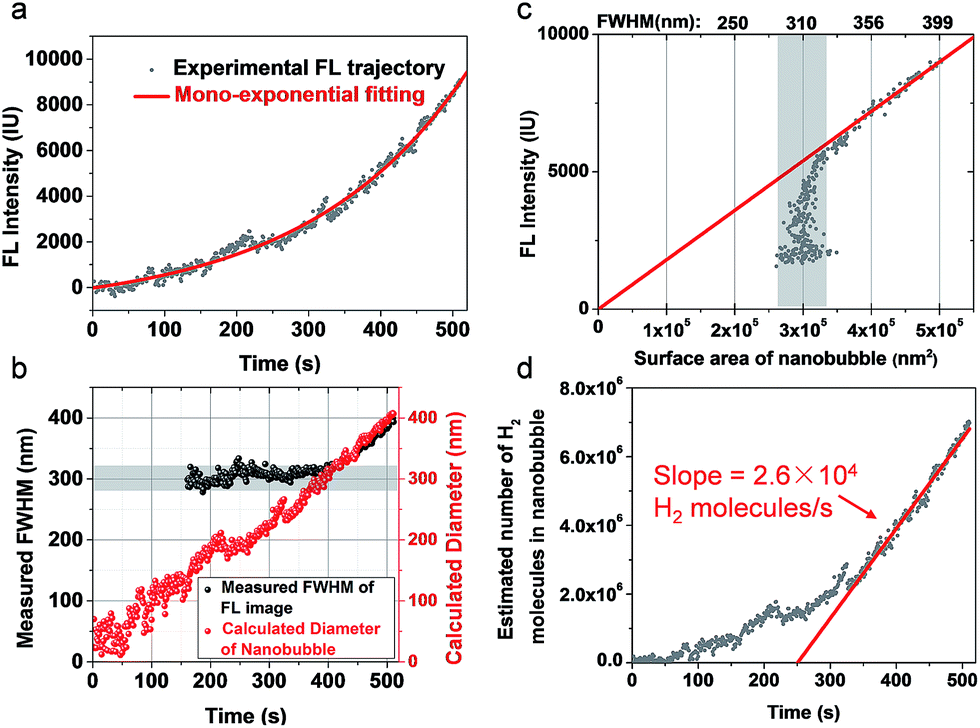 | ||
| Fig. 3 (a) The FL trajectory shows mono-exponential growth of a single H2 nanobubble. (b) Measured FWHM (black dots) and calculated diameter (red dots) showing a linear increase in the diameter of the nanobubble as a function of time. (c) FL intensity is proportional to the surface area of the nanobubble. Note that the calculation of surface area is accurate only when the FWHM is larger than 320 nm. (d) The calculated number of H2 molecules in the nanobubble suggests a single nanoparticle H2 generation rate of 2.6 × 10⁴ molecules per second per nanoparticle. | ||
The hydrogen generation rate of a single CdS nanoparticle was estimated to be 2.6 × 10⁴ H2 molecules per nanoparticle per second, according to the ideal gas law below:
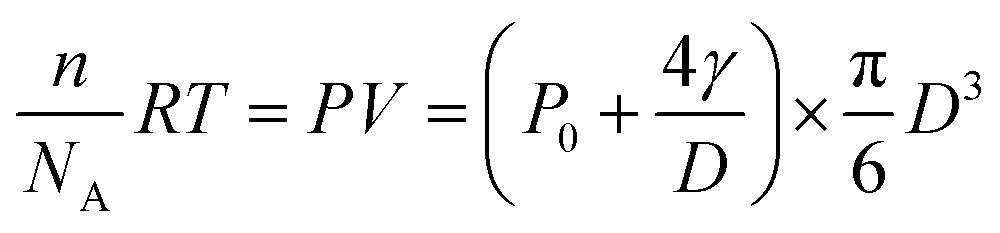 | (1) |
Control experiments were conducted to demonstrate that the nanobubble growth kinetics indeed reflected the photocatalytic activity of the corresponding CdS nanoparticle (internal factor), rather than the H2 concentration in the surrounding medium, which was due to the contribution of adjacent nanoparticles (external factor). First, no nanobubble evolution was observed at single CdS NPs by physically (blowing H2 gas) or chemically (decomposition of NaBH4) saturating the solution with external H2 (Fig. S11†). The saturation was confirmed by the formation of H2 bubbles at the hydrophobic wall of the container. These results demonstrated that the nucleation of H2 molecules, contributed by the surrounding medium, at CdS NPs was prohibited even in a saturation scenario. It therefore excludes the external factor mentioned above. Second, the growth rate of the nanobubble was positively correlated with the photocatalytic activity of CdS NPs. When increasing the laser power density, the nanobubble growth rate was found to increase accordingly (Fig. S12†). Thirdly, it was found that an induction time was often required to initiate nanobubble evolution in photocatalysis experiments. This could be significantly shortened by pre-saturating the solution with hydrogen (Fig. S13†). Therefore, the external factor led to and maintained the saturation of the solution, a prerequisite for bubble evolution. The internal factor determined the nucleation and growth rate of the nanobubble.
Revealing the dynamic photocatalytic activity of single CdS NPs
The photocatalytic activity of a single CdS nanoparticle was found to display a dynamically changing nature, i.e., it randomly alternated among high activity, low activity and inactive states. A 7 hour FL intensity trajectory of a single CdS nanoparticle is shown in Fig. 4a, consisting of 127 nanobubble events. The growth rate of each event is found to vary by up to 20 times, with an average of 0.026 ± 0.016 s−1 (Fig. 4b). The fluctuating rate constants together with the existence of many resting periods revealed the dynamic nature of single nanoparticle photocatalysis. | ||
| Fig. 4 Dynamic photocatalytic activity of single CdS NPs. (a) FL trajectory of a single CdS nanoparticle during a photocatalysis experiment of 7 hours. (b) The calculated growth rate of 127 nanobubble events exhibits a fluctuation of up to 20 times. | ||
Fluctuating activities are sometimes observed in single nanoparticle studies due to different mechanisms. For instance, surface re-arrangements of metal atoms were found to cause an activity fluctuation of single metal NPs.10,16,36,37 De-activation and recovery of single nanoparticle activity due to the adsorption and desorption of surface adsorbates was recently reported at a relatively long timescale.17 The dynamic photocatalytic activity of single CdS NPs in the present work is consistent with our previous results obtained using SPRM, which suggested that both dynamic photocatalysis and intermittent fluorescence were regulated by the intrinsic photophysical processes of semiconductor NPs.12 The different methodology and imaging technique adopted here further confirmed this important conclusion, despite some different features between the optical trajectories. First, the duration of active states in FL measurements (100–200 seconds) is several times longer than that in SPRM measurements (10–50 seconds).12 We believe this is due to the incapability of the present FL technique to detect nanobubbles smaller than 80 nm. Such detection limit was about 40 nm for SPRM. Here, substrate-adsorbed R6G molecules and free ones in the solution resulted in a relatively high FL background. Further optimization of the type and concentration of dyes and the optical configuration are anticipated to improve the detection capability. Second, the size of the nanobubbles in the present work is continuously increasing and never reaches a plateau before the collapse. This is different from the previous observation that stable optical responses were often reached before the collapse. Such a difference is attributed to the different surface chemistry of the substrate. In order to minimize the non-specific adsorption of R6G, a hydrophilic substrate is utilized here, which rendered a different stability of the nanobubbles compared to that with the previously used hydrophobic surface.
Since the nanobubble growth rate only indirectly reflects the photocatalytic activity, it is worthwhile to clarify the relationship between them. Nanobubble growth is a complicated process, which is not only regulated by the intrinsic photocatalytic activity of CdS nanoparticles (internal factor), but also affected by many physicochemical parameters such as the surface chemistry and geometrical morphology of nanoparticles as well as the surface tension and microenvironment of the local solution (external factors). For different individuals (or different types of nanocatalysts), simply comparing nanobubble growth rates is not sufficient because of the significantly different external factors. However, for the same individual, these external factors are anticipated to be relatively stable over a limited period of time. Therefore, temporal evolution of the nanobubble growth rate for the same individual allows us to evaluate the dynamic change in the photocatalytic activity.12 The positive correlation between nanobubble growth rate and photocatalytic activity for the same individual has been demonstrated in previous studies10,12 and the present work (Fig. S12†). While further investigation is certainly required to further clarify this point, the FL-labeling strategy proposed here would play an important role in achieving this goal.
Conclusions
In summary, we have proposed an in situ labeling methodology for quantitative and in operando monitoring of photogenerated H2 nanobubbles at single CdS NPs under conventional FL microscopy. The FL intensity is proportional to the surface area of the nanobubbles, allowing for determination of the generation rate of H2 molecules at the single nanoparticle level. By continuously measuring the nanobubble growth rate, dynamic photocatalytic activity was observed between active and inactive states due to the random photophysical processes of CdS NPs. This labeling method relies on the hydrophobic nature of the gas bubble, and it is thus suitable for various kinds of bubbles regardless of their chemical composition and size. Since catalytic gas release is involved in many important reactions, such as water splitting, consumption of chemical fuels (carbohydrate, hydrazine, etc.), nanomotors, and even bacterial gas production, the present work is anticipated to benefit these basic and industrial fields by helping to understand the corresponding reaction kinetics and mechanism at the single nanoparticle level.Conflicts of interest
The authors declare no competing financial interests.Acknowledgements
We acknowledge financial support from the National Natural Science Foundation of China (Grants No. 21522503, 21527807 and 21605078) and the Natural Science Foundation of Jiangsu Province (BK20150013 and BK20150570). We thank Dr Yin Ding and Dr Fei Liu for helping with confocal and electron microscope experiments.Notes and references
- X. Chen, S. Shen, L. Guo and S. S. Mao, Chem. Rev., 2010, 110, 6503–6570 CrossRef CAS PubMed
.
- M. Nirmal, B. O. Dabbousi, M. G. Bawendi, J. J. Macklin, J. K. Trautman, T. D. Harris and L. E. Brus, Nature, 1996, 383, 802–804 CrossRef CAS
- P. Frantsuzov, M. Kuno, B. Janko and R. A. Marcus, Nat. Phys., 2008, 4, 519–522 CrossRef
- P. Chen, X. Zhou, H. Shen, N. M. Andoy, E. Choudhary, K.-S. Han, G. Liu and W. Meng, Chem. Soc. Rev., 2010, 39, 4560–4570 RSC
- J. B. Sambur and P. Chen, Annu. Rev. Phys. Chem., 2014, 65, 395–422 CrossRef CAS PubMed
- T. Tachikawa and T. Majima, Chem. Soc. Rev., 2010, 39, 4802–4819 RSC
- M. B. J. Roeffaers, B. F. Sels, H. Uji-i, F. C. De Schryver, P. A. Jacobs, D. E. De Vos and J. Hofkens, Nature, 2006, 439, 572–575 CrossRef CAS PubMed
- J. B. Sambur, T.-Y. Chen, E. Choudhary, G. Chen, E. J. Nissen, E. M. Thomas, N. Zou and P. Chen, Nature, 2016, 530, 77–80 CrossRef CAS PubMed
- Y. Du, X. He, Y. Zhan, S. Li, Y. Shen, F. Ning, L. Yan and X. Zhou, ACS Catal., 2017, 7, 3607–3614 CrossRef CAS
- S. Li, Y. Du, T. He, Y. Shen, C. Bai, F. Ning, X. Hu, W. Wang, S. Xi and X. Zhou, J. Am. Chem. Soc., 2017, 139, 14277–14284 CrossRef CAS PubMed
- Y. Du, Y.-B. Shen, Y.-L. Zhan, F.-D. Ning, L.-M. Yan and X.-C. Zhou, Chin. Chem. Lett., 2017, 28, 1746–1750 CrossRef CAS
- Y. Fang, Z. Li, Y. Jiang, X. Wang, H.-Y. Chen, N. Tao and W. Wang, Proc. Natl. Acad. Sci. U. S. A., 2017, 114, 10566–10571 CrossRef CAS PubMed
- C. Novo, A. M. Funston and P. Mulvaney, Nat. Nanotechnol., 2008, 3, 598–602 CrossRef CAS PubMed
- D. Seo, G. Park and H. Song, J. Am. Chem. Soc., 2012, 134, 1221–1227 CrossRef CAS PubMed
- L.-X. Qin, Y. Li, D.-W. Li, C. Jing, B.-Q. Chen, W. Ma, A. Heyman, O. Shoseyov, I. Willner, H. Tian and Y.-T. Long, Angew. Chem., Int. Ed., 2012, 51, 140–144 CrossRef CAS PubMed
- W. L. Xu, J. S. Kong, Y.-T. E. Yeh and P. Chen, Nat. Mater., 2008, 7, 992–996 CrossRef CAS PubMed
- X. Zhou, N. M. Andoy, G. Liu, E. Choudhary, K.-S. Han, H. Shen and P. Chen, Nat. Nanotechnol., 2012, 7, 237–241 CrossRef CAS PubMed
- Y. Zhang, J. M. Lucas, P. Song, B. Beberwyck, Q. Fu, W. Xu and A. P. Alivisatos, Proc. Natl. Acad. Sci. U. S. A., 2015, 112, 8959–8964 CrossRef CAS PubMed
- M. B. J. Roeffaers, G. De Cremer, J. Libeert, R. Ameloot, P. Dedecker, A.-J. Bons, M. Buckins, J. A. Martens, B. F. Sels, D. E. De Vos and J. Hofkens, Angew. Chem., Int. Ed., 2009, 48, 9285–9289 CrossRef CAS PubMed
- T. Tachikawa, N. Wang, S. Yamashita, S.-C. Cui and T. Majima, Angew. Chem., Int. Ed., 2010, 49, 8593–8597 CrossRef CAS PubMed
- E. M. van Schrojenstein Lantman, T. Deckert-Gaudig, A. J. G. Mank, V. Deckert and B. M. Weckhuysen, Nat. Nanotechnol., 2012, 7, 583–586 CrossRef CAS PubMed
- J.-H. Zhong, X. Jin, L. Meng, X. Wang, H.-S. Su, Z.-L. Yang, C. T. Williams and B. Ren, Nat. Nanotechnol., 2017, 12, 132–136 CrossRef CAS PubMed
- A. J. Wilson and K. A. Willets, Nano Lett., 2014, 14, 939–945 CrossRef CAS PubMed
- L. Li, U. Steiner and S. Mahajan, Nano Lett., 2014, 14, 495–498 CrossRef CAS PubMed
- C.-Y. Wu, W. J. Wolf, Y. Levartovsky, H. A. Bechtel, M. C. Martin, F. D. Toste and E. Gross, Nature, 2017, 541, 511–515 CrossRef CAS PubMed
- L. Li, T. Hutter, A. S. Finnemore, F. M. Huang, J. J. Baumberg, S. R. Elliott, U. Steiner and S. Mahajan, Nano Lett., 2012, 12, 4242–4246 CrossRef CAS PubMed
- W. Wang, Y. Yang, S. Wang, V. J. Nagaraj, Q. Liu, J. Wu and N. Tao, Nat. Chem., 2012, 4, 846–853 CrossRef CAS PubMed
- B. Huang, F. Yu and R. N. Zare, Anal. Chem., 2007, 79, 2979–2983 CrossRef CAS PubMed
- M. Hasheminejad, Y. Fang, M. Li, Y. Jiang, W. Wang and H.-Y. Chen, Angew. Chem., Int. Ed., 2017, 56, 1629–1633 CrossRef CAS PubMed
- D. Jiang, Y. Jiang, Z. Li, T. Liu, X. Wo, Y. Fang, N. Tao, W. Wang and H.-Y. Chen, J. Am. Chem. Soc., 2017, 139, 186–192 CrossRef CAS PubMed
- Z. Li, Y. Fang, Y. Wang, Y. Jiang, T. Liu and W. Wang, Chem. Sci., 2017, 8, 5019–5023 RSC
- C. U. Chan and C.-D. Ohl, Phys. Rev. Lett., 2012, 109, 174501 CrossRef PubMed
- D. Axelrod, Traffic, 2001, 2, 764–774 CrossRef CAS PubMed
- V. S. J. Craig, Soft Matter, 2011, 7, 40–48 RSC
- D. Lohse and X. Zhang, Rev. Mod. Phys., 2015, 87, 981–1035 CrossRef CAS
- T. Chen, Y. Zhang and W. Xu, Phys. Chem. Chem. Phys., 2016, 18, 22494–22502 RSC
- X. Zhou, W. Xu, G. Liu, D. Panda and P. Chen, J. Am. Chem. Soc., 2010, 132, 138–146 CrossRef CAS PubMed
Footnote |
| † Electronic supplementary information (ESI) available: Experimental details, Fig. S1–S13 and description of Movie S1. See DOI: 10.1039/c7sc04684g |
| This journal is © The Royal Society of Chemistry 2018 |