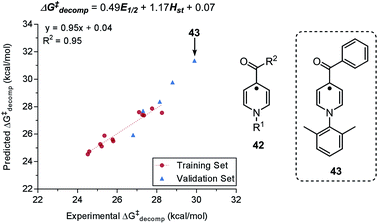
 Open Access Article
Creative Commons Attribution 3.0 Unported Licence
Predictive and mechanistic multivariate linear regression models for reaction development
Celine B.
Santiago
,
Jing-Yao
Guo
and
Matthew S.
Sigman
 *
*
Department of Chemistry, University of Utah, 315 South 1400 East, Salt Lake City, Utah 84112, USA. E-mail: sigman@chem.utah.edu
First published on 23rd January 2018
Abstract
Multivariate Linear Regression (MLR) models utilizing computationally-derived and empirically-derived physical organic molecular descriptors are described in this review. Several reports demonstrating the effectiveness of this methodological approach towards reaction optimization and mechanistic interrogation are discussed. A detailed protocol to access quantitative and predictive MLR models is provided as a guide for model development and parameter analysis.
Introduction
The development of a new reaction methodology, especially in asymmetric catalysis, can be a challenging and expensive task, as it is generally attained through exhaustive reaction screening.1 Traditional reaction optimization routes are often based on empiricisms with occasional systematic approaches such as Design of Experiments (DoE)2 or High Throughput Screening (HTS).1,3–6 Additionally, mechanistic analyses are typically performed subsequent to completion of reaction optimization where computational studies are supplemented for further refinement of chemical understanding.7A reaction optimization strategy which simultaneously interrogates reaction mechanism and identifies better performers during the early stages of reaction optimization is an evolving approach towards meticulous design of new catalysts.8–18 In particular, an optimization method by Sigman and coworkers8 utilizes multivariate linear regression (MLR) models that are acquired based on a mathematical relationship of the experimental reaction outcome (e.g., selectivity (enantio-, regio-, and chemo-), turnover number and turnover frequency (TOF),19,20 reaction rate,21 and yield22) as a function of both experimentally-derived and calculated physical organic molecular descriptors. Substandard results with low yield/low enantioselectivity, commonly omitted without further consideration in the conventional empiricism-driven optimization route,23 are utilized in this MLR approach to generate a diverse and wide-ranging data set for statistical analysis.24
In order to attain statistical models, it is a prerequisite to have structural modularity of the molecules of interest and consequently, large parameter libraries will need to be built. Recent advances in computational methods and resources encouraged the application of accurate molecular simulation utilizing density functional theory (DFT) to generate descriptors for molecular-feature-based MLR model applications. A notable advantage of this MLR approach over Quantitative Structure Activity Relationship (QSAR)25–27 is the selection and employment of physically meaningful molecular descriptors instead of topological descriptors.28 Therefore, useful mechanistic information can be gathered from well-validated mathematical models. In comparison with transition state analysis, the MLR approach has a substantially lower computational requirement since it utilizes ground state structures as the parameter source and an initial mechanistic hypothesis is unnecessary. Moreover, this computational advantage of the MLR approach provides means for virtual screening, where reaction outcomes can be predicted a priori.29,30 Application of these modern statistical analysis tools in asymmetric catalysis can accelerate reaction optimization and provide a platform for de novo catalyst design through predictive modelling.
The aim of this minireview is to demonstrate the capabilities of a predictive and mechanistically informative MLR modelling approach via utilization of suitable physical organic molecular descriptors. Additionally, a detailed protocol is provided describing the step-by-step process from parameter acquisition and selection, to multivariate linear regression.
Molecular descriptors
Since the seminal work of Hammett in the 1930s, Linear Free Energy Relationships (LFERs) have been widely used by the organic chemistry community to relate structure to function with the purpose of gaining mechanistic information and predicting reaction outcomes.31–35 Recognizing the inherent ambiguity in qualitative evaluation of reactivity patterns based only on chemical structure, Hammett developed a quantitative molecular descriptor, σ, to describe aryl substituent electronic effects. The broad applicability of the Hammett parameter and the LFER method triggered the development of various molecular descriptors.26,36,37 In this section, physically meaningful molecular descriptors that have been applied in multivariate linear regression analysis are discussed.Steric parameters
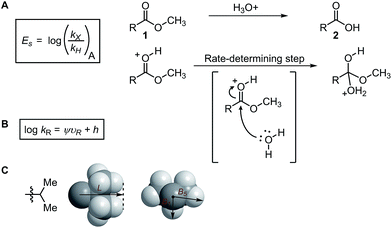
Steric effects play a key role in asymmetric induction since the spatial orientation of every reactive species during the stereodetermining step must be precisely controlled. This prompted the generation of parameters to quantitatively describe steric effects. Various steric parameters that have been previously introduced in the literature include the Taft parameter,36 Charton parameter,38 Sterimol values,39 Tolman cone angle,40 buried volumes,41 torsion angles, bond lengths, and bite angles.42,43A decade later after the introduction of Es, Charton proposed an improved variation of the Taft steric parameter, which further eliminates the electronic influence by correlating the experimentally measured reaction rates from the acid-catalysed hydrolysis with the calculated van der Waals radii (Fig. 1B).38 This experimentally verified parameter is called the Charton value (υ). Considering the multifaceted nature of steric effects, Verloop presented a more sophisticated set of steric parameters, the Sterimol values, which provides various dimensional measurements as subparameters instead of a single, cumulative value that represents the entire spatial information.39 The most representative Sterimol parameters include the distance along the bond axis L, the minimum radius perpendicular to the bond axis B1, and the maximum radius B5 (Fig. 1C).
These physical organic steric parameters were initially developed for QSAR analysis in evaluation of biological activity, but were recently shown as valuable tools in asymmetric catalysis. A study by Harper et al. has compared the Charton and Sterimol steric parameters in an effort to quantitatively define the influence of the substituent steric effects on the enantioselectivity in the desymmetrization of bisphenol 3 using a peptide catalyst 5 as previously reported by Miller (Fig. 2A).44,45 The Charton value of the substituent was found to be inadequate in describing the steric influence from unsymmetrical substituents on the measured enantioselectivity (Fig. 2B). This break in linearity in the Charton LFER model exposed a potential deficiency of Charton values caused by its simplified treatment of substituents, which are considered as freely rotating groups and thus are described as spheres. In contrast, the dimensionality feature of the Sterimol values allows for a more detailed description of the substituent shape. Through multivariate analysis, a superior model was generated relating the observed enantioselectivity (ΔΔG‡) to the R substituent Sterimol B1 and L values (Fig. 2C). A similar approach was presented in the analysis of enantioselective Nozaki–Hiyama–Kishi propargylation of methyl ketone 6, where a multivariate linear regression analysis using a combination of Sterimol values derived from the quinoline-proline ligand 9 was able to depict the enantioselectivity (Fig. 2D).
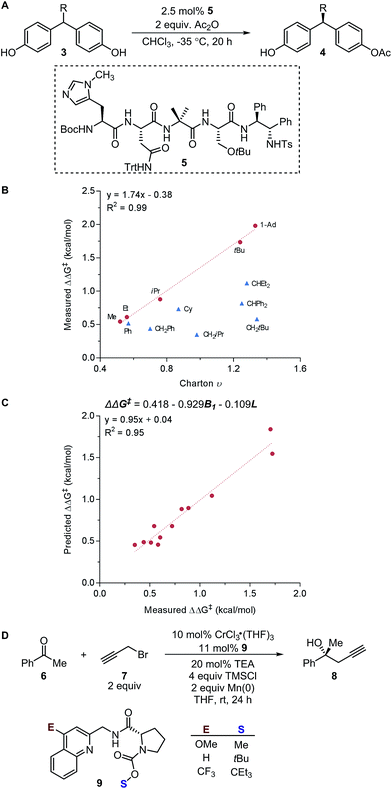 | ||
| Fig. 2 (A) Desymmetrization of bisphenol. (B) Charton–LFER model. (C) Sterimol–LFER model. (D) Nozaki–Hiyama–Kishi propargylation of acetophenone. | ||
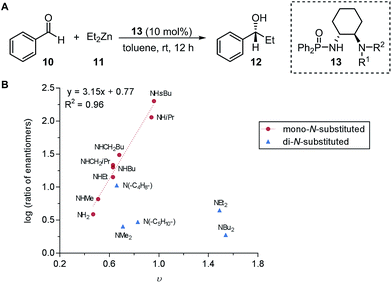
Subsequently, the Song laboratory investigated how the amino group of the chiral phosphoramide catalyst 13 affects the measured enantioselectivity in the asymmetric addition of diethylzinc 11 with benzaldehyde 10 (Fig. 3A).46 The Charton value υ of the amino substituent can account for only the enantioselectivity induced by mono-N-substituted catalysts, while the di-N-substituted chiral phosphoramide catalysts have to be excluded from the Charton-LFER model (Fig. 3B). This inability of the Charton parameter to describe the heterogeneity in the amino substituents further illustrates its limitations. In comparison, with the utilization of the individual Sterimol B1 values of the R1 and R2N-substituents as parameters, both the mono-N-substituted and di-N-substituted chiral phosphoramide catalysts were successfully incorporated in one comprehensive model. Additionally, Sterimol MLR models were utilized to depict the enantioselectivity invoked by chiral 1,2-amino-phosphinamide ligands in a Henry reaction47 and chiral 1,2-amino-phosphoramide ligands in the asymmetric addition of diethylzinc to acetophenone.48
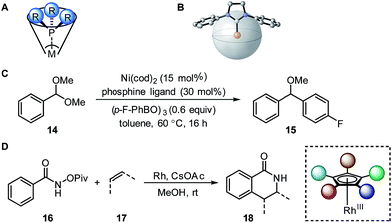 | ||
| Fig. 4 (A) Tolman cone angle. (B) Percent buried volume. (C) Nickel-catalysed Suzuki cross-coupling. (D) Rhodium-catalysed C–H activation. | ||
A recent report by Wu and Doyle examined the influence of phosphine ligands on the yield of a nickel-catalysed Suzuki C-sp3 coupling of acetals 14 with boronic acids to generate benzylic ethers 15 (Fig. 4C).22 The Tolman cone angle and the percent buried volume of a variety of phosphine ligands (including Buchwald-type ligands) were compared in order to delineate the differences between the two steric parameters. After performing a MLR modelling approach, the remote steric hindrance as depicted by the high θ and low %Vbur of high-yielding phosphine ligands was identified as a critical factor to improve the reaction yield.
Since the Tolman cone angle is specifically designed to describe phosphines, extending the application of this steric readout to other ligand types would be relevant to further understanding of organometallic reactions. As a demonstration, Paton, Rovis, and coworkers employed cone angle and Sterimol analysis to rationalize how cyclopentadienyl (Cpx) ligands structurally affect the regioselectivity and diastereoselectivity in rhodium-catalysed C–H functionalization reactions (Fig. 4D).53
Electronic parameters
While asymmetric induction has been traditionally attributed to the steric influence of the chiral catalyst, remote variations altering the electronic properties of the catalyst can result in significant changes in enantioselectivity as well. With careful evaluation of ligand structure to activity, electronic manipulation of ligands can be an advantageous tool for design of asymmetric catalysts. In this section, various electronic parameters and their applications in LFERs will be discussed. It is noteworthy that, instead of representing purely electron density, most of these parameters incorporate structural information as well.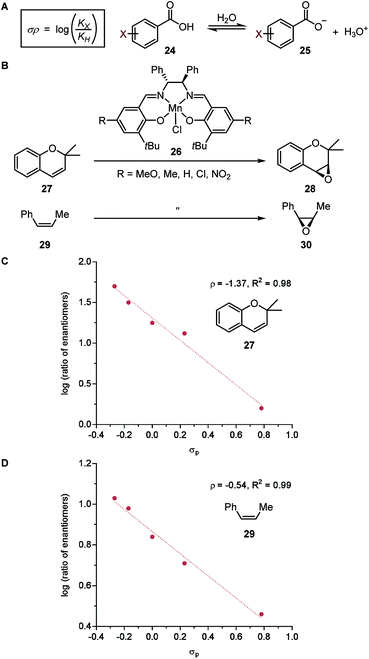 | ||
| Fig. 5 (A) Hammett parameter. (B) Enantioselective alkene epoxidation reactions. (C) LFER model for epoxidation of 2,2-dimethylchromene 27. (D) LFER model for epoxidation of cis-β-methylstyrene 29. | ||
In a seminal report, Jacobsen and coworkers demonstrated that the manganese-salen catalyst 26 was highly sensitive to the remote electronic influence of the para-substituents in the enantioselective alkene epoxidation (Fig. 5B).56 Depicted by a correlation between the logarithmic values of the enantiomeric products and σ, a pronounced trend was revealed where manganese-salen catalyst 26 with electron-donating para-substituents resulted in higher enantioselectivities in the epoxidation reaction of 2,2-dimethylchromene 27 (Fig. 5C) and cis-β-methylstyrene 29 (Fig. 5D). The aryl substituent presumably affects the reactivity of the Mn-oxo intermediates, wherein an electron-donating group generates a milder oxidant resulting in a comparatively late transition state and thus, higher enantioselectivity.57
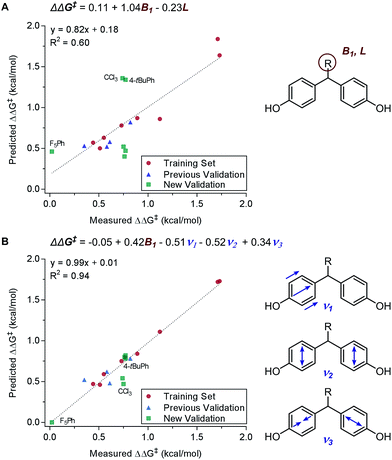
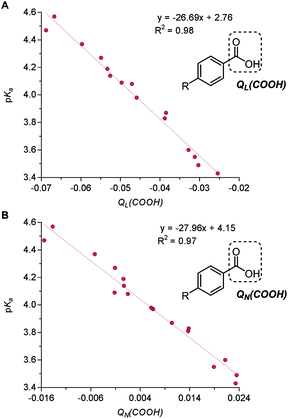
Principally, IR frequencies and intensities are considered to be stereoelectronic in nature as the molecular vibrational modes are directional changes dependent on mass and charge of the atoms in the molecule.60 Sigman and coworkers have extensively exploited the nature of IR frequencies and intensities in various case studies.19,61–66 As an example, the desymmetrization of bisphenol 3 was studied (Fig. 2A), wherein the Sterimol-MLR model failed to describe the enantioselectivity. Specifically, sterically bulky and electronically disparate bisphenol R substituents (CCl3, 4-tBuPh, and F5Ph) were shown to fail in the correlations (Fig. 6A).61 Through the employment of infrared-derived parameters from the bisphenol ring vibrations, steric and electronic effects were simultaneously depicted leading to improved validations (Fig. 6B).
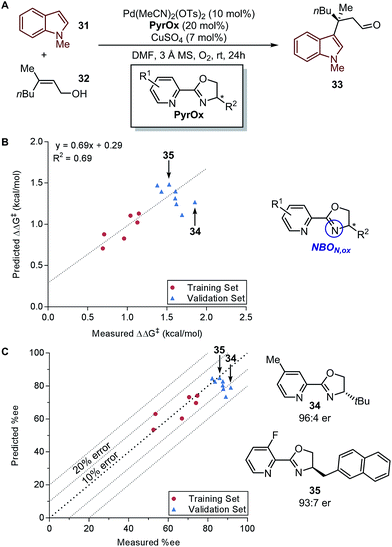
In a recent report by Zhang et al., the natural bond orbital charge of the oxazoline nitrogen (NBON,ox) in the pyridine-oxazoline (PyrOx) ligand was found to have a significant correlation with the enantioselectivity in a palladium-catalysed dehydrogenative Heck arylation reaction between indoles 31 and cis-alkenols 32 (Fig. 8A).71 Remote electronic effect was surveyed through varying the substitutions on the pyridine ring that modulates the NBON,ox. Virtual screening was carried out based on this finding to reveal a set of superior ligands (Fig. 8B), which were within reasonable %error in terms of %ee (Fig. 8C).
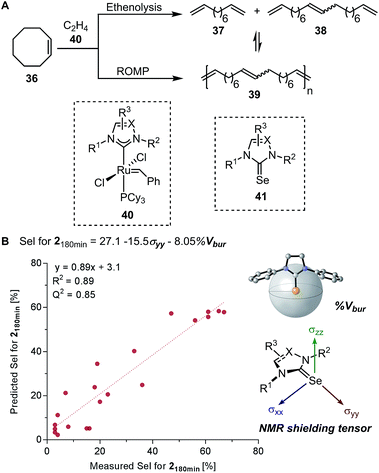
Based on the chemical shift anisotropy (CSA), the isotropic chemical shift (δiso) is a rank-2 tensor which is defined as the average of the principal components of the chemical shift tensor (δxx, δyy, and δzz).75,76 The directional information made accessible by the shielding tensor makes it a potentially more sophisticated molecular descriptor than the isotropic chemical shift. In 2008, Autschbach applied two-component (spin–orbit) relativistic density functional theory analysis method established on relativistic natural localized molecular orbitals (NLMOs) and natural bond orbitals (NBOs) to δ and shielding tensors.77–79 The extended application of this method, referred to as natural chemical shift (NCS) analysis, can indicate specific orbitals that have the highest impact on δ.80–82 Raynaud, Copéret, Eisenstein, and coworkers effectively utilized the NCS method via an orbital analysis of chemical shift tensors to identify precise fingerprints that distinguish between Fischer and Schrock carbenes.83 In a collaborative effort by Copéret, Sigman, and Togni groups on the study of ethenolysis of cis-cyclooctene 36 catalysed by a library of homologous [Ru–NHC] complexes 40 (Fig. 9A), the shielding tensor σyy component of the computed 77Selenium NMR chemical shift in [Se–NHC] complexes 41, adducts of [Ru–NHC] complexes, was found to be correlative with the selectivity for ethenolysis (Fig. 9B).84 Through NCS analysis, it was identified that the σyy chemical shielding tensor is a probe of the π-backbonding ability of the NHC ligand.
Multivariate model development workflow
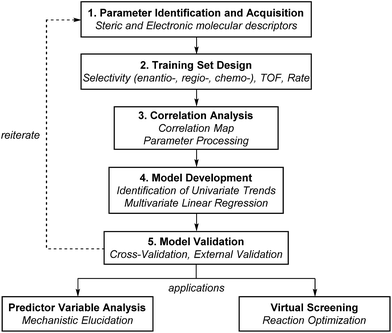
The general protocol to generate multidimensional descriptive models is shown in Fig. 12. In this process, the major components involved are (1) the identification and acquisition of relevant parameters; (2) the design of an initial set of data for model construction (i.e., the training set); (3) intercorrelation assessment; (4) preliminary model development involving identification of univariate trends and execution of multivariate linear regression; and (5) validation of multivariate models through cross- and external validation methods. Successful development of accurate, informative models should allow virtual screening to accelerate reaction optimization and predictor variable analysis to obtain mechanistic insights. In this section, a detailed guideline of each step for model construction and evaluation is provided.Parameter identification and acquisition
As discussed in the former section, a set of descriptive features needs to be selected and acquired, preferably from simulated structures with a well-balanced computational requirement and accuracy.91 Existing mechanistic knowledge of the reaction can guide parameter selection.Training set design
For the construction of generalizable, unbiased models,92–94 which are aimed at making accurate predictions for a range of molecules with considerable variations, instead of explaining only the data at hand, it is common to divide the acquired experimental data into two sets: a training set, which is used for model construction, and an external validation set, which is necessary for verification of the generated models.95–97 This arrangement allows for an efficient evaluation of model generalizability.However, for the development of catalytic systems, in most cases, the number of observations may be quite limited (less than a hundred) by a statistical standard. Consequently, the modelling outcome can be highly dependent on the selected set for model training. Thus, the training set should be designed carefully to represent the entire poll of choices for the system under study. The selection of structurally diverse and well-distributed samples that encompass a wide range of reaction outcomes is a key element in training set design, which is crucial for the resulting models to be generalizable towards structural variations and relative accuracy in extrapolation.98 Countering the intuition of looking for the best possible results, the entries with low performance are equally important in this operation.11
Training set design requirements can be met in multiple ways. The first option is to base the selection on the knowledge of chemical structure, which though not quantitative, would be intuitive for a trained chemist, and is generally effective for modular structures.99 The second method is to perform a D-optimal design100 on a set of relevant parameters,101,102 which aims for maximum coverage of the sample space, as briefly demonstrated by Bess et al. in their analysis of the enantioselective NHK propargylation of alkyl ketones, where the training set was designed based on the evaluation of the presumed most important steric and electronic parameters.103 This method requires the front-end construction of a large virtual library, the corresponding comprehensive parameter set, and an initial guess of the relevant, influential parameters based on chemical knowledge and mechanistic speculation. This option is especially suited for model-guided screening where the collection of experimental results arise from the training set design, similar to the Design of Experiments (DoE) process.104 The third option, in contrast, is suited when modelling is performed at a late stage of screening, which involves selecting the data that provide a large span of well-distributed response values from a completed and relatively extensive preliminary screen.11
Parameter analysis and processing
Proper parameter refinement can help simplify and improve the model interpretation.105 A preliminary necessary operation is parameter normalization, which is conventionally performed using eqn (1), where the mean is subtracted from the sample and then the resulting value is divided by the standard deviation.106 This procedure allows all parameters to possess the same scale and deviation, so that the coefficients in multivariate linear regression models are reflective of the variance accounted for by each parameter. | (1) |
A parameter intercorrelation analysis through visualization of correlation matrices is highly desirable for several reasons. First of all, as the physical meaning of some parameters (e.g., structural features) is unclear, it is beneficial to benchmark them against well-defined, experimentally-derived descriptors. Secondly, multicollinearity, where parameters have significant intercorrelations with each other, should preferably be avoided in multivariate correlations.107–109 When highly intercorrelated parameters coexist in the same model, the effective variance becomes associated with the difference between parameters. This causes the random noise in descriptor values to be amplified. Furthermore, the coefficient values can be erroneous, which damages the reliability of the model. As a result, it is vital to perform an intercorrelation analysis which helps avoid such collinear parameter selection. In a recent report by Guo et al., a correlation map, an initial step in principal component analysis (PCA),110 was effectively utilized as a visualization tool to identify intercorrelations between parameters.99
If the study is entirely extrapolation-oriented, and the parameter set is considerable in size, a PCA is highly recommended.110–113 Such process analyzes the variation of the original parameter set, which then creates a new set of orthogonal parameters that can typically account for the vast majority of the variance with a considerably smaller number of parameters. This analysis is extensively applied to reduce dimensionality, which significantly improves the modelling efficiency as well as diminishes the concern for collinearity. However, it is not recommended if a mechanistically informative model is desired, as the reconstructed orthogonal parameters have less obvious meaning, and the resulting models can be difficult to interpret.
Notably, with the data being divided into training and validation sets, the standard for parameter processing (e.g., means, standard deviations, and principal component directions) should all be established by the training set, with the validation set being processed accordingly, so that the external validation data does not directly impact the model composition.
Subset design and univariate correlations
It is necessary to identify impactful features at an early stage of data analysis, which can be achieved through univariate correlation analysis on data subsets, where ideally, structures bearing significant similarities with each other provide a singular characteristic to be interrogated.99,114 The most relevant features identified through single-parameter analysis are not always directly applicable in the construction of multivariate models. However, apart from demonstrating the general trends, when combined with the intercorrelation analysis, univariate models can aid in interpreting the occasionally complicated comprehensive models.Preliminary multivariate model construction
This section is dedicated to the construction of a linear regression model on the basis of a free energy relationship analysis. Other statistical methods that are also effective for quantitative analysis yet less applied in the analysis of catalytic systems, such as random forest115,116 and artificial neural network,117–119 are not discussed in this review.Least-squares linear regression by forward feature selection120,121 is a common method for model construction. Starting from either a constant term, or an initial guess of the model containing the presumed relevant parameters, this method evaluates the change in statistics caused by addition/removal of each parameter, and incorporates the most consequential term at each step, until no significant improvement can be found. Backward feature elimination has also been applied in several cases,11,61 where all parameters will be incorporated in the model at the beginning, and the algorithm reduces the variables by removing the insignificant terms.
The employment of weighted least squares, where the entries are not all treated equally but are instead weighted based on certain criteria, can also be desirable. For example, in extrapolative modelling of a system aimed at a highly enantioselective as well as high yielding process, where the accuracy is emphasized in the overall high-performance region, a yield/TOF-based weighting can be applied to the enantioselectivity model, so that the low-yielding reactions are considered less important. Another application of weighted least squares is that, in cases where the system is suspected to be plagued by a few outliers, the iteratively reweighted least squares (IRLS),122 where each entry is weighted based on its residual error, can be very useful in eliminating the influence of the outliers.
To avoid overfitting,123 where the model tries to explain all the random noise in the training set and makes it specific towards the training set with poor generalizability, the number of descriptors should be limited (empirically less than 1/3 of the number of entries).124 Furthermore, the following methods can be employed to validate the model.
Model evaluation and optimization
Cross-validation and external validation are the most common methods for model verification. Both can be employed to test for the generalizability of the model. Cross-validation is performed internally on the training set, where part of the data is excluded and predicted based on a model with the same parameter combination reconstructed from the remaining set of data.95,96,125,126 The prediction accuracy can then indicate the stability and generalizability of the models. Leave-one-out cross-validation, where each point in the training set is removed and tested individually, is the only type which would provide a constant result, depicted as Q2, which is used as a common statistical measure.127 For other cross-validation options, it is common to average the results from multiple runs.External validation, in contrast, deploys an additional set of data separated from the training set, whose empirical results are known before model development. The validation data set is often considered to be in between the training set, which is used for model construction, and test set, for which the prediction comes before the experimental results. It allows for a convenient evaluation of both the generalizability of the model, and the design of the training set.97 Ideally, provided an aptly orchestrated training set, it is adequate to adopt the rest of the existing data as external validations, despite the ratio of the two sets of data. Otherwise, with a rather random training/validation partition, the results could resemble a cross-validation within the entire dataset.
As a side note, multiple techniques have been developed to modify and improve the prediction accuracy of least squares regression models. For instance, LASSO regression, the restricted least squares method where coefficients for some parameters are reduced or set to zero, is used to decrease the prediction variance with slight sacrifice of model bias. Furthermore, the interpretability of models may also improve as a result of parameter elimination128
It is important to note that the standard for model evaluation would change based on the primary goal of the study. For purely extrapolative modelling, accuracy and generalizability are imperative, while complexity and obscurity of the models are not considered vital flaws. Conversely, for mechanistically informative modelling, high statistical measures sometimes have to give way to simplicity and interpretability, in which case reasonably reliable models composed of a small number of parameters with clear physical meaning can be more preferable over complicated models comprised with a large number of parameters including exponential and cross terms, albeit better performance of the latter.129,130 Additionally, for mechanistically-driven studies, the parameters should not be strongly interdependent, even with acceptable levels of noise amplification. The reason being that in such cases, the consequential features involved would be the differences between the parameters instead of the features described by any of them, leaving the models difficult to interpret.
Model failures and solutions
It is not an uncommon scenario where no satisfactory model can be found. Listed here are some typical causes for model failure and possible solutions.Model applications
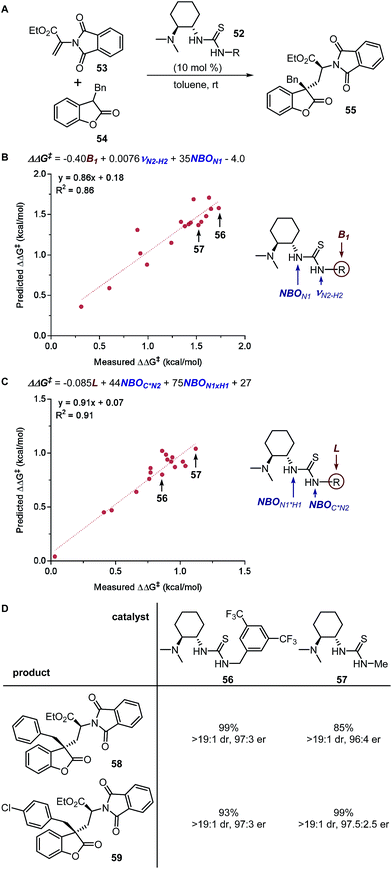
To demonstrate the application of this modelling approach, two case studies will be discussed. In the first study, the MLR model was developed to identify a better performing catalyst while in the second example, the model was constructed to interrogate the mechanism and distinguish the underlying NCIs involved in the reaction.Virtual screening
Virtual screening is the classical application of reliable quantitative models.30 From an experimental standpoint, the practicality of synthesis and commercial availability of starting materials must be taken into consideration when designing the virtual screening deck. Notably, the structures to be evaluated should be within the generalizable region of the models where the molecular structures bear similarity with certain entries in the training set, as critical changes unaccounted for in the training set could lead to prediction failure. Remarkably, it has been observed that averaging the predictions from multiple reliable models can help improve the accuracy of estimations.13Predictor variable analysis
Mechanistic interpretation of the relevant parameters used as predictor variables in the models is a less common, yet highly advantageous application of the molecular-feature-based models. In addition to providing a mechanistic rationale for the observed chemical phenomenon, such analysis can efficiently guide virtual screening towards a more focused, smaller library of simulated structures. However, it is noteworthy that mechanistic interrogation based on predictor variable analysis can only be successfully performed if there is already a prior hypothesis for the reaction mechanism. Due to the unavoidable interrelationship between parameters, multiple statistically satisfactory models, where parameters can be substituted for each other, can be attained. Typically, models that consist of parameters with discernible physical meaning or correspond with existing mechanistic information are selected for further validation.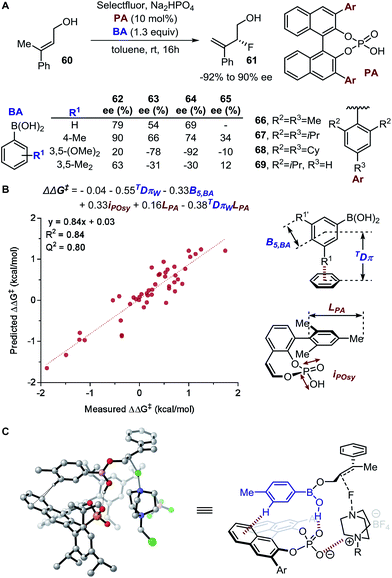 | ||
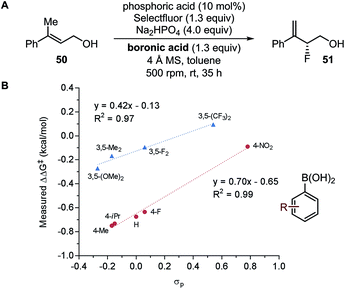
| Fig. 15 (A) Enantiodivergent fluorination of allylic alcohols. (B) Multivariate model of enantioselectivity. (C) Transition state analysis. | ||
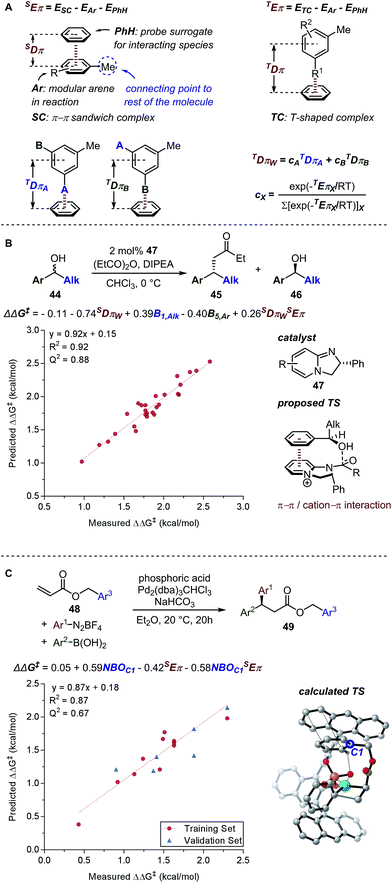
A computational transition state (TS) analysis was performed in order to clearly visualize the involved NCIs in the fluorination of allylic alcohols. As depicted in Fig. 15C, the T-shaped NCI indicated by the multivariate model was obtained from the DFT study of the transition state without intended pre-arrangement of structure. Additionally, analogous to the parameters obtained from the multivariate model, the BA meta-substituent and the PA binaphthyl moiety are involved in a T-shaped π interaction. Furthermore, the Dπw parameters obtained from the ground state calculations are consistent with the computed distances between the BA aryl ring and PA binaphthyl moiety observed in the TS.
Conclusions
In summary, multivariate linear regression models utilizing physical organic molecular descriptors were demonstrated to be effective towards their application in virtual screening and mechanistic interrogation. Compelling reports that executed virtual screening led to acceleration of reaction optimization. Mechanistic interpretation of the structural meaning of these relevant parameters has contributed to the analysis of the observed chemical phenomenon. We hope that the presented detailed modern MLR model development protocol will serve as a guide for utilization of this approach.Conflicts of interest
The authors declare no conflict of interest.Acknowledgements
This effort and associated research was supported by the NSF (CHE-1361296), the Joint Center for Energy Storage Research (JCESR) a Department of Energy, Energy Innovation Hub, and the NIH (1 R01 GM121383). The support and resources from the Center for High Performance Computing at the University of Utah are gratefully acknowledged.Notes and references
- M. T. Reetz, Angew. Chem., Int. Ed., 2002, 41, 1335 CrossRef CAS PubMed.
- R. Carlson, Design and Optimization in Organic Synthesis, Elsevier, Amsterdam, 1992 Search PubMed.
- A. B. Santanilla, E. L. Regalado, T. Pereira, M. Shevlin, K. Bateman, L.-C. Campeau, J. Schneeweis, S. Berritt, Z.-C. Shi, P. Nantermet, Y. Liu, R. Helmy, C. J. Welch, P. Vachal, I. W. Davies, T. Cernak and S. D. Dreher, Science, 2015, 347, 49 CrossRef PubMed.
- M. R. Friedfeld, M. Shevlin, J. M. Hoyt, S. W. Krska, M. T. Tudge and P. J. Chirik, Science, 2013, 342, 1076 CrossRef CAS PubMed.
- K. D. Collins, T. Gensch and F. Glorius, Nat. Chem., 2014, 6, 859 CrossRef CAS PubMed.
- D. W. Robbins and J. F. Hartwig, Science, 2011, 333, 1423 CrossRef CAS PubMed.
- J. M. Brown and R. J. Deeth, Angew. Chem., Int. Ed., 2009, 48, 4476 CrossRef CAS PubMed.
- M. S. Sigman, K. C. Harper, E. N. Bess and A. Milo, Acc. Chem. Res., 2016, 49, 1292 CrossRef CAS PubMed.
- K. C. Harper and M. S. Sigman, Proc. Natl. Acad. Sci. U. S. A., 2011, 108, 2179 CrossRef CAS PubMed.
- K. C. Harper and M. S. Sigman, Science, 2011, 333, 1875 CrossRef CAS PubMed.
- A. Milo, A. J. Neel, F. D. Toste and M. S. Sigman, Science, 2015, 347, 737 CrossRef CAS PubMed.
- M. C. Kozlowski, S. L. Dixon, M. Panda and G. Lauri, J. Am. Chem. Soc., 2003, 125, 6614 CrossRef CAS PubMed.
- J. C. Ianni, V. Annamalai, P.-W. Phuan, M. Panda and M. C. Kozlowski, Angew. Chem., 2006, 118, 5628 CrossRef.
- P. J. Donoghue, P. Helquist, P.-O. Norrby and O. Wiest, J. Am. Chem. Soc., 2008, 131, 410 CrossRef PubMed.
- E. Hansen, A. R. Rosales, B. Tutkowski, P. O. Norrby and O. Wiest, Acc. Chem. Res., 2016, 49, 996 CrossRef CAS PubMed.
- K. B. Lipkowitz, T. Sakamoto and J. Stack, Chirality, 2003, 15, 759 CrossRef CAS PubMed.
- E. Burello, P. Marion, J.-C. Galland, A. Chamard and G. Rothenberg, Adv. Synth. Catal., 2005, 347, 803 CrossRef CAS.
- K. N. Houk and P. H. Cheong, Nature, 2008, 455, 309 CrossRef CAS PubMed.
- V. Mougel, C. B. Santiago, P. A. Zhizhko, E. N. Bess, J. Varga, G. Frater, M. S. Sigman and C. Copéret, J. Am. Chem. Soc., 2015, 137, 6699 CrossRef CAS PubMed.
- E. Burello, D. Farrusseng and G. Rothenberg, Adv. Synth. Catal., 2004, 346, 1844 CrossRef CAS.
- C. S. Sevov, D. P. Hickey, M. E. Cook, S. G. Robinson, S. Barnett, S. D. Minteer, M. S. Sigman and M. S. Sanford, J. Am. Chem. Soc., 2017, 139, 2924 CrossRef CAS PubMed.
- K. Wu and A. G. Doyle, Nat. Chem., 2017, 9, 779 CrossRef CAS PubMed.
- P. S. Kutchukian, J. F. Dropinski, K. D. Dykstra, B. Li, D. A. DiRocco, E. C. Streckfuss, L.-C. Campeau, T. Cernak, P. Vachal, I. W. Davies, S. W. Krska and S. D. Dreher, Chem. Sci., 2016, 7, 2604 RSC.
- A. R. Katritzky and V. S. Lobanov, Chem. Soc. Rev., 1995, 24, 279 RSC.
- A. Cherkasov, E. N. Muratov, D. Fourches, A. Varnek, I. I. Baskin, M. Cronin, J. Dearden, P. Gramatica, Y. C. Martin, R. Todeschini, V. Consonni, V. E. Kuz'min, R. Cramer, R. Benigni, C. Yang, J. Rathman, L. Terfloth, J. Gasteiger, A. Richard and A. Tropsha, J. Med. Chem., 2014, 57, 4977 CrossRef CAS PubMed.
- C. Hansch and A. Leo, Exploring QSAR: Fundamentals and Applications in Chemistry and Biology, American Chemical Society, 1995 Search PubMed.
- P. Polishchuk, J. Chem. Inf. Model., 2017, 57, 2618 CrossRef CAS PubMed.
- R. Todeschini and V. Consonni, Handbook of Molecular Descriptors, WILEY-VCH, 2000 Search PubMed.
- J. A. Hageman, J. A. Westerhuis, H.-W. Frühauf and G. Rothenberg, Adv. Synth. Catal., 2006, 348, 361 CrossRef CAS.
- A. G. Maldonado and G. Rothenberg, Chem. Soc. Rev., 2010, 39, 1891 RSC.
- L. P. Hammett, Chem. Rev., 1935, 17, 125 CrossRef CAS.
- L. P. Hammett, J. Am. Chem. Soc., 1937, 59, 96 CrossRef CAS.
- L. P. Hammett, Trans. Faraday Soc., 1938, 34, 156 RSC.
- H. H. Jaffe, Chem. Rev., 1953, 53, 191 CrossRef CAS.
- C. Hansch, A. Leo and R. W. Taft, Chem. Rev., 1991, 91, 165 CrossRef CAS.
- R. W. Taft Jr, J. Am. Chem. Soc., 1952, 72, 2729 CrossRef.
- T. Fujita, J. Iwasa and C. Hansch, J. Am. Chem. Soc., 1964, 86, 5175 CrossRef CAS.
- M. Charton, J. Am. Chem. Soc., 1975, 97, 1552 CrossRef CAS.
- A. Verloop, in Drug Design, Academic Press, New York, 1976 Search PubMed.
- C. A. Tolman, Chem. Rev., 1977, 77, 313 CrossRef CAS.
- A. C. Hillier, W. J. Sommer, B. S. Yong, J. L. Petersen, L. Cavallo and S. P. Nolan, Organometallics, 2003, 22, 4322 CrossRef CAS.
- P. W. N. M. van Leeuwen, P. C. J. Kamer, J. N. H. Reek and P. Dierkes, Chem. Rev., 2000, 100, 2741 CrossRef CAS PubMed.
- N. Fey, J. N. Harvey, G. C. Lloyd-Jones, P. Murray, A. G. Orpen, R. Osborne and M. Purdie, Organometallics, 2008, 27, 1372 CrossRef CAS.
- K. C. Harper, E. N. Bess and M. S. Sigman, Nat. Chem., 2012, 4, 366 CrossRef CAS PubMed.
- J. L. Gustafson, M. S. Sigman and S. J. Miller, Org. Lett., 2010, 12, 2794 CrossRef CAS PubMed.
- H. Huang, H. Zong, G. Bian and L. Song, J. Org. Chem., 2012, 77, 10427 CrossRef CAS PubMed.
- H. Huang, H. Zong, G. Bian, H. Yue and L. Song, J. Org. Chem., 2014, 79, 9455 CrossRef CAS PubMed.
- H. Huang, H. Zong, B. Shen, H. Yue, G. Bian and L. Song, Tetrahedron, 2014, 70, 1289 CrossRef CAS.
- A. Gomez-Suarez, D. J. Nelson and S. P. Nolan, Chem. Commun., 2017, 53, 2650 RSC.
- H. Clavier and S. P. Nolan, Chem. Commun., 2010, 46, 841 RSC.
- A. Poater, B. Cosenza, A. Correa, S. Giudice, F. Ragone, V. Scarano and L. Cavallo, Eur. J. Inorg. Chem., 2009, 1759 CrossRef CAS.
- L. Falivene, R. Credendino, A. Poater, A. Petta, L. Serra, R. Oliva, V. Scarano and L. Cavallo, Organometallics, 2016, 35, 2286 CrossRef CAS.
- T. Piou, F. Romanov-Michailidis, M. Romanova-Michaelides, K. E. Jackson, N. Semakul, T. D. Taggart, B. S. Newell, C. D. Rithner, R. S. Paton and T. Rovis, J. Am. Chem. Soc., 2017, 139, 1296 CrossRef CAS PubMed.
- G. Occhipinti, H. Bjørsvik and V. R. Jensen, J. Am. Chem. Soc., 2006, 128, 6952 CrossRef CAS PubMed.
- E. Picazo, K. N. Houk and N. K. Garg, Tetrahedron Lett., 2015, 56, 3511 CrossRef CAS PubMed.
- E. N. Jacobsen, W. Zhang and M. L. Güler, J. Am. Chem. Soc., 1991, 113, 6704 CrossRef.
- M. Palucki, N. S. Finney, P. J. Pospisil, M. L. Güler, T. Ishida and E. N. Jacobsen, J. Am. Chem. Soc., 1998, 120, 948 CrossRef CAS.
- R. N. Jones, W. F. Forbes and W. A. Mueller, Can. J. Chem., 1957, 35, 504 CrossRef CAS.
- D. H. McDaniel and H. C. Brown, J. Org. Chem., 1958, 23, 420 CrossRef CAS.
- J. Coates, in Encyclopedia of Analytical Chemistry, ed. R. A. Meyers, John Wiley & Sons Ltd, Chichester, 2000, p. 10815 Search PubMed.
- A. Milo, E. N. Bess and M. S. Sigman, Nature, 2014, 507, 210 CrossRef CAS PubMed.
- Z. L. Niemeyer, A. Milo, D. P. Hickey and M. S. Sigman, Nat. Chem., 2016, 8, 610 CrossRef CAS PubMed.
- C. B. Santiago, A. Milo and M. S. Sigman, J. Am. Chem. Soc., 2016, 138, 13424 CrossRef CAS PubMed.
- E. N. Bess, D. M. Guptill, H. M. L. Davies and M. S. Sigman, Chem. Sci., 2015, 6, 3057 RSC.
- Z. M. Chen, M. J. Hilton and M. S. Sigman, J. Am. Chem. Soc., 2016, 138, 11461 CrossRef CAS PubMed.
- D. P. Hickey, D. A. Schiedler, I. Matanovic, P. V. Doan, P. Atanassov, S. D. Minteer and M. S. Sigman, J. Am. Chem. Soc., 2015, 137, 16179 CrossRef CAS PubMed.
- K. C. Gross, P. G. Seybold and C. M. Hadad, Int. J. Quantum Chem., 2002, 90, 445 CrossRef CAS.
- C. A. Hollingsworth, P. G. Seybold and C. M. Hadad, Int. J. Quantum Chem., 2002, 90, 1396 CrossRef CAS.
- S. Winstein and N. J. Holness, J. Am. Chem. Soc., 1955, 77, 5562 CrossRef CAS.
- P. E. Gormisky and M. C. White, J. Am. Chem. Soc., 2013, 135, 14052 CrossRef CAS PubMed.
- C. Zhang, C. B. Santiago, J. M. Crawford and M. S. Sigman, J. Am. Chem. Soc., 2015, 137, 15668 CrossRef CAS PubMed.
- J. A. Pople, W. G. Schneider and H. J. Bernstein, High Resolution Nuclear Magnetic Resonance, McGraw-Hill, 1959 Search PubMed.
- C. P. Slichter, Principles of Magnetic Resonance, Harper & Row Publishers, New York, 1963 Search PubMed.
- K. Chen and P. S. Baran, Nature, 2009, 459, 824 CrossRef CAS PubMed.
- H. Saito, I. Ando and A. Ramamoorthy, Prog. Nucl. Magn. Reson. Spectrosc., 2010, 57, 181 CrossRef CAS PubMed.
- J. C. Facelli, Prog. Nucl. Magn. Reson. Spectrosc., 2011, 58, 176 CrossRef CAS PubMed.
- J. Autschbach, J. Chem. Phys., 2008, 128, 164112 CrossRef PubMed.
- J. Autschbach and S. Zheng, Magn. Reson. Chem., 2008, 46, S45 CrossRef PubMed.
- F. Aquino, B. Pritchard and J. Autschbach, J. Chem. Theory Comput., 2012, 8, 598 CrossRef CAS PubMed.
- S. Halbert, C. Copéret, C. Raynaud and O. Eisenstein, J. Am. Chem. Soc., 2016, 138, 2261 CrossRef CAS PubMed.
- C. P. Gordon, K. Yamamoto, W. C. Liao, F. Allouche, R. A. Andersen, C. Copéret, C. Raynaud and O. Eisenstein, ACS Cent. Sci., 2017, 3, 759 CrossRef CAS PubMed.
- D. Marchione, M. A. Izquierdo, G. Bistoni, R. W. A. Havenith, A. Macchioni, D. Zuccaccia, F. Tarantelli and L. Belpassi, Chem.–Eur. J., 2017, 23, 2722 CrossRef CAS PubMed.
- K. Yamamoto, C. P. Gordon, W. C. Liao, C. Copéret, C. Raynaud and O. Eisenstein, Angew. Chem., Int. Ed., 2017, 56, 10127 CrossRef CAS PubMed.
- P. S. Engl, C. B. Santiago, C. P. Gordon, W. C. Liao, A. Fedorov, C. Copéret, M. S. Sigman and A. Togni, J. Am. Chem. Soc., 2017, 139, 13117 CrossRef CAS PubMed.
- R. R. Knowles and E. N. Jacobsen, Proc. Natl. Acad. Sci. U. S. A., 2010, 107, 20678 CrossRef CAS PubMed.
- A. J. Neel, M. J. Hilton, M. S. Sigman and F. D. Toste, Nature, 2017, 543, 637 CrossRef CAS PubMed.
- F. D. Toste, M. S. Sigman and S. J. Miller, Acc. Chem. Res., 2017, 50, 609 CrossRef CAS PubMed.
- S. E. Wheeler and K. N. Houk, J. Am. Chem. Soc., 2008, 130, 10854 CrossRef CAS PubMed.
- M. Orlandi, J. A. S. Coelho, M. J. Hilton, F. D. Toste and M. S. Sigman, J. Am. Chem. Soc., 2017, 139, 6803 CrossRef CAS PubMed.
- M. Orlandi, M. J. Hilton, E. Yamamoto, F. D. Toste and M. S. Sigman, J. Am. Chem. Soc., 2017, 139, 12688 CrossRef CAS PubMed.
- E. G. Lewars, Computational Chemistry: Introduction to the Theory and Applications of Molecular and Quantum Mechanics, Springer, Netherlands, 2011 Search PubMed.
- E. W. Steyerberg, F. E. Harrell Jr, G. J. J. M. Borsboom, M. J. C. Eijkemans, Y. Vergouwe and J. D. F. Habbema, J. Clin. Epidemiol., 2001, 54, 774 CrossRef CAS PubMed.
- B. D. Ripley and M. Thompson, Analyst, 1987, 112, 377 RSC.
- J. H. Morris and J. D. Sherman, Acad. Manag. J., 1981, 24, 512 CrossRef.
- A. Tropsha, P. Gramatica and V. K. Gombar, QSAR Comb. Sci., 2003, 22, 69 CAS.
- P. Gramatica, QSAR Comb. Sci., 2007, 26, 694 CAS.
- V. Consonni, D. Ballabio and R. Todeschini, J. Chemom., 2010, 24, 194 CrossRef CAS.
- L. Eriksson, J. Jaworska, A. P. Worth, M. T. D. Cronin, R. M. McDowell and P. Gramatica, Environ. Health Perspect., 2003, 111, 1361 CrossRef CAS PubMed.
- J.-Y. Guo, Y. Minko, C. B. Santiago and M. S. Sigman, ACS Catal., 2017, 7, 4144 CrossRef CAS.
- P. F. de Aguiar, B. Bourguignon, M. S. Khots, D. L. Massart and R. Phan-Than-Luu, Chemom. Intell. Lab. Syst., 1995, 30, 199 CrossRef.
- D. E. Patterson, R. D. Cramer, A. M. Ferguson, R. D. Clark and L. E. Weinberger, J. Med. Chem., 1996, 39, 3049 CrossRef CAS PubMed.
- D. M. Roberge, Org. Process Res. Dev., 2004, 8, 1049 CrossRef CAS.
- E. N. Bess, A. J. Bischoff and M. S. Sigman, Proc. Natl. Acad. Sci. U. S. A., 2014, 111, 14698 CrossRef CAS PubMed.
- J. C. Spall, IEEE Contr. Syst. Mag., 2010, 30, 38 CrossRef.
- R. Kiralj and M. M. C. Ferreira, J. Chemom., 2010, 24, 681 CrossRef CAS.
- D. W. Marquardt, J. Am. Stat. Assoc., 1980, 75, 87 Search PubMed.
- D. E. Farrar and R. R. Glauber, Rev. Econ. Stat., 1967, 92 CrossRef.
- B. K. Slinker and S. A. Glantz, Am. J. Physiol.: Regul., Integr. Comp. Physiol., 1985, 249, R1 CrossRef CAS PubMed.
- N. J. Salkind, Encyclopedia of Measurement and Statistics, Sage Publications, Inc., Thousand Oaks, California, United States, 2007 Search PubMed.
- B. C. Moore, IEEE Trans. Autom. Control, 1981, 26, 17 CrossRef.
- I. T. Jolliffe, in Principal Component Analysis, Springer New York, New York, NY, 1986, p. 115 Search PubMed.
- S. Wold, K. Esbensen and P. Geladi, Chemom. Intell. Lab. Syst., 1987, 2, 37 CrossRef CAS.
- B. Haasdonk, M. Dihlmann and M. Ohlberger, Math. Comput. Model. Dyn. Syst., 2010, 423 Search PubMed.
- M. H. Keylor, Z. L. Niemeyer, M. S. Sigman and K. L. Tan, J. Am. Chem. Soc., 2017, 139, 10613 CrossRef CAS PubMed.
- L. Breiman, Mach. Learn., 2001, 45, 5 CrossRef.
- A. Liaw and M. Wiener, R. News, 2002, 2, 18 Search PubMed.
- T. Hill, L. Marquez, M. O'Connor and W. Remus, Int. J. Forecast., 1994, 10, 5 CrossRef.
- J. V. Tu, J. Clin. Epidemiol., 1996, 49, 1225 CrossRef CAS PubMed.
- S. Dreiseitl and L. Ohno-Machado, J. Biomed. Inf., 2002, 35, 352 CrossRef.
- Z. Bursac, C. H. Gauss, D. K. Williams and D. W. Hosmer, Source Code Biol. Med., 2008, 3, 17 CrossRef PubMed.
- R. B. Bendel and A. A. Afifi, J. Am. Stat. Assoc., 1977, 72, 46 Search PubMed.
- P. W. Holland and R. E. Welsch, Commun. Stat. Theor. Meth., 1977, 6, 813 CrossRef.
- D. M. Hawkins, J. Chem. Inf. Comput. Sci., 2004, 44, 1 CrossRef CAS PubMed.
- S. Wold and W. J. Dunn III, J. Chem. Inf. Comput. Sci., 1983, 23, 6 CrossRef CAS.
- S. Wold, Quant. Struct.-Act. Relat., 1991, 10, 191 CrossRef CAS.
- R. Kohavi, presented in part at the International Joint Conference on Artificial Intelligence (IJCAI), Montreal, Quebec, Canada, 1995 Search PubMed.
- A. Golbraikh and A. Tropsha, J. Mol. Graph. Model., 2002, 20, 269 CrossRef CAS PubMed.
- R. Tibshirani, J. R. Statist. Soc. B, 1996, 58, 267 Search PubMed.
- S. Rüping, Learning Interpretable Models, PhD thesis, der Universität Dortmund, 2006.
- Z. C. Lipton, presented in part at the ICML Workshop on Human Interpretability in Machine Learning (WHI), New York, NY, USA, 2016 Search PubMed.
- A. J. Neel, A. Milo, M. S. Sigman and F. D. Toste, J. Am. Chem. Soc., 2016, 138, 3863 CrossRef CAS PubMed.
- S. Tomić and B. Kojić-Prodić, J. Mol. Graph. Model., 2002, 21, 241 CrossRef.
- A. Golbraikh, E. Muratov, D. Fourches and A. Tropsha, J. Chem. Inf. Model., 2014, 54, 1 CrossRef CAS PubMed.
- C. Yang, E.-G. Zhang, X. Li and J.-P. Cheng, Angew. Chem., 2016, 128, 6616 CrossRef.
- C. Yang, J. Wang, Y. Liu, X. Ni, X. Li and J. P. Cheng, Chem.–Eur. J., 2017, 23, 5488 CrossRef CAS PubMed.
| This journal is © The Royal Society of Chemistry 2018 |




![[thin space (1/6-em)]](https://www.rsc.org/images/entities/char_2009.gif) :
:


