 Open Access Article
Ship in a bottle: confinement-promoted self-assembly†
Elkin
Lopez-Fontal
a,
Anna
Grochmal
a,
Tom
Foran
a,
Lilia
Milanesi
b and
Salvador
Tomas
 *a
*a
aInstitute of Structural and Molecular Biology, Department of Biological Sciences, School of Science, Birkbeck University of London, Malet Street, London WC1E 7HX, UK. E-mail: s.tomas@bbk.ac.uk
bSchool of Biological and Chemical Sciences, Queen Mary, University of London, Mile End Road, London E1 4NS, UK
First published on 7th December 2017
Abstract
Understanding self-assembly in confined spaces is essential to fully understand molecular processes in confined cell compartments and will offer clues on the behaviour of simple confined systems, such as protocells and lipid-vesicle based devices. Using a model system composed of lipid vesicles, a membrane impermeable receptor and a membrane-permeable ligand, we have studied in detail how compartmentalization modulates the interaction between the confined receptor and its ligand. We demonstrate that confinement of one of the building blocks stabilizes complex self-assembled structures to the extent that dilution leads, counterintuitively, to the formation of long range assemblies. The behaviour of the system can be explained by considering a confinement factor that is analogous, although not identical, to the effective molarity for intramolecular binding events. The confinement effect renders complex self-assembled species robust and persistent under conditions where they do not form in bulk solution. Moreover, we show that the formation of stable complex assemblies in systems compartmentalized by semi-permeable membranes does not require the prior confinement of all components, but only that of key membrane impermeable building blocks. To use a macroscopic analogy, lipid vesicles are like ship-in-a bottle constructs that are capable of directing the assembly of the confined ship following the confinement of a few key wooden planks. Therefore, we believe that the confinement effect described here would have played an important role in shaping the increase of chemical complexity within protocells during the first stages of abiogenesis. Additionally, we argue that this effect can be exploited to design increasingly efficient functional devices based on comparatively simple vesicles for applications in biosensing, nanoreactors and drug delivery vehicles.
Introduction
It has been postulated that the earliest living organisms came to life as metabolic networks were integrated with RNA-like molecules and with a lipid membrane that would provide the boundary of the system.1–4 The formation of these protocells required the pre-biotic evolution of fairly complex chemistry.5–8 There is evidence that lipid vesicles can promote the formation of complex molecules.9–14 For example, we and others have shown that condensation reactions, that are generally promoted by lipid vesicles,15 are especially favourable when reagents or simple catalysts are trapped inside the cavity of lipid vesicles.16,17 These studies focus on the modulation of covalent chemistry, but do not address the effect that confinement might have on the formation of reversible self-assembled species. Ranging from the formation of enzyme-substrate complexes to the assembly of large polymeric structures, such as actin filaments and microtubules, self-assembly phenomena take place in membrane-compartmentalized spaces, where they are regulated by a finely tuned, highly complex molecular machinery. Molecular crowding is acknowledged to play a role on the modulation of self-assembly processes that involve macromolecules.18,19 However, we have recently shown that the outcome of chemical reactions in the cavity of a lipid vesicle can be different than in the bulk in the absence of molecular crowding.17 We have attributed this observation to a confinement effect which arises from a combination of relatively large local concentration (but much lower than that which gives rise to molecular crowding effects) and the selective membrane permeability of the reagents. We hypothesise that this, non-crowding, confinement effect can impact all chemical events taking place in a small cavity delimited by a semi-permeable membrane. It would therefore play a role in modulating the formation and stability of self-assembled complexes held together by intermolecular interactions that are confined inside the aqueous cavity of a vesicle. A regulatory role for such an effect may be hard to pinpoint within the complexity of living cells. It is, however, likely to play a clearer role in regulating the behaviour of simpler, membrane bound compartmentalized systems, ranging from minimal models of cell membranes based on vesicles,20–22 simple protocells,23,24 vesicle-based nanoreactors,25,26 biosensors27 and drug delivery vehicles.28 An optimal understanding of the implications of this confinement effect will therefore both advance our understanding of proto-cell evolution and our ability to design responsive, vesicle based devices.To study self-assembly in the cavity of a lipid vesicle we have used a membrane-impermeable receptor based on a porphyrin molecule (porphyrin C, Fig. 1a).29 Favourable optical properties of the porphyrin moiety allow the monitoring of assembly events at very low concentrations. By confining only the receptor inside the cavity we are able to trigger assembly events by the addition of membrane-permeable ligands. This experimental design represents also a minimal model of communication between the vesicle cavity and the environment, where the presence of membrane permeable molecules modulate the assembly of the confined ones. We used lipid vesicles composed of egg-yolk phosphatidylcholine (EYPC), suspended in a phosphate buffer at pH 7.2 (see Materials and methods section in the ESI† for details).
Results and discussion
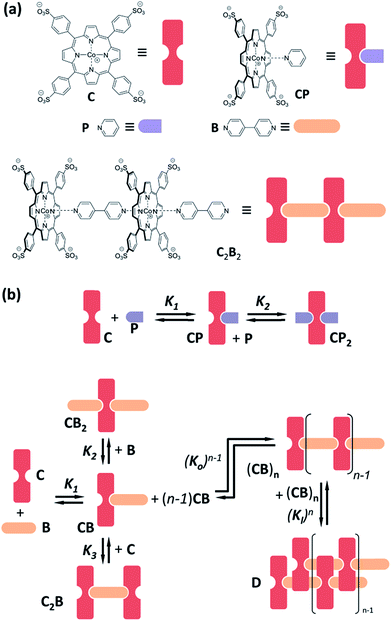
Cobalt metalloporphyrin C is water soluble and, in aqueous solution, forms complexes with pyridine derivatives by coordination of the metal centre with the basic nitrogen of the ligand (Fig. 1a). As we have recently reported,29,30 interaction with divalent bipyridine B leads to the formation of a variety of complexes of which C2B, CB, CB2 and double stranded polymer D dominate at different concentration ranges (Fig. 1b). In the present work we use bipyridine B and the monovalent reference ligand pyridine P which are both membrane permeable, to study the confinement effect (Fig. 1a). Membrane impermeable 3-pyridinesulphonic acid was used to experimentally corroborate that C does not permeate the lipid vesicle membrane in the timescale of days (see ESI Fig. S1 and S2 and associated discussion in the ESI† for details).Confinement effect on ligand binding
Monovalent ligand pyridine P interacts with C to form the 1![[thin space (1/6-em)]](https://www.rsc.org/images/entities/char_2009.gif) :
:![[thin space (1/6-em)]](https://www.rsc.org/images/entities/char_2009.gif) 1 complex CP and the 1
1 complex CP and the 1![[thin space (1/6-em)]](https://www.rsc.org/images/entities/char_2009.gif) :
:![[thin space (1/6-em)]](https://www.rsc.org/images/entities/char_2009.gif) 2 complex CP2 (Fig. 1b), as was confirmed by changes in the 1H-NMR spectrum of C upon addition of P (ESI Fig. S3†). This relatively simple behaviour makes P ideally suited to test whether the presence of lipids, or the confinement of C in the vesicle, influences the stability of the complex formed by coordination of the ligand with the metal centre. The stepwise binding constants K1 and K2 leading to complexes CP and CP2 were determined, by means of UV titration experiments, for both vesicle-confined and unconfined C (see Materials and methods section in the ESI† for details).
2 complex CP2 (Fig. 1b), as was confirmed by changes in the 1H-NMR spectrum of C upon addition of P (ESI Fig. S3†). This relatively simple behaviour makes P ideally suited to test whether the presence of lipids, or the confinement of C in the vesicle, influences the stability of the complex formed by coordination of the ligand with the metal centre. The stepwise binding constants K1 and K2 leading to complexes CP and CP2 were determined, by means of UV titration experiments, for both vesicle-confined and unconfined C (see Materials and methods section in the ESI† for details).
Changes in the UV spectra are fully consistent with the formation of the complexes CP and CP2, with an excellent fit to the corresponding binding model (Fig. 2, ESI Fig. S4†). UV spectral changes for unconfined and confined C are similar, the main difference being the higher baseline for the confined experiment due to the presence of the lipid vesicles (Fig. 2, ESI Fig. S5†). The value of K1 and K2 obtained from the fitting of the data is the same within the error of the measurement (Table 1). These experiments show that neither the presence of lipids nor the confinement have a measurable effect on the formation of the complexes formed by interaction of C and pyridine P.
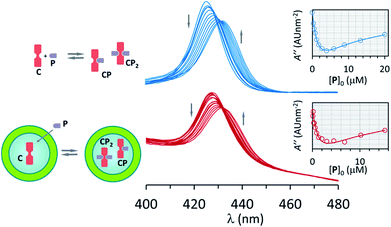 | ||
| Fig. 2 Top: changes in the UV spectrum of C upon addition of increasing amounts of P. The inset shows the fitting of the second derivative of the UV spectrum at 421 nm (empty circles) to a binding model that includes CP and CP2. The concentration of C was 2 μM. Bottom: idem for vesicle confined C. The concentration of EYPC lipid was 0.5 mM, that of C within the cavity was 1 mM and in relation to the bulk volume 2 μM. See Materials and methods and ESI Fig. S4 and S5 for details.† | ||
Polymer assembly for non-confined receptor
In contrast to P, binding of divalent bipyridine B to C gives rise to the formation of a variety of complexes. These include the discrete 1 to 1 and 1 to 2 complexes CB and CB2 (analogous to CP and CP2), the 2 to 1 complex C2B and short single stranded oligomers of the form (CB)n (Fig. 1). In the appropriate experimental conditions double stranded polymers D are also formed, following a nucleation-growth mechanism (Fig. 1b).29,30 In these conditions the single stranded form constitutes the nucleus for the double stranded polymer and does not accumulate. The formation of D gives rise to a red-shifted Soret band in the UV spectrum of the porphyrin moieties, making it possible to monitor polymerization with very small amounts of the building block C present. In addition to these favourable spectroscopic properties, samples of vesicle confined C, which is membrane impermeable, allow the self-assembly process to be triggered at will by simply adding the membrane permeable building block B. The stability of the species formed upon the addition of excess ligand can, too, be easily tested in these conditions. The system composed of C and B is therefore ideally suited to study the modulation of stability of supramolecular polymers in the confined aqueous cavity of lipid vesicles.The assembly properties of C and B in the absence of confinement have been recently studied in detail.29,30 For the current work the assembly experiments were carried out in the presence of lipid vesicles, with C either located in the bulk solution (that is, unconfined) or confined in the cavities of the vesicles. UV titration experiments carried out for unconfined C show that, for a sample of 18 μM C, double stranded polymer D is the predominant species when the concentration ratio of B over C is between 0.7 to 3 (Fig. 3). Larger excess of B leads to disassembly of the polymer and formation of the 1 to 2 complex CB2. The UV data fits well to the double stranded polymer assembly model previously described by us (Fig. 3, ESI Fig. S6A†).29,30
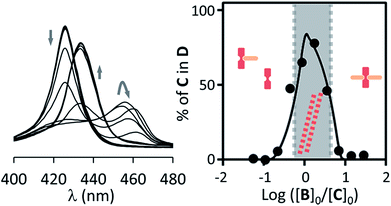 | ||
| Fig. 3 Left: changes in the Soret band region of the UV spectrum of C upon addition of increasing amounts of B for non-confined C (18 μM) in the presence of EYPC vesicles (1 mM). Right: changes in the percentage of C in the double stranded polymer D as the ratio of the concentration of B over C changes. The circles correspond to experimental values derived from the UV data shown and the continuous line to theoretical changes derived from the fitting of the data to our model.29,30 The dominant species at different concentration ranges is noted by the presence of its cartoon in the appropriate area. | ||
As shown by the studies of binding of C and P, the presence of lipids does not have a measurable impact on the stability of the complex between the ligand and the metal centre. Therefore, during the fitting procedure, the previously calculated values of K1, K2 and K3 were entered as known parameters. The driving force for the dimerization of the strands is the hydrophobic effect. It is therefore conceivable that the presence of lipid vesicles may have an effect on the value of the lateral association constant Kl. Kl was therefore the only binding parameter allowed to be adjusted during the fitting procedure (see ESI† for a detailed discussion on the implementation of the assembly model). Nevertheless, the value of Kl obtained is within the expected range of value for the ionic strength of our buffer, which has been previously calculated to be in the region of 104 M−1 (Table 1).30 It has to be noted that, for solutions containing vesicle-confined receptors, the concentration of the receptor C can be expressed in two ways: (i) in relation to the bulk solution volume and (ii) in relation to the membrane-confined volume. Since the confined volume for the vesicle suspensions used in our experiments is approximately a 0.2% of the total volume, the concentration in the confined volume is around 500 times larger than that referred to the bulk volume (see ESI† for detailed calculations). For example, a sample of confined C may have a concentration of C in relation to the bulk volume (referred to here as “apparent concentration”), [C]0, of 1.8 μM, while the local concentration of C within the cavities, termed [C]i0, is 1 mM. Thus, in order to study the confinement effect we use two reference non-confined samples. In one of them the concentration of C equals the apparent concentration in the confined experiment. In the other one the concentration of C is equal to the local concentration in the confined experiment.
For a solution of non-confined C with a concentration 1.8 μM (i.e., equal to the apparent concentration in a typical confinement experiment), titration with B leads to the formation of complexes CB and CB2 only, with no detectable polymer D (Fig. 4a). From the pairwise binding constants it is possible to calculate the nucleation concentration at which the polymer D starts to assemble.29 In our experimental conditions the critical nucleation concentration is calculated at 1.93 μM, which makes the absence of polymer at the lowest concentration consistent with the assembly model (see ESI† for details on the calculation of the nucleation concentration from the assembly model).
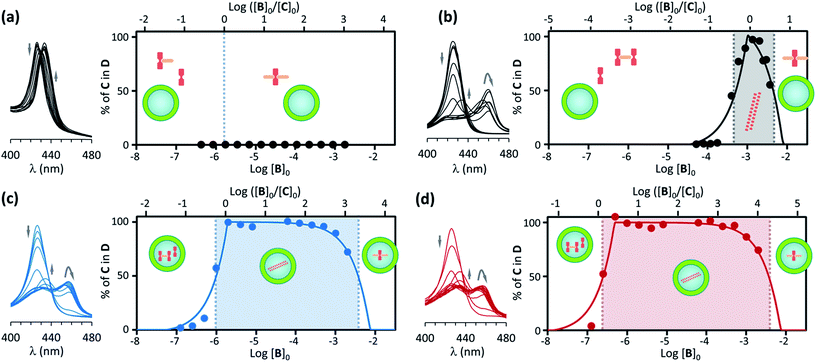 | ||
| Fig. 4 (a) Left: changes in the Soret band region of the UV spectrum of C upon addition of increasing amounts of B for non-confined C ([C]0 = 1.8 μM) in the presence of EYPC vesicles (500 μM). The arrows indicate the direction of spectral change. Right: changes in the percentage of C in the double stranded polymer D as the ratio of the concentration of B over C changes (top x axis) and as the total concentration of B in increases (bottom x axis). The circles correspond to experimental values derived from the UV data shown in the left and the continuous line to theoretical changes derived from the fitting of the data to the assembly model (see ESI† for details). The dominant species at different concentration ranges is noted by the presence of its cartoon in the appropriate area. (b) Idem for non-confined C, with [C]0 = 1 mM. (c) Idem, for C confined in the cavity of EYPC vesicles, with [C]0 = 1.8 μM, [EYPC] = 500 μM and total concentration of C in the cavity [C]i0 = 1 mM. (d) Idem to (c) for vesicle samples that have been diluted 4-fold (i.e., [C]0 = 0.45 μM, [EYPC] = 125 μM and total concentration of C in the cavity [C]i0 = 1 mM). | ||
For a solution of non-confined C 1 mM (i.e., equal to the local concentration of C in a typical confinement experiment) titration with B leads to the assembly of the polymer when the concentration of B approaches that of C, becoming the dominant species when the concentration of B is larger than 0.5 mM. The concentration of the polymer D starts decreasing in the presence of an excess of B (Fig. 4b, ESI Fig. 6B†). The behaviour of the system is therefore very similar to that in the experiment carried out at 18 μM of non-confined C (Fig. 3), with D being the dominant species in a narrow range of concentration of B.
Polymer assembly for confined receptor
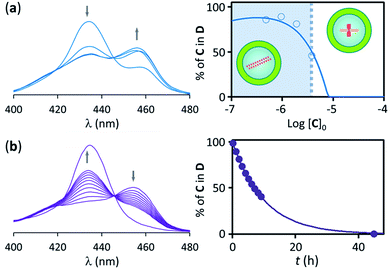
Samples of confined C where prepared using a buffer 1 mM on C. The concentration of C within the vesicle cavities was therefore initially assumed to be 1 mM. Calculations using total confined volume and the appropriate dilution factors are in agreement with this assumption (see ESI† for details). In the first set of experiments the concentration of C in relation to the bulk was 1.8 μM. In these conditions, addition of increasing amounts of B leads, first, to the formation of the polymer D, as shown by UV changes, when the ratio of concentrations comes close to 1, with D becoming the dominant species for a ratio [B]/[C] = 0.5 or above (that is, for a concentration of B above 0.9 μM). From this point of the titration onwards D remains the dominant species up to a concentration of B above 2 mM, which corresponds to an excess of B approximately 1800 in relation to C (Fig. 4b). The wide range of conditions in which D is the dominant species is further expanded if the experiment is repeated using a more dilute vesicle suspension. Thus, if the sample of vesicles is diluted 4 fold, D becomes the dominant species at the same ratio B/C than for the earlier experiment, but now corresponding to a concentration of B 4-fold smaller (i.e. [B]0 = 0.22 μM). As the concentration of B increases D remains the dominant species up to the same concentration of B than for the earlier experiment, but corresponding now to an excess of 7200 in relation to C (that is, 4-fold larger excess than in the earlier experiment) (Fig. 4c). What is observed is that, counter-intuitively, dilution of the sample stabilizes the assembly, broadening the range of conditions at which D is the dominant species (Fig. 4d).These experiments appear to show that dilution encourages polymer assembly for confined C. The polymerization-upon-dilution effect was confirmed by diluting a sample of confined C. The sample, with an apparent concentration of C of 4 μM and a concentration of B of 3 mM showed only partial polymerization (Fig. 5a). Upon dilution with buffer the UV spectra revealed re-assembly of the polymer, which became the dominant species again (Fig. 5a).
To directly test the role of confinement on this outcome, a sample of vesicle confined polymer was treated with detergent. The UV spectra recorded after the addition of detergent are consistent with polymer disassembly upon extensive membrane disruption (Fig. 5b). Moreover, cryo-TEM experiments carried out on samples containing C-loaded vesicles show that the vesicles integrity is maintained upon addition of excess of B (ESI Fig. S7†).
To summarize these results, and comparing with the reference experiment carried out at the apparent concentration of C (Fig. 4a and c), what we have seen is that when a given number of moles of C, insufficient to lead to polymerization in bulk solution, are confined within the cavity of lipid vesicles polymers assemble and remain the dominant species in a wide range of experimental conditions. Thus, for non-confined C, less than a 10 fold excess of ligand over C leads to polymer disassembly (under concentration conditions where it forms, see Fig. 3), but for confined C the excess necessary for disassembly is above 1000. Also, when C is non-confined, the polymer disassembles upon dilution below the nucleation concentration (Fig. 4a and b). By contrast, when C is confined, dilution of the sample can lead to re-assembly of the polymer (Fig. 5a). Clearly, confinement of C within the vesicles results on a large local concentration of C in the cavity of these vesicles. However, the behaviour of the confined C is not duplicated when the experiment is carried out with non-confined C at a concentration similar to that within the vesicles. Instead, what we see is that the polymer does form, but it is the dominant species only in the narrow range of conditions when the concentration of B is similar to that of C (Fig. 4b and c).
In principle, these observations can be attributed to 2 factors: changes in the pairwise binding constant for confined C, or an effect related to the local concentration within the vesicle. The experiments carried out with pyridine P show that the binding constants that depend on the coordination with the metal centre are not affected by confinement. It is therefore reasonable to assume that K1, K2 and K3 are unaffected by the confinement of C. The lateral association constant that gives rise to the double stranded polymer, Kl, could be affected by the presence of lipids. The experiments with unconfined C show that, in the presence of lipid vesicles, Kl adopts a reasonable value for the buffer used, suggesting that the presence of the lipid vesicles does not have a detectable effect on the lateral assembly of the strands. However, it has to be noted that a molecule confined within a vesicle of 100 nm diameter is exposed to a lipid concentration of around 0.15 M, much larger than when it is located in to outside of the same vesicles.17 We cannot therefore fully discard, a priori, a lipid induced modulation on the lateral assembly for confined C.
A local concentration effect is the other factor that can play a central role in the confinement-driven modulation of the assembly.
A first look at the titration data reveals the following features: (i) that D becomes the dominant species from the titration point at which there is enough B to generate enough polymer, that is, when the concentration of B approaches that of C and (ii) that the point of the titration at which polymer stops being the dominant species corresponds to a concentration of B that is similar to the local concentration of C within the lipid vesicle cavity. These features strongly suggest that the phenomenon observed arises from the different way in which C and B can access the different compartments within the system. From C's perspective the solution is circumscribed to the volume confined in the vesicle. From B's perspective the whole solution is accessible. However, once B interacts with C it becomes confined CB. From this point onwards, any further assembly event with other confined species will no longer depend on the bulk concentration, but rather on the local concentration. Thus, the assembly of the polymer, formed by repeating CB units should depend solely on the local concentration of CB. Excess of B promotes disassembly by binding to CB complexes, forming CB2 and removing the building blocks from the polymerization equilibrium. To compete successfully for the CB building blocks with the polymerization process, B must be present at a larger concentration (i.e., ∼3 fold, see Fig. 3 and 4b) than that of other CB blocks. That is, the local concentration of B must be greater than the local concentration of CB. However, B is membrane permeable, so its bulk and local concentration are the same. Therefore, the only way to make the local concentration of B larger than the local concentration of CB is to make the bulk concentration of B larger than the local concentration of CB. The overall effect is the observed persistence of the polymer in a wide range of conditions.
The local concentration effect does also qualitatively explain the behaviour of the system upon dilution of the sample. Diluting the sample decreases the total number of moles of C per unit of sample volume (i.e., the concentration of C in relation to the total volume, [C]), but the local concentration of C in the vesicle cavity ([C]i) remains unchanged. Upon dilution of a sample the concentration of B required to initiate polymer assembly decreases, as we have less number of C molecules per unit of sample volume (see Fig. 4c and d). However, upon dilution of the sample, the concentration of B that is required to lead to de-assembly remains the same as it was prior to dilution because [C]i remains unchanged. Additionally, since [C] is reduced by dilution the ratio [B]/[C] required for de-assembly is increased. Similarly, if a sample containing a large excess of B is diluted, B is diluted both inside and outside the vesicle, but the concentration of CB inside the vesicle remains unchanged, leading to re-assembly (Fig. 5a).
Confinement factor and effective molarity
It is possible to incorporate this confinement effect by modifying the assembly model accordingly. A detailed derivation of the model is found in the ESI.† The key modifications are based on the premise that only the binding events involving 2 or more confined species require a correction due to the confinement effect. Thus, K1 and K2 remain unchanged. K3, on the other hand, is the binding constant between CB and C, both confined and are therefore affected by the confinement effect. K3 can be written as a function of the relevant local concentrations as follows: | (1) |
 | (2) |
The equations that refer to the binding of confined species to the corresponding binding constant (K3, the oligomerization constant Ko and the lateral assembly constant Kl) can be written as a function of the concentration of the species in relation to the bulk and the confinement factor Z as follows:
 | (3) |
 | (4) |
 | (5) |
The UV titration data were fit to the modified assembly model incorporating the confinement factor Z, where the values of K1, K2, K3 and Ko previously determined, as well as Z, were entered as known parameters. Z was estimated by assuming that the concentration of C within the vesicle cavity was equal to the concentration of C in the buffer used to prepare the vesicle sample, before separation by SEC. The only adjustable binding parameter was therefore Kl. The fitting of the data to the model is excellent (Fig. 4c, d and 5a, ESI Fig. S8 and S10†), returning an optimal value of Kl that is the same, within the error, as that calculated for unconfined C (Table 1). These results show that all pairwise interaction parameters, including Kl, are largely unaffected by the confinement and that the local concentration effect, described by the confinement factor Z, satisfactorily explains the behaviour of the system.
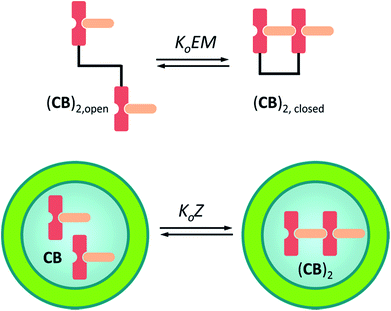
Eqn (3)–(5) clearly show that the stability of the corresponding confined assembly is increased by the confinement factor Z in relation to the stability when found free in solution. Z quantifies the entropic advantage of bringing the binding partners in to close proximity within the cavity. Similarly to how the effective molarity EM accounts for the entropic advantage of an intra-molecular binding event over an intermolecular one. The close relationship between Z and EM can be better illustrated by comparing the formation of a minimal polymer (CB)2 with that of a hypothetical intramolecular complex with analogous structure (Fig. 6). By combining eqn (2) and (3), the formation of (CB)2 confined in a cavity can be written as:
 | (6) |
For a hypothetical compound composed of linked CB units the equilibrium between the open and closed form can be written as:
 | (7) |
 | (8) |
Given that we have considered that the binding partners are, in both cases, analogous, we have that the relation of the concentrations is:
| [(CB)2] ≈ [(CB)2,closed] | (9) |
| [CB] ≈ [(CB)2,open] | (10) |
Substituting (9) and (10) in (8) we have:
 | (11) |
And combining with eqn (2) we have that:
| [CB]i ≈ EM | (12) |
Thus, for the formation of the polymer in the vesicle cavity the local concentration of the building block is equivalent to the effective molarity of an intramolecular interaction event. In multivalent systems EM offers a good measure of the cooperativity, as it is a property of the system that does not generally depend on the concentration of the species involved.31 In confined systems however, the local concentration of building blocks decreases as complexes form. Confinement and multivalence are therefore exactly equivalent only for the initial binding events and diverge near saturation. For this reason, we believe that the confinement factor Z is a more convenient parameter to describe binding events that involve the interaction between confined and non-confined binding partners.
In order to illustrate the extent of stabilization of assemblies in our C–B system we carry out a simulation of the change in polymer formation as the concentration of different components changes, using our assembly model and the calculated pairwise binding constants (Fig. 7, see ESI† for calculation details). Interestingly, and according to our assembly model, confinement both promotes the assembly and leads to polymers that are, on average, markedly longer than those formed in bulk solution (Fig. 7b and c, see ESI† for details). It has to be noted that the average number of molecules of C within the vesicles at the working concentration in our experiments is around 300. According to our assembly model, for this concentration only one or two fairly long fibres will form inside the vesicles. From the X-ray structures of similar complexes we know that each CB repeat has a length of 1.1 nm.29,32 At equilibrium, the fibres are expected to be as long as or longer than the diameter of the vesicles used in this work, which is around 100 nm.
 | ||
| Fig. 7 (a) Schematic illustration of the effect of confinement of C. (b) Plot showing the range of concentration of C and B at which the double stranded polymer is the dominant species (i.e., more than 50% of C involved in the polymer) (red area) for non-confined C. The dashed lines show the average number of repeats of the polymer formed in increments of 10 repeats. (c) Same as (b) for confined C. In all cases the binding constants used are those in Table 1, with Kl averaged between the non-confined and confined values, and the total concentration of C in the cavity of the vesicles is 1 mM. | ||
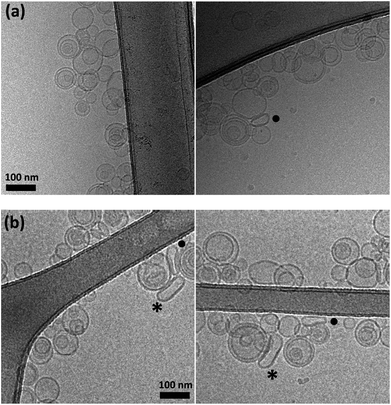
We imaged samples containing vesicle-confined D by cryo-EM to test whether it was possible to visualize the fibres within the vesicle. From our data it was not possible to identify them conclusively. We attribute this result to a number of factors that may include (i) that the fibres are very thin (i.e., ∼2 nm), thinner than the lipid membrane; (ii) that their contrast is inherently low; (iii) that the fibres could be considerably shorter due to the influence of the membrane on the assembly process, which is not accounted for by our assembly model.
Nonetheless, the EM pictures show that the vesicles retain their integrity upon the formation of the assemblies, and that vesicle-free polymers are not observed (ESI Fig. S7† and 8). There is an additional feature that is worth considering. Some vesicles in samples containing D (but not in control samples containing only C) display a flattened or ellipsoidal shape in the absence of physical constrains imposed by other objects present (i.e., other vesicles or the carbon film of the grid, Fig. 8). It remains a possibility that these vesicles are being distorted by the action of a relatively large and rigid polymer D attached to the inner part of the membrane. Confirming this observation will require the use of high definition cryo-electron tomography, which is beyond the scope of the present work. However, if confirmed it would open interesting possibilities for the development of self-assembling mechano-chemical devices that emulate the cytoskeleton function. EM characterization may also allow the detection of stochastic effects on the assembly process, which may be important given the relative low numbers of molecules involved.
Conclusions
In this work we have carried out the detailed analysis of the effect that confinement on the cavity of a vesicle has on the assembly of complexes composed of membrane impermeable and membrane permeable molecules. We show that the resulting long range assemblies are greatly stabilized in relation to the same assemblies formed in solution, becoming persistent in a wide range of experimental conditions and giving rise to counterintuitive behaviour, such as re-assembly upon sample dilution. It has been shown for some non-confined systems that dilution can trigger re-assembly when the appropriate aggregation and ligand binding equilibria are coupled.33 In the absence of confinement however our system experiences de-assembly upon sample dilution. The behaviour of the system when C is confined can be fully explained by taking into account the effect of the local concentration in the cavity, recapitulated in the confinement factor Z, a measure of the entropic advantage that confinement lends to molecular assembly and akin to the effective molarity (EM) in multivalent systems. Like the enhancement of reactivity in the lipid cavities recently described by us,17 it is reasonable to infer that Z would have played a role in promoting chemical complexity during abiogenesis, by enhancing self-assembly processes within the cavity of proto-cells. It needs to be emphasised that, while both the macromolecular crowding effect and the confinement effect described here have an entropic origin they are very different in nature. Macromolecular crowding effects are rooted in the restrictions of motion that macromolecules impose on one another when they are forced into close proximity.18,19 By contrast, the confinement factor described here is derived from the ratio between the local concentration within the confined space and the bulk solution. In our experiments, the concentration within the confined space is 1 mM, very far from crowding-like conditions for small molecules like the ones used here. For confined macromolecules, the confinement effect reported here can therefore complement macromolecular crowding in describing a general behaviour of confined molecules. The straightforward quantification of the confinement effect offered by Z will also be useful for the design and development of artificial devices based on vesicles, such as nano-reactors, biosensors and drug delivery vehicles. The confinement effect is likely to be obscured within the complex biomolecular regulation of living cells. It could however aid the understanding of how a hypothetical membrane-permeable drug may interfere with the assembly of confined biopolymers, such as actin and microtubules, or pathological amyloid fibrils.34–37 Research in our lab is now directed to the design of functional artificial protocells informed by the confinement factor.Conflicts of interest
There are no conflicts of interest to declare.Acknowledgements
The authors will like to thank Prof C. Moores, Prof H. Saibil and Prof N. H. Williams for the critical reading of the manuscript and the Department of Biological Sciences, Birkbeck, for funding. EM was performed at the Department of Biological Sciences, Birkbeck University of London, supported by a Wellcome Trust program grant to Prof. Helen Saibil.Notes and references
- J. P. Schrum, T. F. Zhu and J. W. Szostak, Cold Spring Harbor Perspect. Biol., 2010, 2, a002212 CrossRef PubMed.
- K. Ruiz-Mirazo, C. Briones and A. de la Escosura, Chem. Rev., 2014, 114, 285 CrossRef CAS PubMed.
- R. Saladino, G. Botta, S. Pino, G. Costanzo and E. di Mauro, Chem. Soc. Rev., 2012, 41, 5526 RSC.
- S. Rasmussen, L. H. Chen, M. Nilsson and S. Abe, Artif. Life, 2003, 9, 269 CrossRef PubMed.
- J. D. Sutherland, Angew. Chem., Int. Ed., 2016, 55, 104 CrossRef CAS PubMed.
- J. E. Hein and D. G. Blackmond, Acc. Chem. Res., 2012, 45, 2045 CrossRef CAS PubMed.
- F. R. Bowler, C. K. W. Chan, C. D. Duffy, B. Gerland, S. Islam, M. W. Powner, J. D. Sutherland and J. F. Xu, Nat. Chem., 2013, 5, 383 CrossRef CAS PubMed.
- B. Herschy, A. Whicher, E. Camprubi, C. Watson, L. Dartnell, J. Ward, J. R. G. Evans and N. Lane, J. Mol. Evol., 2014, 79, 213 CrossRef CAS PubMed.
- D. Segre, D. Ben-Eli, D. W. Deamer and D. Lancet, Orig. Life Evol. Biosph., 2001, 31, 119 CrossRef CAS PubMed.
- P. Walde, BioEssays, 2010, 4, 296 CrossRef PubMed.
- S. Murillo-Sanchez, D. Beaufils, J. M. G. Manas, R. Pascal and K. Ruiz-Mirazo, Chem. Sci., 2016, 7, 3406 RSC.
- S. S. Mansy, J. P. Schrum, M. Krishnamurthy, S. Tobe, D. A. Treco and J. W. Szostak, Nature, 2008, 454, 122 CrossRef CAS PubMed.
- K. Adamala and J. W. Szostak, Science, 2013, 342, 1098 CrossRef CAS PubMed.
- K. Adamala and J. W. Szostak, Nat. Commun., 2016, 7, 11041 CrossRef CAS PubMed.
- M. Blocher, D. Liu, P. Walde and P. L. Luisi, Macromolecules, 1999, 32, 7332 CrossRef CAS.
- K. Adamala and J. W. Szostak, Nat. Chem., 2013, 5, 495 CrossRef CAS PubMed.
- A. Grochmal, L. Prout, R. Makin-Taylor, R. Prohens and S. Tomas, J. Am. Chem. Soc., 2015, 137, 12269 CrossRef CAS PubMed.
- H.-X. Zhou, G. Rivas and A. P. Minton, Annu. Rev. Biophys., 2008, 37, 375 CrossRef CAS PubMed.
- A. P. Minton, Biopolymers, 2013, 99, 239 CrossRef CAS PubMed.
- M. J. Langton, F. Keymeulen, M. Ciaccia, N. H. Williams and C. A. Hunter, Nat. Chem., 2017, 9, 426 CrossRef CAS PubMed.
- M. J. Lawson, L. M. Scriven, N. H. Williams and C. A. Hunter, J. Am. Chem. Soc., 2017, 139, 15768 CrossRef PubMed.
- M. De Poli, W. Zawodny, O. Quinonero, M. Lorch, S. J. Webb and J. Clayden, Science, 2016, 352, 575 CrossRef CAS PubMed.
- Y. Elani, A. Gee, R. V. Law and O. Ces, Chem. Sci., 2013, 4, 3332 RSC.
- Y. Qiao, M. Li, R. Booth and S. Mann, Nat. Chem., 2017, 9, 110 CrossRef CAS PubMed.
- B. C. Buddingh and J. C. M. van Hest, Acc. Chem. Res., 2017, 50, 769 CrossRef CAS PubMed.
- S. H. Petrosko, R. Johnson, H. White and C. A. Mirkin, J. Am. Chem. Soc., 2016, 138, 7443 CrossRef CAS PubMed.
- A. Muller and B. Koenig, Chem. Commun., 2014, 50, 12665 RSC.
- P. Tanner, P. Baumann, R. Enea, O. Onaca, C. Palivan and W. Meier, Acc. Chem. Res., 2011, 44, 1039 CrossRef CAS PubMed.
- E. Lopez-Fontal, L. Milanesi and S. Tomas, Chem. Sci., 2016, 7, 4468 RSC.
- C. Campanella, E. Lopez-Fontal, L. Milanesi and S. Tomas, Phys. Chem. Chem. Phys., 2017, 19, 9617 RSC.
- C. A. Hunter, M. C. Misuraca and S. M. Turega, J. Am. Chem. Soc., 2011, 133, 582 CrossRef CAS PubMed.
- A. Fidalgo-Marijuan, G. Barandika, B. Baza, M.-K. Urtiaga and M. I. Arriortua, CrystEngComm, 2013, 15, 4181 RSC.
- F. Helmich, C. C. Lee, M. M. L. Nieuwenhuizen, J. C. Gielen, P. C. M. Christianen, A. Larsen, G. Fytas, P. E. L. G. Leclère, A. P. H. J. Schenning and E. W. Meijer, Angew. Chem., Int. Ed., 2010, 49, 3939 CrossRef CAS PubMed.
- A. Wegner and J. Engel, Biophys. Chem., 1975, 3, 215 CrossRef CAS PubMed.
- D. Sept and J. A. McCammon, Biophys. J., 2001, 81, 667 CrossRef CAS PubMed.
- M. K. Gardner, B. D. Charlebois, I. M. Janosi, J. Howard, A. J. Hunt and D. J. Odde, Cell, 2011, 146, 582 CrossRef CAS PubMed.
- E. K. Esbjorner, F. Chan, E. Rees, M. Erdelyi, L. M. Luheshi, C. W. Bertoncini, C. F. Kaminski, C. M. Dobson and G. S. Kaminski-Schierle, Chem. Biol., 2014, 21, 732 CrossRef CAS PubMed.
Footnote |
| † Electronic supplementary information (ESI) available: Experimental methods, including sample preparation for NMR and UV, confinement experiments and detailed derivation of the equations. See DOI: 10.1039/c7sc04553k |
| This journal is © The Royal Society of Chemistry 2018 |

