 Open Access Article
Beyond optical rotation: what's left is not always right in total synthesis†
Leo A.
Joyce
 *a,
Christopher C.
Nawrat
 *a,
Edward C.
Sherer
 b,
Mirlinda
Biba
a,
Andrew
Brunskill
a,
Gary E.
Martin
a,
Ryan D.
Cohen
a and
Ian W.
Davies
a
aDepartment of Process Research & Development, Merck & Co., Inc., Rahway, NJ 07065, USA. E-mail: leo.joyce@merck.com; christopher.nawrat@merck.com
bDepartment of Modeling and Informatics, Merck & Co., Inc., Rahway, NJ 07065, USA
First published on 30th October 2017
Abstract
This work describes the application of vibrational (VCD) and electronic (ECD) circular dichroism spectroscopy to solve the longstanding debate around the absolute configuration of (+)-frondosin B (1). The absolute configuration of (+)-1 could confidently be assigned as (R) using these spectroscopic techniques. The discrepancy in the optical rotation (OR) values obtained in previous studies can be attributed to an undetected minor impurity (ca. 7%) that arose unexpectedly in a key step late in the synthesis. Additionally, the conditions used in the final step of the previous reports for demethylation to form the natural product proceeded with significant loss of enantiopurity. The large OR measured for the impurity at its observed level, when compared to the small rotation for the less enantiopure natural product 1, led to a measured OR value for the synthetic material that had the opposite sign of the natural product.
Introduction
The total synthesis of natural products holds a pivotal role in organic chemistry and medicine. For over 150 years, extensive synthetic work in the laboratory culminating in a total synthesis was the only way to definitively establish the structure of a natural product for biological evaluation. As more sophisticated analytical methods have been introduced, such time-consuming synthetic studies are rarely required for structure elucidation. It has been noted that natural product synthesis now has “little to do with structural elucidation apart from the assignment of absolute configuration.”1 However, even to date often the only piece of information regarding a molecule's absolute configuration that is known at the outset of a synthesis is the optical rotation (OR). The continued dependence on a simple measurement is perhaps surprising since optical rotation, first described in 1811,2 predates Wöhler's synthesis of urea in 18283 and the field of organic synthesis itself. Since structural information cannot be inferred from the sign and magnitude of an observed rotation,4 measurements are often of little interest to synthetic chemists beyond the (+) and (−) sign. With such limitations, little attention has typically been paid to any confounding contributions from impurities.5When embarking on the synthesis of a natural product target whose absolute configuration is unknown, an enantiomeric series to target is often chosen based on practical considerations such as the availability of a particular chiral building block or enantiomer of a catalyst. Other syntheses may be guided by speculation regarding overarching biosynthetic or metabolic pathways. In the absence of these prevailing factors, the selected enantiomer is often an arbitrary choice. In principle, assuming that all reactions in the synthetic route proceed uneventfully and follow the accepted rules of canonical mechanism, the sign of the optical rotation of the synthetic material can then be used to make inferences about the absolute configuration of the natural product. Despite this relatively empirical approach, there are surprisingly few cases where the absolute configuration of natural products has been disputed.1,6 It is important to note, however, that this may be due to the fact that many natural products are only synthesized once and seldom verified independently.
We recently described an analytical approach that facilitates systematic calculation of both infra-red (IR) and vibrational circular dichroism (VCD)7 spectra, as well as a means to quantitatively compare them to experimental spectra to assign absolute configuration.8 This approach allows the conformational analysis to be carried out directly on reasonably flexible molecules, rather than the fragment-based manner in which they would have been treated in the past. Vibrational spectra are generally easier to calculate than electronic spectra, and thus electronic circular dichroism (ECD)9 has not historically been used. Despite these recent advances in direct assignment of absolute configuration using CD approaches, these techniques have not been widely embraced by the synthetic community. The combined approaches have already led to a series of structural revisions.10
In this work, we describe the direct assignment of absolute configuration of the natural product frondosin B11 and relevant synthetic intermediates through the combined use of OR, VCD, and ECD. Careful analysis was performed to establish both the chemical and enantiomeric purities of intermediates to ensure that the reported optical rotation values were the result of the compound of interest and not impurities. This article demonstrates the efficiency and confidence that can be gained by relying on modern analytical chemistry tools within the framework of organic synthesis.
Results and discussion
We began our work by directly assigning the absolute configuration of naturally occurring (+)-frondosin B (1) using VCD. In order to most quickly ascertain the desired compound, we undertook the MacMillan synthesis to obtain the material.10f This route was chosen because it is short, efficient, and allows ready access to sufficient quantities of both enantiomers of the natural product. An initial conformational search was used to generate the relevant conformers of 1in vacuo. This search found eight conformers that contributed more than 2% to the Boltzmann distribution, representing 96.7% of the weighted distribution for the electronic energy. The conformers and their weighted contribution to the electronic energy distribution are shown in Fig. 2. The distribution of conformers weighted using the free energy distribution was very similar to that of the electronic energy distribution. The main point of distinction for these conformers is the conformational flexibility of the fused cyclohexene and cycloheptadiene rings. The conformer set is broken up into five pairs of two: each pair has the same conformation for the cyclohexene and cycloheptadiene rings, but each has a different OH rotamer. Note that the conformational search did find the phenol rotamers for conformers VII and VIII, however their energies were high enough that they did not make a contribution greater than 1% to the Boltzmann weighted spectrum. For example, the global minimum conformer I has the phenol OH hydrogen atom pointed toward the cyclohexene ring, while the slightly higher energy conformer II has the hydrogen atom pointed away from the cyclohexene ring. It does not appear that any additional favorable interactions are gained by pointing the phenol hydrogen atom toward the cyclohexene ring, but this rotamer is lower in energy for each pair.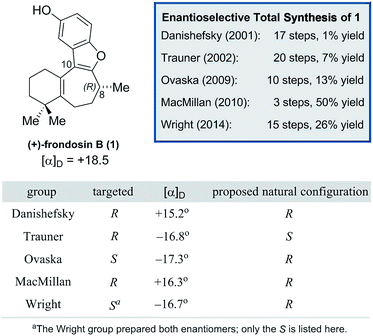 | ||
| Fig. 1 A summary of the enantioselective frondosin B (1) syntheses reported to date. Note that the two carbon atoms most relevant to the hypotheses for inversion have been numbered. These OR values were all recorded with disparate conditions (temp, conc, solvent); see individual references for more information.11b,11d,11e,11f,11g | ||
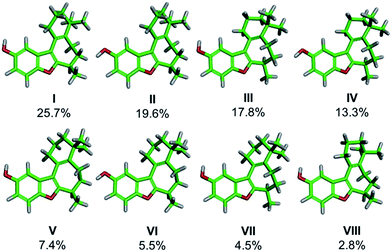 | ||
| Fig. 2 Conformers of frondosin B that contribute greater than 2% to the electronic energy Boltzmann distribution. Atom coloring is as follows: green (carbon), gray (hydrogen), and red (oxygen). | ||
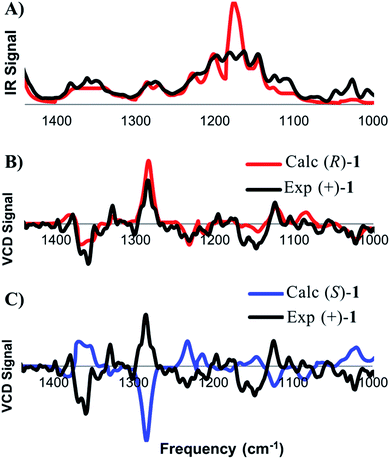
DFT frequency calculations were performed on these conformers in order to extract the theoretical IR and VCD spectra and the calculated spectra were compared to the experimental spectra, obtained from a chloroform solution of (+)-1 (Fig. 3). This process begins with comparison of the IR spectra to confirm that the structure of the compound under comparison is correct. Once this is confirmed, the focus shifts toward comparing the calculated and experimental VCD spectra to determine which enantiomer is present. The concentration of the analyte was optimized such that all of the observed signals in the range of 1000–1500 cm−1 were within an acceptable intensity to facilitate accurate measurement. As shown in Fig. 3A, there is a good visual correlation between the calculated and experimental IR spectra. Our preferred comparison method for IR spectra is based on published methodology,8,12 where an integration under the curve assessment is performed. The following changes have been made to the published methodology: the spectra are scaled before comparison, each peak is moved individually rather than groups of peaks, the experimental vibrations are moved to higher frequencies only with a maximum shift of 20 cm−1, and drifting baselines can be corrected by the user while matching. The quality of the IR match is assessed on a scale from 0 to 1. While a comparison value of 1 represents a perfect overlay for the two spectra, values in the 0.7–0.9 range routinely provide strong matches. In the present case of (+)-1, the final IR match was found to be 0.77.
After satisfactory matching of the IR spectra confirmed that the correct structure was in hand, we turned our attention to determining the absolute configuration through comparison of the VCD spectra. The spectral matching was carried out the same way for VCD as it is for IR, except that the quality is assessed on a scale from −1 to 1, where a value of 1 represents a perfect match, and −1 represents equal and opposite values at all frequencies. The curve fitting algorithm is applied to the VCD spectra of both enantiomers, which generally improves the quality of the match for each enantiomer. To ensure accuracy in assignment, an enantiomeric similarity index (ESI) value is calculated. The ESI value represents the difference between the values calculated for each enantiomer. Provided that there is a good ESI for a given enantiomer, as well as a good match upon visual inspection, confident assignments can routinely be made in the range of 0.2 to 0.5. The final match between (+)-1 and the calculated (R)-1 was found to be 0.544, while the match with (S)-1 was calculated to be −0.036 (ESI of 0.580). An ESI of this magnitude allows the absolute configuration of (+)-1 to be confidently assigned as (R), which is in agreement with the original report by Danishefsky.11b
While VCD can be a very successful method for absolute configuration assignment, a number of drawbacks limit its general applicability to natural product isolation and synthesis. In particular, at least 5–10 milligrams of material is typically required for analysis.10g,10h,10j This is due to the small size of the output signal, which requires thousands of accumulations in order to obtain a sufficiently high signal-to-noise ratio. For a confident assignment, the process may require up to 12 hours of measurement per enantiomer. Additionally, to account for the small VCD signal intensity, highly concentrated analyte solutions of 50–100 mg mL−1 in either DMSO or CHCl3 are required, placing additional solubility restrictions on the compounds that can be studied.
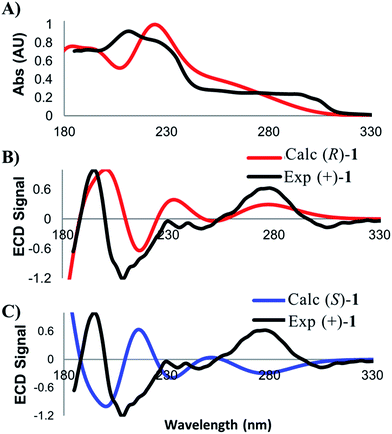
A related technique that has emerged in recent years is electronic circular dichroism (ECD), which relies on the same principles as UV/vis spectroscopy. While there are fewer bands with which to match experimental and calculated spectra in ECD, this approach is attractive due to the lower material requirements and shorter data acquisition times. As for VCD, low energy conformers contributing greater than two percent to the final Boltzmann weighted spectrum were identified and then subjected to time-dependent density functional theory (TD-DFT)13 in order to calculate the electronic absorption properties of 1. Calculation parameters, spectral display, and broadening were carried out according to previously published criteria.10e Several discernible peaks resulting from chiroptical electronic transitions were observed in the 185–300 nm range. The experimental ECD spectrum for (+)-1 was then compared against the calculated spectra for the (R)- and (S)-enantiomers (Fig. 4). The ECD analysis required less than 10 minutes of data acquisition on only 16 micrograms of the natural product.
In order to assess the quality of the match, we employed the same approach that was taken for the comparison of calculated and experimental VCD spectra. The match between the experimental UV spectrum and the spectrum calculated for the (R)-enantiomer of 1 was found to be 0.938. This value ensures the correct identity of the compound of interest. Next, we assessed the quality of the ECD match. The match between the experimental (+)-1 sample and the calculated spectrum for (R)-1 was determined to be 0.537, while the match with to (S)-1 was −0.392. The relatively large ESI value of 0.938, coupled with good visual correlation of the spectra, again supports a confident assignment of absolute configuration that is in full agreement with the results from the VCD analysis.
As shown in Fig. 1, naturally-occurring frondosin B was reported to have a small positive optical rotation value ([α]D = +18.5°). When Danishefsky and co-workers completed the first total synthesis of (R)-1 and obtained a similar value ([α]D = +15.2°), they concluded that the natural product itself must possess (R) configuration at C-8.11b However, doubts over this initial assignment arose the following year when the Trauner group synthesized what they believed to be (R)-1, but unexpectedly obtained a negative OR value ([α]D = −16.8°), concluding that the natural product in fact exists as the opposite enantiomer.11d It is important to note that while both groups targeted the (R) configured natural product, neither group had definitive analytical proof that this was the final product of their synthesis, beyond the fact that this was the expected output of the sequence of reactions that they ran.
Trauner explained this discrepancy by positing an unintended inversion early in the Danishefsky route, which he believed had inadvertently led to the synthesis of the (S) configured natural product. The Danishefsky synthesis set the C-8 stereocenter by opening of a known epoxide, prepared by well-precedented Sharpless epoxidation, using trimethylaluminum. Trauner proposed that this opening had proceeded with retention of stereochemistry—instead of the intended inversion—through the anchimeric participation of a nearby ester. However, in the years that followed the preponderance of evidence from total syntheses completed in the Ovaska,11e MacMillan,11f and Wright11g laboratories appeared to reinforce Danishefsky's original report that 1 possesses the (R) configuration at the C-8 stereocenter.
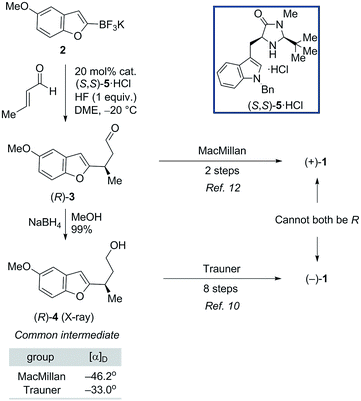
In light of these results, it was suggested by MacMillan and Wright that Trauner's aberrant optical rotation could be the result of an untoward inversion of the C-8 stereocenter at some point during his own synthesis. The most compelling evidence for this posited inversion comes from a series of studies undertaken by the MacMillan group (Scheme 1). A key step in the MacMillan synthesis of (R)-1 is the asymmetric organocatalyzed conjugate addition reaction of trifluoroborate 2 to crotonaldehyde to give (R)-3, which can be reduced to give alcohol (R)-4. The stereochemical course of the conjugate addition reaction is easily predicted using well established models, but was further verified by X-ray crystallographic analysis of the bromobenzoate derivative of 4.11f It is noteworthy that alcohol (R)-4 is also an intermediate in Trauner's synthesis of (−)-1, and its optical rotation was found to align with that previously reported by Trauner and co-workers.
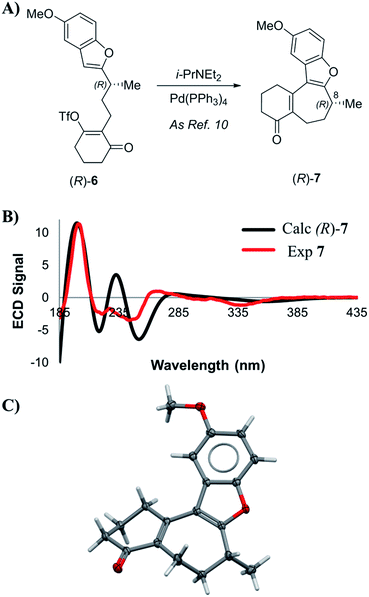
However, while MacMillan processed aldehyde (R)-3 to (+)-1, Trauner converted the alcohol (R)-4 to (−)-1, seemingly implying that an unexpected inversion must lie between (R)-4 and the natural product. Additionally, similar interception of an intermediate from the Danishefsky synthesis after the C-8 stereocenter had been set argued against the inversion in this route proposed by Trauner. MacMillan ruled out inversion during his own synthetic sequence through a series of deuterium labeling studies. It was suggested that the inversion could be occurring during the Heck cyclization step in Trauner's synthesis (Scheme 2A). Since this postulate was not investigated experimentally, we began our search for the point of inversion with this chemical step.
Enone 7 was prepared using a chimeric synthetic approach, where the common intermediate (R)-4 in the Trauner synthesis was prepared using the more expedient MacMillan chemistry. Alcohol (R)-4 was then subjected to preparative supercritical fluid chromatography (SFC) using a chiral stationary phase in order to increase the enantiopurity to 99.4% ee. This material was then carried through the latter half of Trauner's route to provide the Heck reaction substrate (R)-6 and subjected to the Heck cyclization conditions under the literature conditions reported by Trauner to afford enone 7. These compounds are reported to have very small optical rotation values, and hence any impurities present in the product could have a dramatic effect on the measured optical rotation. In our case, an achiral purity analysis was carried out, and it was determined that this product was 99.7% pure by liquid chromatography area percent (LCAP) at 210 nanometers. The enantiomeric purity of (R)-7 was also determined by chiral supercritical fluid chromatography (SFC), and the sample was found to have an ee of 99.4%. Optical rotation measurement yielded a value of −44.0°, in comparison to values reported by Trauner (−36.1°) and Wright (−39.4°).
VCD and ECD spectra for compound 7 were calculated according to the methodology described above, and compared to the experimental spectra. Scheme 2B shows a comparison between calculated and experimental ECD spectra. Visual inspection of these spectra reveal good correlation between the experimental and that calculated for the (R)-enantiomer, with statistical analysis supporting this initial inspection (ESI of 0.628). Additionally, we were able to prepare a suitable single crystal of 7 for X-ray diffraction (SCXRD) analysis. Anomalous dispersion confirmed that the absolute configuration of the enone intermediate 7 was indeed (R). With multiple analytical techniques defining the assignment of an (R)-configuration for intermediate 7, no evidence of inversion was observed during the palladium-catalyzed Heck cyclization step.
Next, we studied the dimethylation sequence that converts 7 into O-methyl frondosin B (8) (Scheme 3). It should be noted that with only gem-dimethylation and deprotection remaining in Trauner's total synthesis, this step appeared to be the most likely place for the posited inversion of the C-8 stereocenter to occur. Furthermore, in addition to the inversion implied by Trauner's incongruous final optical rotation, evidence from their 2014 synthesis of 1 also led the Wright group to conclude that the C-8 center was inverted during the penultimate methylation reaction. However, it is important to note that the Wright group's argument that inversion had occurred was solely based on the optical rotation data that were reported by Trauner for 8. We decided to explore the stereochemical outcome of the reaction using a wider range of analytical techniques.
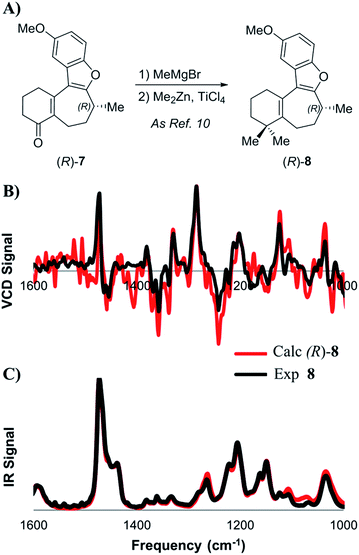 | ||
| Scheme 3 (A) Introduction of the gem-dimethyl group as described by Trauner. Lower: comparison of experimental and calculated VCD (B) and IR (C) spectra for intermediate 8. | ||
At first, the gem-dimethylation of enone 7 to give 8 was carried out exactly as described by Trauner. Interestingly, the optical rotation of this material was measured to be −6.8°, which is significantly different from that reported by both Wright (−11.1°) and Trauner (−36.1°).14 VCD and ECD spectra were calculated according to the methodology described above, and compared to the experimental spectra. Scheme 3B shows a comparison between calculated and experimental IR and VCD spectra. A good correlation between the calculated (R)-enantiomer and the experimental spectrum of penultimate 8 was found using both visual inspection, as well as statistical analysis (ESI of 0.526). Crucially, these data strongly argue against inversion during dimethylation of enone 8, which was found to remain (R)-configured at C-8 after installation of the gem-dimethyl group. In addition, SFC analysis showed that no measurable change in enantiopurity occurred during the reaction.
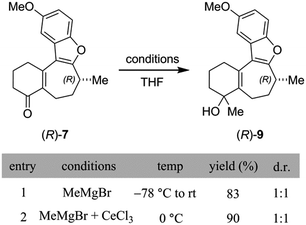
At this point, cognizant of the different conditions used by Trauner and Wright for the methylation of 7, it was important to check that the inversion seemingly observed by Wright could not have been caused by changes to the reaction parameters. Breaking the sequence down into its separate steps, we began by examining the initial addition of MeMgBr to enone 8 (Scheme 4). Under the conditions of the Trauner synthesis, also used for our initial preparation of 8, this step involved addition of the Grignard reagent at −78 °C and subsequent warming of the mixture to room temperature. Intriguingly, Trauner's protocol for this step was significantly modified by Wright through the addition of cerium(III) chloride and use of a higher reaction temperature (0 °C). Although this deviation was not discussed in the Wright paper, it was explained elsewhere that this modification was found to increase low conversion observed by Wright under Trauner's original conditions.15 Unfortunately, the diastereoselectivity of this step was not reported by either group. However, in our hands, analysis of the 1H NMR spectra of the tertiary alcohols from both reactions indicated that they gave essentially the same outcome, namely a 1![[thin space (1/6-em)]](https://www.rsc.org/images/entities/char_2009.gif) :
:![[thin space (1/6-em)]](https://www.rsc.org/images/entities/char_2009.gif) 1 mixture of epimers (Scheme 4).
1 mixture of epimers (Scheme 4).
Next, we turned our attention to the conditions for the introduction of the second methyl group (Scheme 5A), in order to probe their effect on the C-8 stereocenter. Toward the end of natural product syntheses material is often quite scarce and steps are rarely repeated multiple times, meaning that the impact of varying experimental conditions can be missed. Therefore, in addition to running the Trauner and Wright conditions, and the original conditions from the Reetz publication of this transformation cited by Trauner,16 conditions were selected to simulate poor temperature control, undercharging of ZnMe2, and inverting stoichiometries of the metal reagents. The data are collected in the ESI (Scheme S2†), where the relative amounts of each enantiomer present was determined using a chiral SFC analytical method. Crucially, although some slight erosion of stereochemical purity was observed for longer reaction times or higher temperatures, none of the reactions produced material that was close to racemization let alone complete inversion. On the basis of our SFC analysis, taken with the chiroptical studies of 8 outlined above, it was concluded that inversion of the C-8 stereocenter during the conversion of enone 7 into dimethylated compound 8 does not occur in our hands.
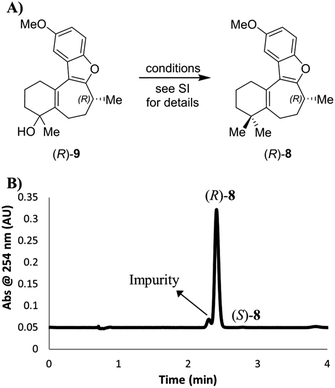 | ||
| Scheme 5 (A) Introduction of a second methyl group to intermediate alcohol. The starting material (R)-7 for this sequence had an ee value of 99.4%. (B) SFC chromatogram of the product (R)-8 (prepared as for Scheme S2,† entry 1), showing the formation and separation of an impurity. | ||
However, while we determined that there was little to no erosion of the enantioselectivity of the gem-dimethylation, the chiral SFC method was able to separate a previously unobserved impurity that represented approximately 7% of the main peak by LCAP at 210 nm (Scheme 5B). Subsequent SFC-MS analysis of this impurity gave the same m/z signal as the desired product 8, indicating that this species is most likely a structural isomer of (R)-8. It should be noted that we were unable to separate this impurity by silica gel chromatography under the published conditions for the purification of 8 or through our own efforts. Thus, the final deprotection step was run using starting material containing this impurity.
After confirming that inversion does not occur during the gem-dimethylation step to form the penultimate compound 8, there was only one more reaction to consider – the final O-demethylation step leading to the natural product. Thus, O-demethylation to unmask the natural product was carried out under the various literature conditions reported for this transformation (Scheme 6A). The first set of conditions employed sodium ethanethiolate (NaSEt) in refluxing DMF, as was used by the Danishefsky, Trauner, and Wright groups. Two variants of this procedure exist in the literature: Danishefsky and Trauner prepared NaSEt in situ from EtSH and NaH, whereas Wright used commercially available NaSEt. However, in our hands, the use of either freshly prepared or commercially available NaSEt seemed to have little effect on the outcome of the reaction.
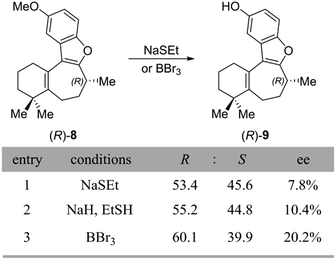 | ||
| Scheme 6 (A) Conditions used for demethylation to form 1, along with the results from this reaction. | ||
Unexpectedly, we observed significant loss of enantiopurity during the NaSEt-dependent demethylation of the penultimate (R)-8, resulting in the formation of near-racemic 1, as measured by chiral SFC (Scheme 6, entries 1 and 2). Interestingly, by using a chiral SFC method that could separate the enantiomers of both the starting material and product, it was found that in incomplete reactions, the unreacted starting material was also nearly racemic. The demethylation conditions published by MacMillan and co-workers using boron tribromide were also examined, and in our hands this reaction showed complete consumption of the (R)-8 starting material but again also significant loss of enantiopurity (entry 3, 20% ee). Although this outcome was unexpected, it is difficult to draw a comparison between our findings and those of previous total syntheses, due to the lack of quantitative enantiopurity data accompanying these reports. Indeed, with the exception of Danishefsky, no other group reported an enantiomeric excess of their synthetic frondosin B, supplying only OR data. It should be noted that while the Danishefsky group still obtained (+)-1 in 84% ee, they too observed some loss of enantiomeric excess during the demethylation step.17
For completeness, an OR value was measured for the nearly racemic crude material that was obtained under Trauner's published conditions (Scheme 6, entry 1). To our surprise, a value of −15.2° was obtained for this crude material, which compared well with that reported for the pure natural product (+18.5°), albeit with the opposite sign. It is worth noting that this value is a close match both in sign and magnitude to that reported by Trauner for his synthetic frondosin B (−16.2°). However, comparison of our product against samples of synthetic (R)- and (S)-1 by chiral SFC clearly showed it to contain mostly (R)-1, which we had demonstrated earlier to have a positive optical rotation.
In light of this finding, we decided to confirm the OR value of chemically- and enantiomerically-pure 1 by preparative separation of the enantiomers of our near-racemic material. Although (S)-1 could be isolated in high purity, we were initially unable to separate (R)-1 from a close running minor impurity (approximately 7% by LCAP; Scheme 7, red and blue traces). Remarkably, when the ORs of both fractions were measured, they each gave a negative signal of roughly the same magnitude (−13.2° for a mixture of the impurity and (R)-1, −13.8° for (S)-1). In order to investigate this unexpected observation, an additional separation of the mixed fraction was carried out to give pure samples of (R)-1 and the minor impurity. To our delight, purified (R)-1 now gave the expected OR of +13.1°, a value close to that reported for the natural material and nearly equal and opposite to that obtained for (S)-1. However, we remained curious about the identity of the minor impurity whose optical activity had been able to completely override that of (R)-1. Measurement of the OR for the impurity gave a value of −155.8°, which was an order of magnitude larger than (R)-1 with the opposite sign, explaining how the contribution of the impurity had dominated the OR of the mixed fraction. This result raised the intriguing possibility that this minor impurity could have played a role in the confusion surrounding the disparate optical rotations reported for synthetic 1. Thus, our efforts now focused on the elucidation of the impurity structure in order to better understand its origin.
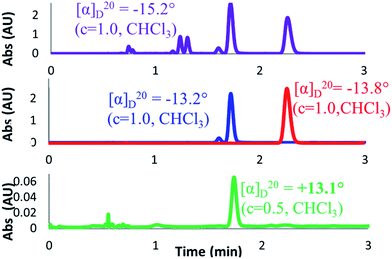 | ||
| Scheme 7 Chiral SFC method showing traces and OR values for crude reaction (purple), initially purified (R)-1 (blue), purified (S)-1 (red), and further purified (R)-1 (green). | ||
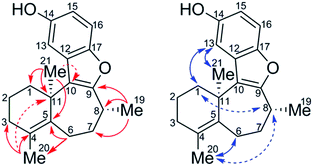
The sample of the impurity was characterized using an ensemble of 1D and 2D NMR spectra, the latter including multiplicity-edited pure shift HSQC (ME-PS-HSQC),18,19 18 ms IDR-HSQC-TOCSY, 400 ms ROESY, 8 Hz optimized HMBC, and 3 Hz optimized LR-HSQMBC spectra.20 The most remarkable initial feature on comparing the proton and ME-PS-HSQC spectra of 1 and the impurity (10) was the chemical shift of the methyl groups. For 1, the gem-dimethyl singlets were observed at 1.11/28.2 (1H/13C) ppm and 1.11/29.2 ppm. The 8-methyl resonance was observed at 1.38/20.0 ppm. In contrast, for the impurity, 10, two methyl resonances remained as singlets resonating at 1.55/26.1 and 1.69/19.8 ppm, and the third was a doublet that could be assigned as the 8-methyl resonating at 1.35/16.6 ppm. That two of the methyl resonances were singlets suggested that they either had to be attached to sp2 carbons or located at a bridgehead. The conspicuous absence of an HMBC correlation between the methyl singlets suggested that a gem-dimethyl group was no longer incorporated in the structure. The interpretation of the HMBC data afforded the structure of 10, which is shown below with key long-range correlations shown (Fig. 5).
After determining the constitution of the impurity, 10, the stereoconfiguration of the C21 bridgehead methyl group was then assigned based on ROESY data combined with DFT chemical shift predictions (GIAO-mPW1PW91/6-31+G**//B3LYP/6-31G*) of the (R,R) and (S,R) isomers. Weak ROEs from H8 to H1′ and H8 to H20 indicate that the methyl groups, C21 and C19, are syn. Comparing chemical shifts predicted from DFT to experiment, mean absolute errors (MAEs) were 0.07 and 1.67 (1H and 13C, respectively) for (11R, 8R) versus 0.10 and 2.16 for (11S, 8R). The DP4+ probability,21 which applies a Bayesian statistical treatment to the DFT predictions, was then calculated and found to be 100% for the (R, R) relative stereoisomer.
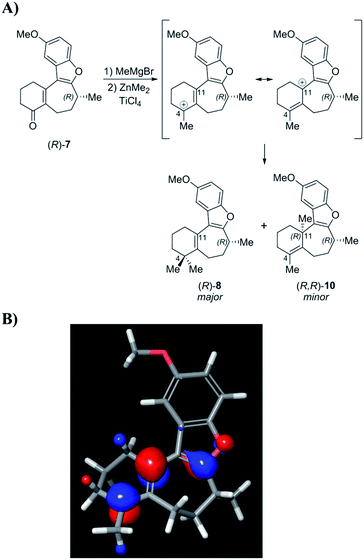
Following structure elucidation of the impurity, its formation can be rationalized through consideration of the reaction mechanism. In one scenario, initial methylation of enone 7 proceeds to give a carbocation that can be stabilized through the oxocarbenium ion (Scheme 8). The compound is expected to have significant positive charge at the carbon where the methyl group was added, and addition of the second methyl group to this position will proceed to give the desired intermediate (R)-8. Owing to its nature as an allylic carbocation, addition at the gamma position gives rise to the previously unforeseen impurity (R,R)-10. The LUMO for this carbocation was calculated, and indeed showed significant orbital character on both positions where substitution was observed. Alternatively, this product may arise from conjugate addition of MeMgBr, followed by ketone methylation, and finally dehydration of the tertiary alcohol to form impurity 10. Measurement of the OR for this product gave a value of −155.8°, which was indeed an order of magnitude larger than (R)-1 with the opposite sign. This finding suggests that this impurity, rather than an inversion, may have led to the discrepancy between the asymmetric syntheses of this compound in the past.
Conclusions
In the two decades since Danishefsky and co-workers completed the first total synthesis of frondosin B (1), numerous mechanistic hypotheses have been advanced to reconcile the various stereochemical outcomes seemingly observed by different research groups. Ever since the publication of Trauner's synthesis, it has been assumed by the community that an unexpected inversion of the C-8 stereogenic center, proposed to occur at various points in either Danishefsky's or Trauner's route, must be the root cause of this discord. However, it must be remembered that every published argument for the existence of an inversion at all comes only from differences observed in the measurements of a small optical rotation conducted on minute quantities of material, often of unknown chemical purity or enantiopurity.During our re-investigation of Trauner's synthesis, we used multiple analytical techniques to rule out inversion of the C-8 stereocenter under the published reaction conditions for any of the synthetic operations in this route. Despite the aberrant negative optical rotation obtained by the Trauner group, there can be no doubt that in our hands this synthetic route yields natural (+)-(R)-1, albeit with lower-than-expected enantioselectivity. Most intriguingly, during our repetition of the Trauner–Wright endgame, we uncovered the impurity 10 that is formed during the penultimate dimethylation step and possessed suitable abundance and optical activity to create the illusion that an inversion had taken place. Indeed, the initially measured optical rotation for the material we prepared using Trauner's chemistry (−15.2°) was tantalizingly close to that reported in the original publication (−16.8°). If we had relied solely upon this optical rotation value, we would likely have concluded, as Trauner did, that the natural product was S-configured, and the controversy would have been reignited. Of course, it is not always possible for us to know if impurity 10 was present in historical samples from other researchers. However, we believe that this case study clearly demonstrates how the modern analytical tools described above can quickly and definitively resolve challenging stereochemical questions for which years of lab-work were unable to provide a compelling answer.
The longstanding issue of reproducibility in chemistry in an important one, and while cases of deliberate falsification of data are extremely rare, unconscious investigator bias and other psychological pitfalls pose a clear danger to researchers.22 Although the act of repeating experiments to confirm results is crucial, as a corollary we state that the structural interpretation of the products of synthetic chemistry is incomplete without the use of the full ensemble of analytical tools for the assessment of achiral and enantiomeric purity. Although the sign of an optical rotation measurement has historically been used as a criterion for the successful completion of an asymmetric total synthesis, this metric is predicated on the assumption that every transformation in a synthetic route occurs exactly as the chemist expects. As optical rotation does not reveal any direct information about a molecule's absolute configuration, untoward stereochemical outcomes such as inversion or erosion can go unnoticed until a synthesis is repeated. Even then, if subsequent syntheses of a target are conducted without the necessary analytical separation and analysis techniques to assess purity, they may do little to pinpoint the source of error.
This work showcases the use of VCD and ECD to assign absolute configuration of synthetic intermediates and final products within the context of natural product total synthesis. It is instructive to recognize that in this case the correct stereochemical assignment of 1via ECD could be made with just 16 micrograms of the natural product. With recent advances in computational chemistry and the increasing commercial availability of instruments capable of addressing such stereochemical questions, we believe that VCD and ECD are a valuable addition to the synthetic chemist's toolbox and should also be adopted in graduate training programs. There is no doubt that through computational and chiroptical methods, combined with recent advances in unequivocal structural elucidation through NMR spectroscopy,23 we have entered what promises to be a disruptive period in natural product synthesis.
Conflicts of interest
There are no conflicts of interest to declare.Acknowledgements
We would like to thank Valerie Shurtleff for the preparation of unnatural (−)-frondosin B using the MacMillan route. We would like to thank Professor David MacMillan, Michael VanHeyst, and Roy Helmy, for insightful discussions.Notes and references
- K. C. Nicolaou and S. A. Snyder, Angew. Chem., Int. Ed., 2005, 44, 1012 CrossRef CAS PubMed.
- J. D. F. Arago, Mém. Inst., 1811, 1, 93 Search PubMed.
- F. Wöhler, Ann. Phys., 1828, 88, 253 CrossRef.
- Comprehensive Chiroptical Spectroscopy, ed. N. Berova, P. L. Polavarapu, K. Nakanishi and R. W. Woody, Wiley, Hoboken, NJ, 2012, vol. 1 Search PubMed.
- K. Mori, Tetrahedron, 1989, 45, 3233 CrossRef CAS.
- (a) H. D. Yoo, S. J. Nam, Y. W. Chin and M. S. Kim, Arch. Pharmacal Res., 2016, 39, 143 CrossRef CAS PubMed; (b) M. E. Maier, Nat. Prod. Rep., 2009, 26, 1105 RSC.
- L. A. Nafie, Vibrational Optical Activity: Principles and Applications, Wiley, Hoboken, 2011 Search PubMed.
- E. C. Sherer, C. H. Lee, J. Shpungin, J. F. Cuff, C. Da, R. Ball, R. Bach, A. Crespo, X. Gong and C. J. Welch, J. Med. Chem., 2014, 57, 477 CrossRef CAS PubMed.
- Circular Dichroism: Principles and Applications, ed. N. Berova, K. Nakanishi and R. W. Woody, Wiley-VCH, New York, 2000 Search PubMed.
- (a) A. Aamouche, F. J. Devlin and J. P. Stephens, Chem. Commun., 1999, 4, 361 RSC; (b) A. G. Petrovic, J. He, P. L. Polavarapu, P. L. S. Xiao and D. W. Armstrong, Org. Biomol. Chem., 2005, 3, 1977 RSC; (c) F. J. Devlin, J. P. Stephens and P. Besse, Tetrahedron: Asymmetry, 2005, 16, 1557 CrossRef CAS; (d) J. M. Batista, A. N. L. Batista, D. Rinaldo, W. Vilegas, Q. B. Cass, V. S. Bolzani, V. M. J. Kato, S. N. Lopez, M. Furlan and L. A. Nafie, Tetrahedron: Asymmetry, 2010, 21, 2402 CrossRef CAS; (e) E. C. Sherer, J. R. Cheeseman and R. T. Williamson, Org. Biomol. Chem., 2015, 13, 4169 RSC; (f) P. He, X. Wang, X. Guo, Y. Ji, C. Zhou, S. Shen, D. Hu, X. Yang, D. Luo, R. Dukor and H. Zhu, Tetrahedron Lett., 2014, 55, 2965 CrossRef CAS; (g) J. M. Batista Jr, E. W. Blanch and V. S. Bolzani, Nat. Prod. Rep., 2015, 32, 1280 RSC; (h) D. J. Tantillo, Nat. Prod. Rep., 2013, 30, 1079 RSC; (i) S. D. Zhao, L. Shen, D. Q. Luo and H. J. Zhu, Curr. Org. Chem., 2011, 15, 1843 CrossRef CAS; (j) A. G. Petrovica, A. Navarro-Vázquezb and J. L. Alonso-Gómez, Curr. Org. Chem., 2010, 14, 1612 CrossRef; (k) X. C. Li, D. Ferreira and D. Yuanqing, Curr. Org. Chem., 2010, 14, 1678 CrossRef CAS PubMed; (l) S. G. Allenmark, Nat. Prod. Rep., 2000, 17, 145 RSC; (m) A. D. Patil, A. J. Freyer, L. Killmer, P. Offen, B. Carte, A. J. Jurewicz and R. K. Johnson, Tetrahedron, 1997, 53, 5047 CrossRef CAS; (n) Y. F. Hallock, J. H. Cardellina and M. R. Boyd, Nat. Prod. Lett., 1998, 11, 153 CrossRef CAS.
- (a) M. Inoue, A. J. Frontier and S. J. Danishefsky, Angew. Chem., Int. Ed., 2000, 39, 761 CrossRef CAS; (b) M. Inoue, M. W. Carson, A. J. Frontier and S. J. Danishefsky, J. Am. Chem. Soc., 2001, 123, 1878 CrossRef CAS PubMed; (c) C. C. Hughes and D. Trauner, Angew. Chem., Int. Ed., 2002, 41, 1569 ( Angew. Chem., Int. Ed. , 2002 , 41 , 2227 ) CrossRef CAS; (d) C. C. Hughes and D. Trauner, Tetrahedron, 2004, 60, 9675 CrossRef CAS; (e) T. V. Ovaska, J. A. Sullivan, S. I. Ovaska, J. E. Winegrad and J. D. Fair, Org. Lett., 2009, 11, 2715 CrossRef CAS PubMed; (f) M. Reiter, S. Torssell, S. Lee and D. W. C. MacMillan, Chem. Sci., 2010, 1, 37 RSC; (g) E. Z. Oblak, M. D. VanHeyst, J. Li, A. J. Wiemer and D. L. Wright, J. Am. Chem. Soc., 2014, 136, 4309 CrossRef CAS PubMed; (h) M. D. VanHeyst and D. L. Wright, Eur. J. Org. Chem., 2015, 7, 1387 CrossRef.
- J. A. Shen, C. Y. Zhu, S. Reiling and R. Vaz, Spectrochim. Acta, Part A, 2010, 76, 418 CrossRef PubMed.
- (a) R. Bauernschmitt and R. Ahlrichs, Chem. Phys. Lett., 1996, 256, 454 CrossRef CAS; (b) J. Autschbach, L. Nitsch-Velasquez and M. Rudolph, Top. Curr. Chem., 2001, 298, 1 Search PubMed.
- The value reported by Trauner for the optical rotation (−36.1°) of intermediate 8 is identical to the value reported for intermediate 7. It is possible that this data was inadvertantly duplicated at some point, which could explain the much larger value reported for 8 by Trauner.
- “We elected to use the cerium derivative of methyl Grignard, as the simple Grignard reagent gave incomplete reaction even after a large excess of the reagent was added. Incomplete addition is most likely due to enolization of the A-ring ketone.” E. Zachary Oblak, Oxabicyclic Building Blocks as Key Intermediates in the Synthesis of Natural Products, Ph. D. Dissertation, University of Connecticut, 2011 Search PubMed.
- M. T. Reetz, J. Westermann and R. J. Steinbach, J. Chem. Soc., Chem. Commun., 1981, 237 RSC.
- See Fig. S8 in the ESI† for more information about the reported chiral separation.
- Y. Liu, M. D. Green, R. Marques, T. Periera, R. Helmy, R. T. Williamson, W. Bermel and G. E. Martin, Tetrahedron Lett., 2016, 55, 5450 CrossRef.
- L. Castañar and T. Parella, Magn. Reson. Chem., 2015, 53, 399 CrossRef PubMed.
- R. T. Williamson, A. V. Buevich, G. E. Martin and T. Parella, J. Org. Chem., 2014, 79, 3387 CrossRef PubMed.
- N. Grimblat, M. M. Zanardi and A. M. Sanotti, J. Org. Chem., 2015, 80, 12526 CrossRef CAS PubMed.
- R. G. Bergman and R. L. Danheiser, Angew. Chem., Int. Ed., 2016, 55, 12548 CrossRef CAS PubMed.
- Y. Liu, J. Sauri, E. Mevers, M. W. Peczuh, H. Hiemstra, J. Clardy, G. E. Martin and R. T. Williamson, Science, 2017, 356, 43 CAS.
Footnote |
| † Electronic supplementary information (ESI) available: Description of materials and methods, experimental data, calculation parameters and coordinates, and NMR spectra. CCDC 1553975. For ESI and crystallographic data in CIF or other electronic format see DOI: 10.1039/c7sc04249c |
| This journal is © The Royal Society of Chemistry 2018 |

