
 Open Access Article
 This Open Access Article is licensed under a Creative Commons Attribution-Non Commercial 3.0 Unported Licence
Enantiomeric resolution and X-ray optical activity of a tricobalt extended metal atom chain†
Anandi
Srinivasan‡
ab,
Miguel
Cortijo‡
 abcd,
Vladimir
Bulicanu
ab,
Ahmad
Naim
cd,
Rodolphe
Clérac
ab,
Philippe
Sainctavit
*e,
Andrei
Rogalev
f,
Fabrice
Wilhelm
f,
Patrick
Rosa
cd and
Elizabeth A.
Hillard
*ab
abcd,
Vladimir
Bulicanu
ab,
Ahmad
Naim
cd,
Rodolphe
Clérac
ab,
Philippe
Sainctavit
*e,
Andrei
Rogalev
f,
Fabrice
Wilhelm
f,
Patrick
Rosa
cd and
Elizabeth A.
Hillard
*ab
aCNRS, CRPP, UPR 8641, F-33600 Pessac, France. E-mail: hillard@crpp-bordeaux.cnrs.fr
bUniv. Bordeaux, CRPP, UPR 8641, F-33600 Pessac, France
cCNRS, ICMCB, UPR 9048, F-33600 Pessac, France
dUniv. Bordeaux, ICMCB, UPR 9048, F-33600 Pessac, France
eInstitut de Mineralogie, de Physique des Materiaux et de Cosmochimie, UMR 7590, CNRS, UPMC, IRD, MNHN, F-75005 Paris, France. E-mail: Philippe.Sainctavit@impmc.upmc.fr
fEuropean Synchrotron Radiation Facility (ESRF), F-38043 Grenoble, France
First published on 4th December 2017
Abstract
A simple procedure based on anion exchange was employed for the enantiomeric resolution of the extended metal atom chain (EMAC) [Co3(dpa)4(MeCN)2]2+. Use of the chiral salt (NBu4)2[As2(tartrate)2], (Λ-1 or Δ-1), resulted in the selective crystallization of the EMAC enantiomers as [Δ-Co3(dpa)4(MeCN)2](NBu4)2[Λ-As2(tartarte)2]2, (Δ-2) and [Λ-Co3(dpa)4(MeCN)2](NBu4)2[Δ-As2(tartrate)2]2 (Λ-2), respectively, in the P4212 space group, whereas a racemic mixture of 1 yielded [Co3(dpa)4(MeCN)2][As2(tartrate)2]·2MeCN (rac-3), which crystallized in the C2/c space group. The local electronic and magnetic structure of the EMAC enantiomers was studied, exploiting a variety of dichroisms in single crystals. A strong linear dichroism at the Co K-edge was observed in the orthoaxial configuration, whereas it vanished in the axial orientation, thus spectroscopically confirming the D4 crystal symmetry. Compounds Δ-2 and Λ-2 are shown to be enantiopure materials as evidenced by mirror-image natural circular dichroism spectra in the UV/vis in solution and in the X-ray range at the Co K-edge in single crystals. The surprising absence of detectable X-ray magnetic circular dichroism or X-ray magnetochiral dichroism signals at the Co K-edge, even at low temperature (3 K) and a high magnetic field (17 T), is ascribed to a strongly delocalized spin density on the tricobalt core.
Introduction
Extended Metal Atom Chains (EMACs) are a fascinating class of linear polynuclear coordination complexes, which have served as a rich playing field for the study of metal–metal bonding, magnetism and electrical conductivity.1 In addition, most EMACs demonstrate helicoidal chirality arising from steric hindrance between the protons in the 3-position of the pyridine groups (Chart 1). These complexes almost exclusively crystallize as racemates, and chiral resolution has been accomplished in only a few isolated cases. For example, spontaneous resolution afforded crystals of homochiral [Co3(dpa)4(MeCN)2](PF6)2·MeCN·2Et2O (where dpa = the anion of 2,2′-dipyridylamine), but only as a minor product.2 These crystals were then painstakingly separated using X-ray diffraction to determine the handedness of each crystal, in order to then obtain circular dichroism (CD) measurements on an enantiopure sample. In another study, homochiral samples of a mixture of [Ni3(dpa)4Cl2] and [Ni3(dpa)4ClOH] were obtained by chromatographic separation on a chiral stationary phase, while the cobalt and chromium analogues were unstable to chromatography.3 More recently, naphthyridine ligands incorporating a chiral camphorsulfonyl group were conceived for the enantiopure synthesis of Ni5 chains.4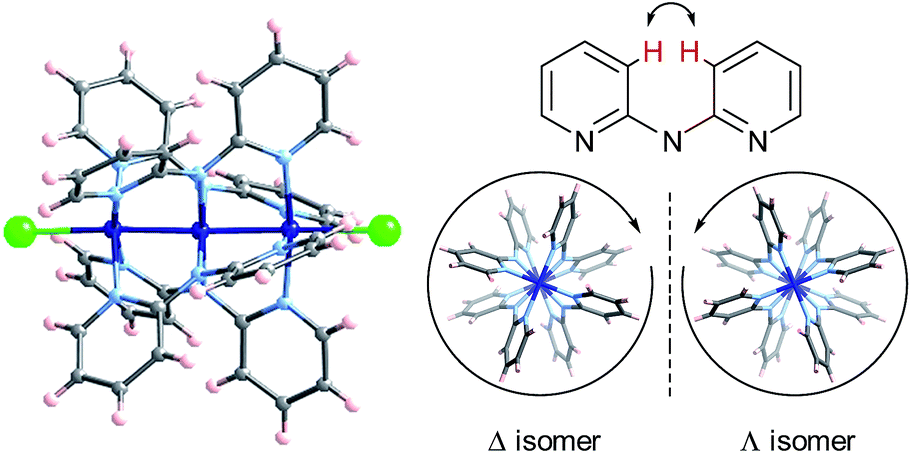 | ||
| Chart 1 (Left) Crystallographic model of [Co3(dpa)4Cl2]; cobalt (dark blue), nitrogen (pale blue), chloride (green), carbon (gray), hydrogen (pink). (Right) Helicoidal wrapping of the dpa− ligands; arrow indicates H-atom repulsions. | ||
The helicoidal chirality found in EMACs has several interesting features. UV/vis circular dichroism and polarimetry studies showed that the above-mentioned enantiomers of tricobalt, trinickel and pentanickel EMACs do not interconvert in solution, which is rather unusual for labile first-row transition metal complexes. This can be ascribed to a high energy barrier to racemization engendered by the polynuclear helix. Moreover, the optical activity for an acetonitrile solution of the mixture of nickel EMACs obtained by chromatography was found to be remarkably high, with a specific rotation of [α]22D ≈ ±5000 deg mL g−1 dm−1.3b This value is on the same order of magnitude as that of the helicenes, the current record-holders for high specific rotation.5
Natural circular dichroism, first observed in 1895 by Aimé Cotton, is one of the most powerful tools for obtaining stereochemical information. Circular dichroism measurements have been only recently extended to X-ray absorption spectroscopy, which is inherently element selective. It was first achieved for X-ray magnetic circular dichroism (XMCD), which has become a workhorse technique for the exploration of the magnetic properties of absorbing atoms in magnetic materials. The first observation of X-ray Natural Circular Dichroism (XNCD) was made in 1998 on single crystals of α-LiIO3 and Na3[Nd(digly)3]·2NaBF4·6H2O.6 Since then, a few other molecular systems have been studied, such as [Co(en)3Cl3]·NaCl·6H2O and the 1D coordination polymers [Co(hfac)2NITPhOMe]∞ and [Ln(Hnic)(nic)2(NO3)]∞.7 Even though it is still in its infancy, this spectroscopy appears to be a very sensitive probe of the chiral molecular environment around the absorbing atom. An important aspect of XNCD originates from a not well-known electric dipole-electric quadrupole mechanism that exists only in oriented samples. Moreover, it can only be observed in crystals belonging to one of 13 noncentrosymmetric crystal point groups.8 Unfortunately, the electric dipole-magnetic dipole mechanism that is dominant in UV/vis natural circular dichroism, and which is observable in isotropic chiral media, vanishes in core-level X-ray spectroscopy. From this perspective, a related phenomenon, X-ray magnetochiral dichroism (XMχD), i.e. the propensity of chiral paramagnetic systems to exhibit a differential absorption of unpolarized light in the presence of a magnetic field is more appealing. This peculiar type of dichroism is due to orbital toroidal currents, which are relevant to many phenomena, ranging from multiferroicity to superconductivity. In the X-ray range, this effect has been unambiguously demonstrated in only two cases: in chromium oxide,9 and more recently in [Co(hfac)2NITPhOMe]∞.7b In addition to these dichroic effects, there exists also X-ray natural linear dichroism (XNLD), which directly measures the anisotropy of the electronic states of an absorbing atom.
Due to the attractive optical3b and magnetic properties1 of EMACs, a general method for their enantiomeric resolution is highly desirable. In the present investigation, we have chosen to study tricobalt complexes supported by 2,2′-dipyridylamine ligands, not only due to their preparative ease and air-stability in the solid state, but also for their interesting magnetic properties. Indeed, the electronic structure of tricobalt EMACs has been extensively studied, primarily due to the observation that several [Co3(dpa)4X2] derivatives display a temperature-induced S = 1/2 to 3/2 spin-crossover (SCO).1c,10 DFT calculations reveal that, in the ground state, one unpaired electron is delocalized over three equidistant cobalt centers in a metal-based σnb molecular orbital.11 It is thought that SCO can then proceed by two different mechanisms, characterized by the retention or loss of the symmetry in the {Co3} core.1,12
Our synthetic approach takes advantage of the dicationic character of [Co3(dpa)4(MeCN)2]2+,2 which permitted the selective precipitation of each of the enantiomers in association with an enantiopure chiral anion. As this method involves a straightforward anion exchange reaction, it is not necessary to rely on serendipity or to synthesize chiral ligands. For this work, we have chosen a pair of chiral arsenyl dianions, based on inexpensive and easily available tartaric acid.13 Such D2-symmetric As(III), as well as Sb(III), tartrate adducts have been widely used in chiral HPLC separations14 and enantiopure crystallization15 of metal complexes, and different mechanistic explanations for the chiral recognition of octahedral metal complexes have been proposed.16 It is worth mentioning that potassium antimonyl tartrate is commercially available, but its low solubility in organic solvents precluded its use.
We present here results on the use of the lipophilic arsenyl tartrate salt, (NBu4)2[As2(tartrate)2] (Δ-1 and Λ-1) in the resolution of [Co3(dpa)4(MeCN)2]2+ enantiomers. Chiral compounds so-obtained were optically, structurally and magnetically characterized and were found to display a space group and a magnetic ground state compatible with the demonstration of X-ray natural and magnetochiral optical activity. Results of thorough polarization dependent X-ray spectroscopic studies performed at the Co K-edge reveal large XNCD and XNLD signals, but only vanishingly small XMCD and XMχD signals, likely due to the strongly delocalized nature of the magnetization on the tricobalt core.
Results and discussion
Synthesis and characterization
The tricobalt EMAC salt [Co3(dpa)4(MeCN)2](BF4)2 was formed in situ by stirring an acetonitrile solution of [Co3(dpa)4Cl2]17 and 2 eq. of AgBF4 for several hours. After filtration to remove AgCl, 1 eq. of Δ-1 or Λ-1 dissolved in MeCN was added to the filtrate and stirred for 1 h, yielding a deep green precipitate. The solid was isolated by filtration and re-dissolved in MeCN. Vapor ether diffusion into the acetonitrile solutions gave green plates (fast crystallization) and/or blocks (slow crystallization) of [Δ-Co3(dpa)4(MeCN)2](NBu4)2[Λ-As2(tartrate)2]2·solvent, (Δ-2), or [Λ-Co3(dpa)4(MeCN)2](NBu4)2[Δ-As2(tartrate)2]2·solvent, (Λ-2), after 2 days in ca. 40% yield. This yield is quite satisfactory, considering a maximum yield of 50%, given that the starting [Co3(dpa)4(MeCN)2](BF4)2 is racemic and the enantiomers are not expected to interconvert in acetonitrile (vide infra).2 [rac-Co3(dpa)4(MeCN)2][As2(tartrate)2]·2MeCN (rac-3) was also obtained by a similar reaction, using a racemic mixture of (NBu4)2[As2(tartrate)2] 1, and crystallized directly from acetonitrile upon standing in 95% yield.The stoichiometry of 2 is unexpected, the simplest formula being the binary salt [Co3(dpa)4(MeCN)2][As2(tartrate)2]. Instead, the compounds consist of one cobalt complex, two tetrabutylammonium cations and two arsenate dianions. The unusual stoichiometry may be explained by the 2-fold excess of 1 used in this anion exchange protocol. However, when 0.5 eq. of Δ or Λ-(NBu4)2[As2(tartrate)2] was used, the resulting green precipitate could not be subsequently crystallized and powder diffraction indicated that the polycrystalline precipitate was not isostructural with 2 (Fig. S11†).
The crystal structures of Δ-2 and Λ-2 were successfully solved and refined in the non-centrosymmetric P4212 space group, with Flack parameters of −0.008(2) and −0.002(2), respectively (Table 1). The [Co3(dpa)4(MeCN)2]2+ moieties are parallel to one another and are arranged so that the metal axes lie along the c crystal direction (Fig. 1). The arsenyl tartrate anions nestle in the voids between the molecular layers, with distances of 3.22 and 3.11 Å between the CO− group of the arsenyl tartrate and the axial MeCN and one pyridyl group of the EMAC, respectively (Fig. S4†). Notably, [Δ-As2(tartrate)2]2− crystallizes exclusively with [Λ-Co3(dpa)4(MeCN)2]2+ and vice versa; here, the Δ and Λ notation refers to the handedness of the tricobalt helix. The Co–Co distances are identical, due to a 2-fold axis bisecting the central cobalt ion. Bond distances and angles are typical of the starting materials and show no unusual features (Tables S1 and S2†).
| Δ-2 | Λ-2 | rac-3 | |
|---|---|---|---|
| a Solvent molecules of crystallization are not included in the empirical formula. b R 1 = Σ||Fo| − |Fc||/Σ|Fo|. c wR2 = [Σ[w(Fo2 − Fc2)2]/Σ[w(Fo2)2]]1/2, w = 1/σ2(Fo2) + (aP)2 + bP, where P = [max(0 or Fo2) + 2(Fc2)]/3. | |||
| T/K | 120 | 120 | 120 |
| Empirical formulaa | C92H118As4Co3N16O24 | C92H118As4Co3N16O24 | C56H48As2Co3N16O12 |
| fw | 2308.49 | 2308.49 | 1463.73 |
| Space group | P4212 (#90) | P4212 (#90) | C2/c (#15) |
| a/Å | 20.6481(10) | 20.6668(10) | 17.794(4) |
| b/Å | 20.6481(10) | 20.6668(10) | 19.121(4) |
| c/Å | 16.8896(9) | 16.8568(9) | 19.042(4) |
| β/° | 90 | 90 | 116.941(15) |
| V/Å3 | 7200.8(8) | 7199.8(8) | 5776(2) |
| Z | 2 | 2 | 4 |
| d (calc., g cm−3) | 1.065 | 1.065 | 1.683 |
| μ (mm−1) | 1.309 | 1.309 | 2.067 |
| R indices (all data) | R 1 = 0.0223, wR2c = 0.0512 | R 1 = 0.0353, wR2c = 0.0784 | R 1 = 0.0324, wR2c = 0.0693 |
| GooF on F2 | 1.070 | 1.052 | 1.061 |
| Flack parameter | −0.008(2) | −0.002(2) | — |
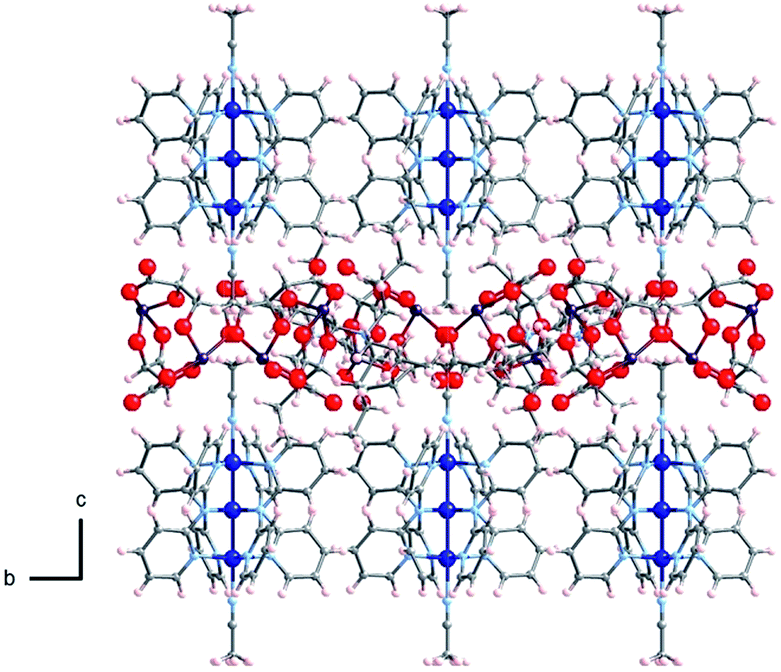 | ||
| Fig. 1 Arrangement of 2 in the crystal viewed along the crystalline a axis; Co: dark blue, As: violet, O: red, N: light blue, C: gray, H: pink. | ||
The electron density of the interstitial solvent molecules was highly diffuse and could not be satisfactorily modeled. Refinement of the structures without solvent molecules gave values of R1 (all data) = 0.0553 and 0.0591 for Δ-2 and Λ-2, respectively. The Platon Squeeze procedure18 calculated one void space per unit cell (Fig. S7†), accounting for 39% of the total unit cell volume and containing about 550 electrons. The electron count corresponds to approximately twelve diethylether molecules per unit cell, or six ether molecules per formula unit (Z = 2). Successful re-refinement of the structure yielded R1 (all data) = 0.0223 and 0.0353 for Δ-2 and Λ-2, respectively. Thermogravimetric analysis (TGA) on a freshly filtered sample (Fig. S12†) showed a mass loss of approximately 11%, corresponding to ca. four molecules of diethylether per formula unit. Mass loss begins even at room temperature, accounting for the discrepancy between the number of solvent molecules estimated by X-ray diffraction and TGA. Solvent loss was also observed in the loss of crystallinity during attempted data collection at 280 K. As the void space is continuous in the ab plane, the solvent is not only highly mobile within the crystal, but can easily escape the crystal as well.
Compound rac-3 crystallizes in the centrosymmetric C2/c space group and contains both enantiomers of the cations and anions. The Δ and Λ forms are segregated and contrary to the heterochiral interactions seen in Δ-2 and Λ-2, anions and cations of the same chirality associate with each other in 3 (Fig. S5†), with distances of 3.14 and 3.12 Å between an As-coordinated O atom of the arsenyl tartrate and an axial MeCN and one pyridyl group of the EMAC, respectively (Fig. S6†).
The chirality of Δ-2 and Λ-2 was first confirmed by UV/vis circular dichroism spectroscopy in acetonitrile solution (Fig. 2). Between 250 and 650 nm, the spectra plotted as Δε vs. λ are similar, but ca. 4× more intense, to those reported by Cotton and coworkers for the spontaneously resolved [Co3(dpa)4(MeCN)2](PF6)2 enantiomers,2 although the ε vs. λ values in the absorption spectra were found to be similar. The arsenyl tartrate peaks below 250 mn are masked by the much more intense peaks from the [Co3(dpa)4(MeCN)2]2+ moiety in the same area.19
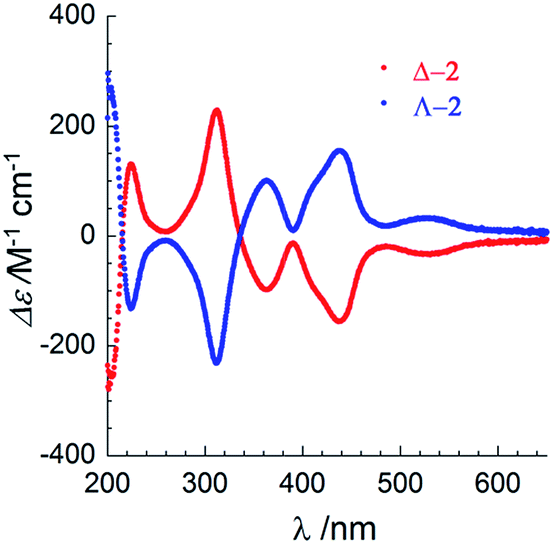 | ||
| Fig. 2 UV-visible circular dichroism spectra of Δ-2 (red) and Λ-2 (blue) between 200–650 nm in acetonitrile solution at room temperature. | ||
Given that the circular dichroism spectra were measured separately, yet exhibit the same amplitude with opposite sign, fast racemization in solution can be excluded. A CD spectrum on a MeCN solution of Δ-2 was obtained after preparation, and again after 8 days at r.t. No loss of peak intensity was observed (Fig. S17†). Finally, the potential for chemical manipulation of 2 without loss of enantiopurity was demonstrated by exchanging the arsenyl tartrate anions with PF6− anions on a sample of Δ-2. Recrystallization from acetonitrile and diethyl ether yielded crystals of [Δ-Co3(dpa)4(MeCN)2](PF6)2·MeCN·Et2O, as previously obtained by Cotton et al. by spontaneous resolution (Table S4, Fig. S8 and S9†).2 Circular dichroism spectroscopy in MeCN of [Δ-Co3(dpa)4(MeCN)2](PF6)2 revealed slightly less intense peaks compared to those of Δ-2, and no evolution after 5 days (Fig. S18†), demonstrating that the chirality of the compound is maintained in solution, even in the absence of chiral anions.
To investigate potential SCO properties in Δ-2 and Λ-2, the magnetic susceptibility was evaluated between 1.85 and 320 K in a 0.1 T applied field (Fig. 3 and S13†). Both compounds show a constant χT product at about 0.50 cm3 K mol−1 between 5 and 200 K, close to what is expected for an S = 1/2 system with g = 2.4 (0.54 cm3 K mol−1), typical of other trinuclear cobalt EMACs.1c,2 Above 200 K, the χT product increases gradually, as the signature of a SCO process, which becomes irreversible above 320 K as a sign of decomposition, involving most likely the loss of the interstitial solvent molecules. Low temperature magnetization curves plotted vs. HT−1, were superimposable, and a fit of these data at 1.9 K to the S = 1/2 Brillouin function, gave g = 2.3(1) for Δ-2 and g = 2.2(1) for Λ-2 (Fig. S13†). The uncertainty in these two values is due to the inevitable doubt regarding the molecular weight of the samples because of interstitial solvent loss. Altogether, these results suggest that the delocalized 2Ag state proposed by theory is the main contribution to electronic structure of 2 at all relevant temperatures.
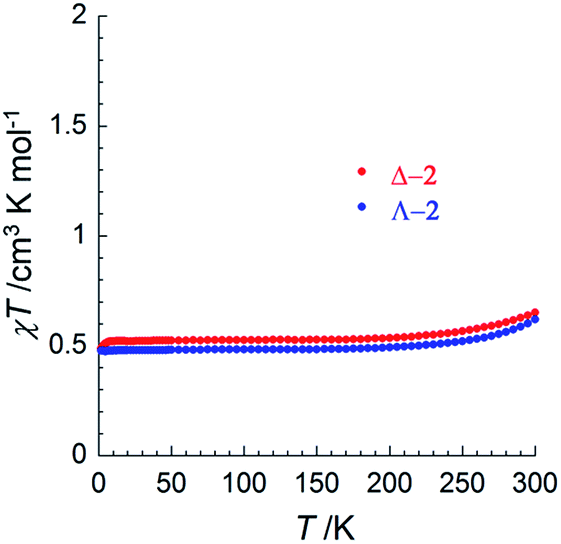 | ||
| Fig. 3 Temperature dependence of the χT product for Δ-2 (red) and Λ-2 (blue) at 0.1 T, where χ is the magnetic susceptibility defined as M/H per mole of complex, with M being the magnetization and H the applied magnetic field. | ||
X-ray absorption
To investigate the local chiral and magnetic properties of Δ-2 and Λ-2 we have performed thorough polarization dependent X-ray spectroscopy studies at the Co K-edge on single crystals. The experiments were carried out at the ID12 beamline of the European Synchrotron Radiation Facility, which is dedicated to such studies in the hard X-ray range. As Δ-2 and Λ-2 are chiral paramagnets, four different types of dichroisms in X-ray absorption are allowed by symmetry: X-ray Natural Linear Dichroism (XNLD) and X-ray Natural Circular Dichroism (XNCD), while application of an external magnetic field also permits X-ray Magnetic Circular Dichroism (XMCD), and X-ray Magneto-Chiral Dichroism (XMχD). If σH+,L represents the cross-section measured with left circularly polarized X-rays (L) in an external magnetic field parallel (H+) to the X-ray propagation vector (and similar obvious definitions for right circular polarization and an antiparallel magnetic field), the three dichroic cross-sections making use of circular polarization are defined by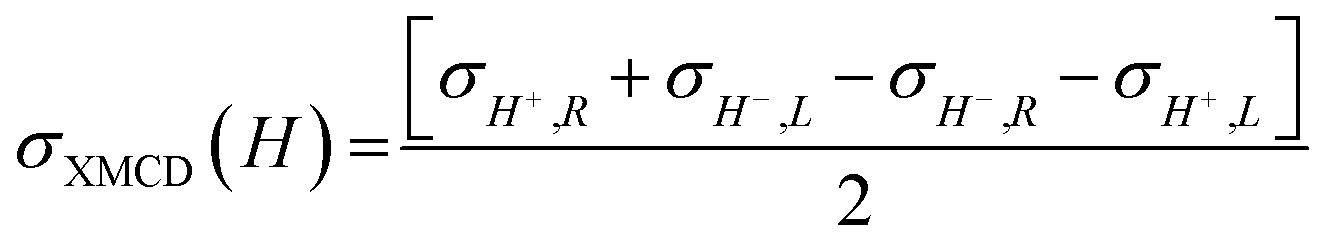 | (1) |
 | (2) |
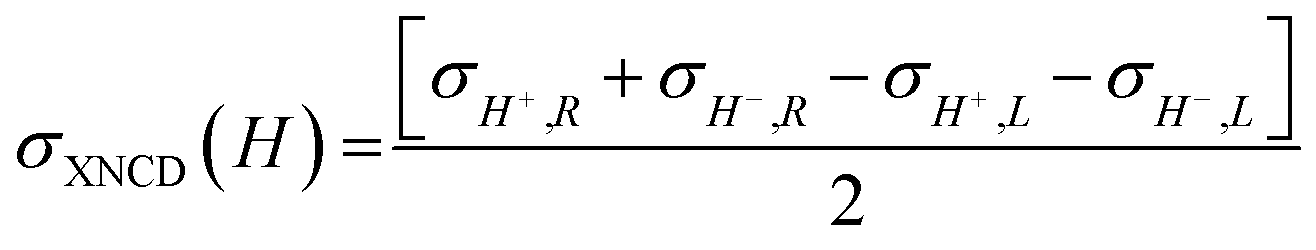 | (3) |
It should be mentioned that σXNCD(H), being independent of the magnetic field, is usually measured for H = 0. These three dichroic cross-sections are independent from each other and provide information on the electronic and magnetic structures of the element-specific absorbing atoms.
Our first experiment was an attempt to measure σXMCD. A single crystal of Δ-2 was cooled down to 3 K and placed in the bore of a superconducting solenoid providing a magnetic field up to ±17 T. Absorption spectra were collected using circularly polarized X-rays where the propagation vector of the X-rays, as well as the magnetic field, were aligned along the c axis of the Δ-2 crystal. In the present experiment, the XMCD signal was too weak to be detected, even under an applied magnetic field of 17 T (Fig. S14†). From the noise level in the XMCD spectra, we could only give an estimated upper limit of the signal, <0.2%, with respect to the edge jump. Whenever a crystal exhibits X-ray natural circular dichroism, the true XMCD signal can be obtained only as a combination of four X-ray absorption spectra measured independently (eqn (1)). In our case, the XMCD signal can be seen as the difference between two XNCD signals measured with opposite directions of applied magnetic field, σXMCD(H) = σXNCD(H+) − σXNCD(H−). Since the crystals are chiral, both σXNCD(H+) and σXNCD(H−) are “large” with similar intensities, so one indeed expects the XMCD signal to be difficult to detect. On the other hand, the magnetic moment of Δ-2 and Λ-2 originating from the three metal–metal bonded cobalt atoms is quite small. Out of the 21 3d electrons, all are paired, except for one that lies in a highly delocalized SOMO with σnb symmetry.11 With three cobalt atoms and a maximum magnetic moment of 1 μB, and no 3d density on the central cobalt atom due to symmetry reasons, an individual cobalt atom carries a maximum moment of 0.5 μB. In addition to the small average magnetic moment, DFT calculations on the parent dichloride derivative showed that the SOMO presents substantial density on the chlorine atoms, reducing even further the average magnetic polarization of the cobalt atoms.12 This can be compared to more common situations where high-spin divalent cobalt atoms carry a spin magnetic moment of 3 μB with some additional orbital magnetic moment.7b,20 When comparing with previous Co K-edge XMCD data from literature, e.g. Co2+ ions in a ZnO crystal, a simple cross-multiplication suggests that the expected intensity for XMCD in sample 2 cannot be larger than 2 × 10⁻⁴ of the XAS spectra.20a This small signal would already be quite difficult to measure in non-chiral crystals, but in the present case it is completely obscured by the presence of the XNCD signals that, as we will show, are as large as 2% of the XAS cross-sections.
In order to check for the absence of structural distortions in these crystals, we further performed X-ray Natural Linear Dichroism (XNLD) measurements (Fig. 4). In non-cubic crystals possessing a symmetry axis of an order larger or equal to three, the XNLD signal is measured by
| σXNLD = σ⊥ − σ∥ |
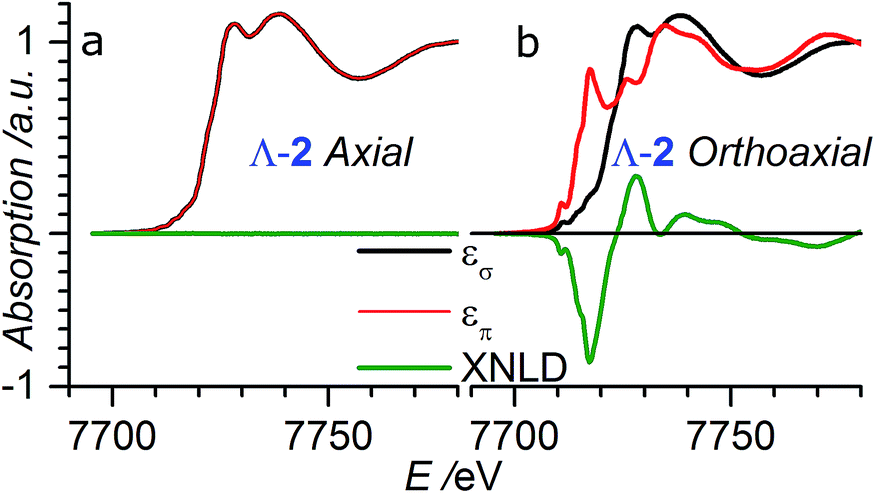 | ||
| Fig. 4 XANES and XNLD spectra obtained with linearly polarized X-rays for (a) axial (θ = 0°) and (b) orthoaxial (θ = 90°) configurations. | ||
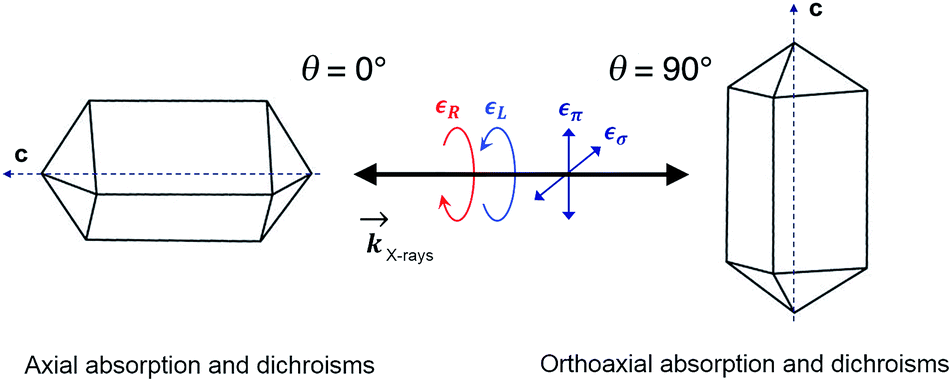 | ||
| Scheme 1 Schematic diagram of the measurement geometry showing the relationship between the tetragonal crystal axes and the direction and polarization of the X-ray beams. Axial geometry corresponds to the X-ray wavevector being parallel (θ = 0°) to the crystal c axis whereas in the orthoaxial configuration the X-ray propagation direction is perpendicular to the optical axis of the crystal. | ||
In order to verify that the crystals of Δ-2 and Λ-2 exhibit the expected chirality, we performed XNCD for several crystals of both enantiomers using circularly polarized X-rays (Fig. 5a). Whenever the spectra are recorded under an applied magnetic field or the sample has a finite magnetization, the true XNCD spectra should be calculated as a half-sum of the difference of the absorption spectra obtained with left and right circular polarizations for two directions of the applied magnetic field (see eqn (3)). Since the XNCD is independent of magnetic field and our samples are not magnetically ordered, the true XNCD signal is given by σL–σR. Here the experiments were performed without an applied magnetic field and the XNCD spectra were calculated as the difference of the absorption spectra obtained with left and right circular polarizations. As shown in Fig. 5a, with the crystal c axis mounted parallel to the incident X-ray beam (θ = 0°), the cobalt enantiomers in Δ-2 and Λ-2 display the expected mutual mirror-image symmetry. The axial XNCD signals are rather large, with intensities up to about 2% of the absorption cross-section. Given that the intensity of the XNCD signals are equivalent for both enantiomers over several measured samples, we can conclude that the crystals are effectively enantiopure.
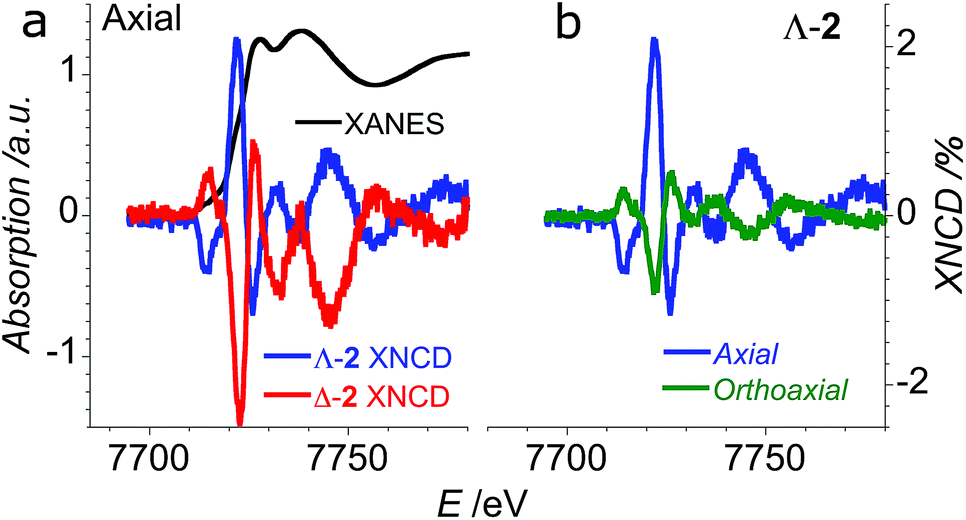 | ||
| Fig. 5 (a) XANES (black) and XNCD spectra obtained in axial configuration (θ = 0°) for Δ-2 (red) and Λ-2 (blue); (b) comparison of axial (blue) and orthoaxial (green) XNCD spectra for an oriented crystal of Λ-2. | ||
X-ray natural circular dichroism stems from the interference terms which mix multipole transitions of opposite parity: the electric dipole–electric quadrupole, i.e. 1 s → (p,d) in the case of the K-edge. As one can see from Fig. 5, the XNCD spectrum in 2 covers a wide energy range (more than 50 eV above the absorption edge), indicating that spatially extended d orbitals in the continuum hybridized with p-states of the Co atom also contribute, together with more localized 3d–4p orbitals.
As opposed to its analogue in the visible range, XNCD has a more complicated angular dependence and is observable only in 13 non-centrosymmetric crystal point groups. For the point group D4, symmetry requires that the angular dependence of XNCD varies as a function of a single spectral shape, σXNCD multiplied by the angular factor (3![[thin space (1/6-em)]](https://www.rsc.org/images/entities/char_2009.gif) cos2θ − 1), where θ is the polar angle between the crystal c axis, the optical axis, and the wave vector
cos2θ − 1), where θ is the polar angle between the crystal c axis, the optical axis, and the wave vector ![[k with combining right harpoon above (vector)]](https://www.rsc.org/images/entities/i_char_006b_20d1.gif) .21 This dependence can be indeed observed in the XNCD spectra when varying the θ angle (Fig. S15†), and is best observed by plotting the XNCD signals for axial θ = 0° and orthoaxial θ = 90° configurations (Fig. 5b) where one observes that σXNCD (θ = 90°) = −1/2 σXNCD (θ = 0°), as expected for the angular dependence of (3cos2θ − 1) predicted by group theory.
.21 This dependence can be indeed observed in the XNCD spectra when varying the θ angle (Fig. S15†), and is best observed by plotting the XNCD signals for axial θ = 0° and orthoaxial θ = 90° configurations (Fig. 5b) where one observes that σXNCD (θ = 90°) = −1/2 σXNCD (θ = 0°), as expected for the angular dependence of (3cos2θ − 1) predicted by group theory.
Circularly polarized light is the 90° phase-shifted sum of vertical and perpendicular polarizations. When θ = 90°, half of the circularly polarized X-rays is parallel to the crystalline c axis, and half is perpendicular. Accordingly, the XANES spectrum obtained with circularly polarized light is equivalent to the averaged spectra obtained from horizontal and vertical polarization (Fig. S16†). Conversely, when θ = 0°, the circular polarization of X-rays is always perpendicular to the c axis and is thus equivalent to the case with θ = 90° under horizontal linear polarization (Fig. S16†).
In the XMCD experiments, all four spectra σH+,L, σH−,L, σH+,R and σH−,R have been recorded, and it is thus also possible to extract the X-ray magneto-chiral dichroism. It was however found that σXMχD cannot be distinguished from the background noise (Fig. S14†). For XMχD to be present at the K-edge, one needs both a large orbital magnetic polarization of the absorbing atom and a strong p–d orbital hybridization. The p–d hybridization is present, as demonstrated by XNCD signal that is larger than 1% between the pre-edge feature up to 25 eV above the main rising edge. On the other hand, the rather small magnetic polarization that already precluded us from measuring a sizeable XMCD effect is very likely responsible for the absence of detectable magnetochiral effect.
Conclusions
We have used the chiral anion [As2(tartrate)2]2− to easily resolve racemic mixtures of [Co3(dpa)4]2+ cations by selective crystallization. Both EMAC enantiomers crystallize as [Co3(dpa)4(MeCN)2](NBu4)2[As2(tartrate)2]2 in the non-centrosymmetric space group P4212 with Flack parameters statistically equal to zero. The chiral EMACs display persistent optical activity in solution, as evidenced by mirror-image circular dichroism spectra in MeCN. Single crystals of [Co3(dpa)4(MeCN)2](NBu4)2[As2(tartrate)2]2 furthermore display substantial optical activity in the hard X-ray range, giving mirror-image X-ray natural circular dichroism at the cobalt K-edge. The angular dependence of the XNCD and XNLD spectra is consistent with what is expected for a system with D4 symmetry. Unfortunately, the strongly delocalized nature of the magnetism in these systems did not allow us to record XMCD and XMχD signals even under an applied magnetic field of 17 T. Nonetheless, these results demonstrate that polarized X-rays provide an original approach for the investigation of chirality and symmetry in single crystals.We are now examining the efficacy of our synthetic method for the separation of chiral EMACs with higher nuclearity and different metal centers (e.g. chromium, nickel and copper). With potentially higher specific rotation with increasing nuclearity, ground states with a larger magnetic moment, and catalytically active axial sites, chiral EMACs open interesting perspectives in non-linear optics, magneto-optical effects and asymmetric synthesis.
Experimental section
Materials and methods
All manipulations were carried out under dry nitrogen or argon using standard drybox or Schlenk techniques. Tetrahydrofuran, dichloromethane, diethyl ether and acetonitrile were purified using an Innovative Technologies solvent purification system. CoCl2 was purchased from Fisher Chemicals and dried for several days at 130 °C before use. 2,2′-Dipyridylamine was purchased from Aldrich and recrystallized in hexane. AgBF4 was purchased from Strem Chemicals and stored in a nitrogen glovebox. [Co3(dpa)4Cl2],15 Δ-1 and Λ-119 were prepared as reported elsewhere.Synthesis
Physical measurements
CHNS elemental analyses were performed by the Service d'Analyse Elementaire in Nancy. IR spectra were measured on a Nicolet 6700 FT-IR equipped with a SMART iTR™ accessory. Magnetic susceptibility measurements were obtained using a Quantum Design MPMS-XL SQUID magnetometer. The measurements were performed on a polycrystalline sample of Δ-2 (35.9 mg) or Λ-2 (16.7 mg) introduced in a polyethylene bag (3 × 0.5 × 0.02 cm). The dc measurements were conducted from 400 to 1.8 K at 0.1 and 1 T applied dc field. An M vs. H measurement was performed at 100 K to confirm the absence of ferromagnetic impurities. CD spectra in solution were obtained on a Jasco J-815 spectrophotometer. The measurements were made on samples with a 1.72 × 10⁻⁵ M and 1.62 × 10⁻⁵ M concentration for Δ-2 and Λ-2, respectively. These samples were prepared by dissolving either 0.992 mg of Δ-2 or 0.936 mg of Λ-2 in 25 mL of MeCN. Class A volumetric flasks and a Mettler MX5 microbalance with an estimated weighting error of 2 μg were employed in the sample preparation. All spectra were measured with a scan speed of 50 nm min−1 and a 2 nm bandwidth. Data in millidegree were converted to the differential extinction coefficient (Δε) using the equation:where θ is the measured CD ellipticity in millidegrees, c is the concentration in mol L−1, and l is the pathlength of the cuvette in cm.
Crystallography
Crystals suitable for X-ray diffraction were selected under immersion oil in ambient conditions and attached to a MiTeGen microloop. The crystals were mounted in a stream of cold nitrogen at 120(2) K and centered in the X-ray beam using a video camera. Data collections were performed with Mo Kα (λ = 0.71073 Å) radiation on a Bruker Quazar SMART APEX II, operating at 50 kV and 30 mA using graphite monochromated radiation. The data were collected using a routine to survey reciprocal space, and reduction was performed using software included in Bruker Apex2 suite.22 The structures were solved using direct methods.23,24 Non-hydrogen atoms were refined anisotropically using weighted full-matrix least-squares on F2, followed by difference Fourier synthesis.25,26 All hydrogen atoms were included in the final structure factor calculation at idealized positions and were allowed to ride on the neighboring atoms with relative isotropic displacement coefficients. The Platon SQUEEZE routine18 was used to account for diffuse electron density arising from interstitial solvent, which could not be modeled atomistically. Powder X-ray diffraction data were recorded using a PANalytical X'Pert PRO MPD diffractometer with Bragg–Brentano geometry, Cu-Kα radiation (λ = 1.54184 Å) and a graphite back scattering monochromator, using glass capillaries.X-ray absorption
X-ray absorption experiments at the Co K-edge were carried out at the ID12 beamline of the European Synchrotron Radiation Facility (Grenoble, France), dedicated to polarization dependent X-ray spectroscopy in the 2–15 keV energy range. A high flux of circularly polarized photons was provided by an HELIOS-II undulator. X-rays were monochromatized by a Si 〈111〉 double crystal monochromator. Linearly polarized X-rays were obtained using a 0.9 mm thick diamond quarter wave plate inserted downstream with respect to the monochromator. For XNCD and XNLD studies, the samples were mounted on an aluminum sample holder and oriented so that the crystal's c axis and the photons wave vector formed an angle of 0° or 90°. All spectra were recorded at room temperature in total X-ray fluorescence yield detection mode in backscattering geometry. XNLD spectra were obtained by flipping the two orthogonal linear polarizations of the X-rays at every point of the energy scan. Each set of XNCD spectra were acquired by alternating the photon helicity after each spectrum 6 times, for a total of 12 absorption spectra.XMCD and XMχD spectra were obtained by also using the total fluorescence yield detection mode in backscattering geometry, but under an applied magnetic field. The samples were mounted on the cold finger of a constant-flow helium cryostat inserted in the bore of a superconducting solenoid producing a magnetic field up to 17 T. The temperature of the samples were kept at 3.1 K. Under these experimental conditions, the samples were magnetically saturated.
Conflicts of interest
There are no conflicts to declare.Acknowledgements
This work was supported by the CNRS, the University of Bordeaux, the Conseil Régional de la Nouvelle Aquitaine, the France Canada Research fund (PhD fellowship for AS), the European Union's Horizon 2020 research and innovation program under the Marie Sklodowska-Curie grant agreement No 706556 CHIMMM (Postdoctoral fellowship for MC), the Erasmus Mundus European program (PhD fellowship for VB), the ANR project CHIROTS ANR-11-JS07-013-01 (PR, PhD fellowship for AN), the European Synchrotron Radiation Facility (beamtimes CH-4171, CH-4457 and CH-5009), the GDR MCM-2 and the MOLSPIN COST action CA15128. The authors warmly thank K. Ollefs, F. Guillou, A. Hen, P. Voisin, M. Rouzières, L. Etienne and D. Denux for technical assistance and L. Falvello for useful discussions.References
- (a) S.-A. Hua, M.-C. Cheng, C.-h. Chen and S.-M. Peng, Eur. J. Inorg. Chem., 2015, 2510 CrossRef CAS; (b) M. Majumdar and J. K. Bera, Supramolecular and Self-Assembled Metal-Containing Materials, in Macromolecules Containing Metal and Metal-Like Elements, ed. A. Abd-El Aziz, C. E. Carraher, C. U. Pittman and M.Zeldin, John Wiley & Sons, Inc., 2009, vol. 9, pp. 182–253 Search PubMed; (c) J. F. Berry, in Multiple Bonds between Metal Atoms, ed. F. A. Cotton, C. A. Murillo and R. A. Walton, Springer U.S., 2005, pp. 669–706 Search PubMed.
- R. Clérac, F. A. Cotton, K. R. Dunbar, T. Lu, C. A. Murillo and X. Wang, Inorg. Chem., 2000, 39, 3065 CrossRef.
- (a) D. W. Armstrong, F. A. Cotton, A. G. Petrovic, P. L. Polavarapu and M. M. Warnke, Inorg. Chem., 2007, 46, 1535 CrossRef CAS PubMed; (b) M. M. Warnke, F. A. Cotton and D. W. Armstrong, Chirality, 2007, 19, 179 CrossRef CAS PubMed.
- C.-H. Yu, M.-S. Kuo, C.-Y. Chuang, G.-H. Lee, S.-A. Hua, B.-Y. Jin and S.-M. Peng, Chem.–Asian J., 2014, 9, 3111 CrossRef CAS PubMed.
- R. A. Pascal Jr and A. P. West Jr, Tetrahedron, 2013, 69, 6108 CrossRef.
- (a) J. Goulon, C. Goulon-Ginet, A. Rogalev, V. Gotte, C. Malgrange, C. Brouder and C. R. Natoli, J. Chem. Phys., 1998, 108, 6394 CrossRef CAS; (b) L. Alagna, T. Prosperi, S. Turchini, J. Goulon, A. Rogalev, C. Goulon-Ginet, C. R. Natoli, R. D. Peacock and B. Stewart, Phys. Rev. Lett., 1998, 80, 4799 CrossRef CAS.
- (a) B. Stewart, R. D. Peacock, L. Alagna, T. Prosperi, S. Turchini, J. Goulon, A. Rogalev and C. Goulon-Ginet, J. Am. Chem. Soc., 1999, 121, 10233 CrossRef CAS; (b) R. Sessoli, M.-E. Boulon, A. Caneschi, M. Mannini, L. Poggini, F. Wilhelm and A. Rogalev, Nat. Phys., 2015, 11, 69 CrossRef CAS PubMed; (c) I. Mihalcea, M. Perfetti, F. Pineider, L. Tesi, V. Mereacre, F. Wilhelm, A. Rogalev, C. E. Anson, A. K. Powell and R. Sessoli, Inorg. Chem., 2016, 55, 10068 CrossRef CAS PubMed.
- J. Goulon, C. Goulon-Ginet, A. Rogalev, G. Benayoun, C. Brouder and C. R. Natoli, J. Synchrotron Radiat., 2000, 7, 182 CrossRef CAS PubMed.
- J. Goulon, A. Rogalev, F. Wilhelm, C. Goulon-Ginet, P. Carra, D. Cabaret and C. Brouder, Phys. Rev. Lett., 2002, 88, 2374011 CrossRef PubMed.
- R. Clérac, F. A. Cotton, L. M. Daniels, K. R. Dunbar, K. Kirschbaum, C. A. Murillo, A. A. Pinkerton, A. J. Schultz and X. Wang, J. Am. Chem. Soc., 2000, 122, 6226 CrossRef.
- M.-M. Rohmer and M. Bénard, J. Am. Chem. Soc., 1998, 120, 9372 CrossRef CAS.
- M.-M. Rohmer, A. Strich, M. Bénard and J.-P. Malrieu, J. Am. Chem. Soc., 2001, 123, 9126 CrossRef CAS PubMed.
- D. Marcovich and R. E. Tapscott, J. Am. Chem. Soc., 1980, 102, 5712 CrossRef CAS.
- (a) S. Yamazaki and H. Yoneda, Inorg. Nucl. Chem. Lett., 1979, 15, 195 CrossRef CAS; (b) H. Nakazawa and H. Yoneda, J. Chromatogr., 1978, 160, 89 CrossRef CAS; (c) J. E. Harris, N. Desai, K. E. Seaver, R. T. Watson, N. A. Kane-Maguire and J. F. Wheeler, J. Chromatogr. A, 2001, 919, 427 CrossRef CAS PubMed.
- (a) B. D. Sarma Jr and J. C. Bailar, J. Am. Chem. Soc., 1955, 77, 5480 CrossRef; (b) U. Sakaguchi, K. Tomioka, T. Kashihara and H. Yoneda, Inorg. Chem., 1985, 24, 463 CrossRef CAS; (c) J. D. Harper, K. A. Kane-Maguire, L. A. P. Kane-Maguire and N. A. P. Kane-Maguire, Inorg. Chim. Acta, 1996, 249, 5 CrossRef.
- (a) A. Zalkin, D. H. Templeton and T. Ueki, Inorg. Chem., 1973, 12, 1641 CrossRef CAS; (b) T. Bark, A. von Zelewsky, D. Rappoport, M. Neuburger, S. Schaffner, J. Lacour and J. Jodry, Chem.–Eur. J., 2004, 10, 4839 CrossRef CAS PubMed; (c) K. Miyoshi, S. Izumoto, K. Nakai and H. Yoneda, Inorg. Chem., 1986, 25, 4654 CrossRef CAS; (d) K. Miyoshi, S. Izumoto and H. Yoneda, Bull. Chem. Soc. Jpn., 1986, 59, 3475 CrossRef CAS.
- F. A. Cotton, L. M. Daniels and G. T. Jordan IV, Chem. Commun., 1997, 421 RSC.
- A. L. Spek, Acta Crystallogr., Sect. C: Struct. Chem., 2015, 71, 9 CrossRef CAS PubMed.
- A. Naim, Y. Bouhadja, M. Cortijo, A. Valentín-Pérez, E. Duverger-Nédellec, H. D. Flack, E. Freysz, P. Guionneau, A. Iazzolino, A. Ould Hamouda, P. Rosa, O. Stefańczyk, and M. Zeggar, submitted.
- (a) V. Ney, B. Henne, J. Lumetzberger, F. Wilhelm, K. Ollefs, A. Rogalev, A. Kovacs, M. Kieschnick and A. Ney, Phys. Rev. B, 2016, 94, 224405 CrossRef; (b) B. Henne, V. Ney, J. Lumetzberger, K. Ollefs, F. Wilhelm, A. Rogalev and A. Ney, Phys. Rev. B, 2017, 95, 05446 CrossRef.
- C. R. Natoli, C. Brouder, P. Sainctavit, J. Goulon, C. Goulon-Ginet and A. Rogalev, Eur. Phys. J. B, 1998, 4, 1 CrossRef CAS.
- Bruker-AXS APEX2, SADABS, and SAINT Software Reference Manuals, Madison, Wisconsin, USA, 2009 Search PubMed.
- A. Altomare, M. C. Burla, M. Camalli, G. L. Cascarano, C. Giacovazzo, A. Guagliardi, A. G. G. Moliterni, G. Polidori and R. Spagna, J. Appl. Crystallogr., 1999, 32, 115 CrossRef CAS.
- G. M. Sheldrick, Acta Crystallogr., Sect. A: Found. Crystallogr., 2008, 64, 112 CrossRef CAS PubMed.
- O. V. Dolomanov, L. J. Bourhis, R. J. Gildea, J. A. K. Howard and H. Puschmann, J. Appl. Crystallogr., 2009, 42, 339 CrossRef CAS.
- L. J. Farrugia, J. Appl. Crystallogr., 2012, 45, 84 CrossRef.
Footnotes |
| † Electronic supplementary information (ESI) available: Bond distances and angles for 2 and 3, thermal ellipsoid plots, packing diagrams, PXRD data, magnetization curves, thermogravimetric analysis, and additional XNCD and XMCD plots and CD spectra. CCDC 1574514–1574516 and 1588703. For ESI and crystallographic data in CIF or other electronic format see DOI: 10.1039/c7sc04131d |
| ‡ Both authors contributed equally to this work. |
| This journal is © The Royal Society of Chemistry 2018 |