 Open Access Article
Guanine–oligothiophene conjugates: liquid-crystalline properties, photoconductivities and ion-responsive emission of their nanoscale assemblies†
Kian Ping
Gan
 ,
Masafumi
Yoshio‡
 *,
Yuki
Sugihara
 and
Takashi
Kato
 *
*
Department of Chemistry and Biotechnology, School of Engineering, The University of Tokyo, Hongo, Bunkyo-ku, Tokyo 113-8656, Japan. E-mail: kato@chiral.t.u-tokyo.ac.jp; Fax: +81-3-5841-8661; Tel: +81-3-5841-7440
First published on 24th October 2017
Abstract
We here report the supramolecular self-assembly of hydrogen-bonded motifs for the development of nanostructured materials that exhibit dynamic functions such as stimuli-responsive properties and molecular recognition behaviour. We have designed and synthesised new thermotropic bicontinuous and columnar liquid-crystalline (LC) guanine–oligothiophene conjugates tethered with lipophilic chains, which exhibit ionic, electronic and photoluminescence properties. Their potassium salt complexes self-assemble into thermotropic columnar LC phases. Time-of-flight photoconductivity measurements have revealed that the guanine–oligothiophene conjugates in the LC states possess charge transport abilities with either electron or ambipolar mobility values of 10−4 to 10−3 cm2 V−1 s−1. Furthermore, we have found that the complexation of potassium ions with the guanine motif could lead not only to structural change and thermal stabilization of the LC phases but also to a photoluminescence colour change in the solid states. The strategy presented in this work could lead to the design of new functional LC materials that could potentially be applicable as sensors and electronic devices.
Introduction
The use of supramolecular self-assembly of hydrogen-bonded motifs bearing π-conjugated moieties into nanofibers, nanoribbons, nanocoils, nanorings, liquid crystals, and other self-assembled structures has attracted attention as an emergent approach for the creation of electro- and photo-active advanced materials.1–9 The structural complexity and stimuli-responsive nature on the basis of dynamic and directional hydrogen bonds is expected to lead to innovations in their device applications. Amongst them, supramolecular liquid crystals2,3,8,10–24 that combine molecular order and fluidity appear to be one of the most promising platforms for exploring memory and sensor materials.15,20–23Here we report the development of charge-transporting and photoluminescent liquid-crystalline (LC) assemblies based on guanine–oligothiophene conjugates for the first time. Guanine derivatives are a type of hydrogen-bonded self-assembling motif with the versatile ability to form disk-like (Scheme 1a) or ribbon-like polymorphs (Scheme 1b and c).25 They are able to recognise alkali ions to form guanine tetramers (G-tetrad) which self-assemble to form columnar structures.25–33 These properties of guanine derivatives are intriguing for the design of new biomolecule-inspired materials.
We previously reported stimuli-responsive liquid crystals based on folic acid derivatives with a hydrogen-bonding pterin moiety that are structurally similar to guanine,34–39 with the main focus on the ion-responsive structural change of liquid crystals and ion-transport properties. However, guanine-based π-conjugated supramolecular liquid crystals for application in organic semiconductors and ion-responsive photoluminescent emitters remain unexplored. In addition, nucleobases such as guanine are also known to exhibit charge carrier transport in deoxyribonucleic acid (DNA) strands.40–51 As such, they have also been incorporated as a moiety in other molecules and exploited as semiconductors for various potential applications such as organic photovoltaic devices (OPVs)31 and organic field effect transistors (OFETs).52
In the present study, we designed a new family of guanine derivatives, 1, 2a, 2b, 3a and 3b, containing an N-9 alkyl chain and attached via wedge-shaped oligothiophenes at the C-8 position (Scheme 2). Oligothiophenes incorporating oligopeptide53,54 or nucleobase55,56 moieties have previously been explored for their self-assembly properties. Inspired by these studies, we envisioned that the π-conjugation between oligothiophenes and guanine moieties could lead to the induction of liquid crystallinity with a wide temperature range and charge transport properties. The ribbon-like to disk-like structural change of the guanine moieties could be induced with the introduction of alkali ions, which would alter the fluorescence response of the conjugates. These ion-responsive LC properties and emission colour tuning could lead to potential applications in new sensors and organic light emitting diode (OLED) devices.
Experimental section
Syntheses and characterisation
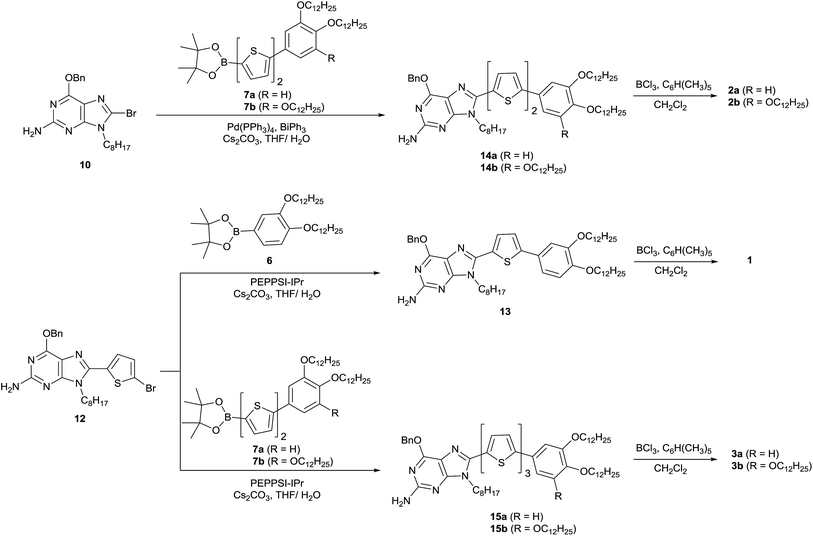
Five molecules consisting of N-9 alkylated guanine conjugated with phenylthiophene (1), phenylbithiophene (2a and 2b) or phenylterthiophene (3a and 3b) at the C-8 position of guanine were synthesised (Scheme 3) based on previously reported palladium-catalysed coupling reactions57 (ESI, Section 1†). The stereochemistry of N-9 alkylated 2-amino-6-benzyloxy-9-octylpurine (9), a precursor for the guanine–oligothiophene conjugates, was identified by a gHMBC 2D NMR experiment (ESI, Fig. S1†). The bithiophene-based guanine–oligothiophene conjugates were synthesised by a Suzuki–Miyaura cross-coupling reaction of the benzyl-protected N-9 alkylated guanine 10 with the n-dodecyloxy phenyl bithiophene pinacol esters 7a and 7b to afford the corresponding 14a and 14b, followed by BCl3/pentamethyl benzene cleavage of the benzyl group58 to afford the desired guanine–bithiophene derivatives 2a and 2b. The monothiophene- and terthiophene-based derivatives were synthesised using similar procedures. Suzuki–Miyaura coupling reactions of the benzyl-protected guanine 12 with the pinacol esters 6, 7a and 7b afforded 13, 15a and 15b, respectively. Cleavage of the benzyl protecting group afforded the desired guanine–oligothiophene derivatives 1, 3a and 3b. All of the final compounds were recrystallised to remove any residual ions. The molecular structures were characterised by 1H and 13C NMR spectroscopy, MALDI-TOF mass spectrometry and elemental analysis.Results and discussion
Liquid-crystalline properties
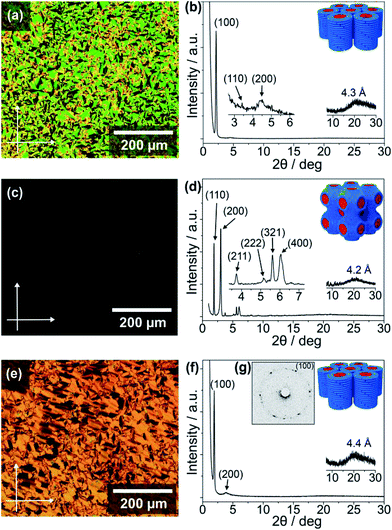
The thermotropic LC properties and wide-angle X-ray diffraction (WAXRD) data of the guanine–oligothiophene conjugates are summarised in Table 1. The transition temperatures were determined via differential scanning calorimetry (DSC) measurements (ESI, Section 3†). Polarising optical microscope (POM) images and WAXRD patterns are shown in Fig. 1 (ESI, Section 4† for lattice analyses of the LC phases).| Compounds | Phase transition behavioura | XRD data | |||||
|---|---|---|---|---|---|---|---|
| Cooling | Heating | T/°C | Lattice parameters/Å | ||||
| a Transition temperatures (°C) and transition enthalpies (kJ mol−1) in parentheses, deduced by DSC upon cooling and heating (10 K min−1). Iso, isotropic liquid; G, glassy; Cr and Cr’, crystal; Colh, hexagonal columnar phase; Cubbi, bicontinuous cubic phase. | |||||||
| 1 | Iso −30 G | G −28 Iso | — | — | |||
| 2a | Iso −16 G | G −12 Iso 118 | Cr 148 Iso | — | — | ||
| (−17) | (17) | ||||||
| 2b | Iso 205 | Colh −19 Cr | Cr −16 | Colh 210 Iso | 25 | 47.7 | |
| (1) | (11) | (11) | (1) | ||||
| 3a | Iso 122 | Cubbi 64 Cr | Cr 65 | Cubbi 143 | Cr′ 168 Iso | 100 | 58.9 |
| (7) | (4) | (4) | (−7) | (14) | |||
| 3b | Iso 225 | Colh −13 Cr | Cr −9 | Colh 231 Iso | 25 | 53.1 | |
| (1) | (10) | (10) | (1) | ||||
As determined by the DSC thermograms, POM photographs and XRD spectra, compounds 1 and 2a exhibit no observable mesogenic phase (ESI, Fig. S2a and S3a for the DSC traces, and Fig. S7a and S8a for the WAXRD patterns†). In contrast, the bithiophene-based compound 2b consisting of a fan-shaped tri(dodecyloxy)phenyl group exhibits a wide range of LC phase from 205 to −19 °C upon cooling (ESI, Fig. S4†). Observation under the POM shows the characteristic texture for a columnar phase that is in poly domain alignment between the glass substrates (Fig. 1a). The WAXRD patterns of 2b at 25 °C show three diffraction peaks at 41.3 (100), 25.8 (110), and 20.0 Å (200) (Fig. 1b) with a reciprocal d-spacing ratio of 1![[thin space (1/6-em)]](https://www.rsc.org/images/entities/char_2009.gif) :
:![[thin space (1/6-em)]](https://www.rsc.org/images/entities/char_2009.gif) √3
√3![[thin space (1/6-em)]](https://www.rsc.org/images/entities/char_2009.gif) :
:![[thin space (1/6-em)]](https://www.rsc.org/images/entities/char_2009.gif) 2, indicating the formation of a one-dimensional nanostructured hexagonal columnar (Colh) phase. The Colh structure is presumably stabilised by the stacking of G-tetrads formed through the N1H–O6 and N2H–N7 hydrogen bonds of guanine moieties, as discussed in a later section.
2, indicating the formation of a one-dimensional nanostructured hexagonal columnar (Colh) phase. The Colh structure is presumably stabilised by the stacking of G-tetrads formed through the N1H–O6 and N2H–N7 hydrogen bonds of guanine moieties, as discussed in a later section.
The terthiophene-based compound 3b containing a fan-shaped tri(dodecyloxy)phenyl group also forms the Colh phase in a wide temperature range from 225 to −13 °C on cooling (ESI, Fig. S6†). The POM observation of 3b at 25 °C shows a striated fan texture (Fig. 1e), which suggests that the phase possesses more order than that of 2b. The hexagonal order is clarified by the six-fold diffraction spots in the two-dimensional small-angle XRD (SAXRD) pattern (Fig. 1g), although the WAXRD pattern (Fig. 1f) notes the absence of a (110) peak and shows two peaks at 46.0 (100) and 23.1 Å (200) with a halo of 4.4 Å.
In contrast to 3b with three alkoxy chains the POM image for compound 3a, having two alkoxy chains, shows no observable birefringence (Fig. 1c). The WAXRD pattern of 3a at 100 °C reveals diffraction peaks at 46.5 (110), 29.5 (200), 23.8 (211), 17.2 (222), 15.7 (321), and 14.6 Å (400) (Fig. 1d and ESI, Section 4†). As compound 3a has a lower volume of hydrophobic parts compared to 3b, these diffraction peaks suggest that 3a forms a three-dimensional (3D) nanostructured cubic bicontinuous (Cubbi) phase with an Im3m lattice, which is quite rare for π-conjugated liquid crystals. The Cubbi phase of 3a is formed in a wide temperature range from 122 to 64 °C upon cooling (ESI, Fig. S5a†). This unexpected discovery of the Cubbi LC phase will open up new opportunities for charge carrier transport and photoluminescent materials.
Charge carrier transport
As mentioned earlier, guanine and other nucleobases are nature’s semiconductors. In this regard, conjugation between guanine and oligothiophenes could create materials that could potentially be applied as organic semiconductors. Therefore, the hole and electron charge carrier transport properties of the LC compounds 2b, 3a and 3b were examined using the time-of-flight (TOF) photoconductivity method. The LC samples were sandwiched in ITO cells and a potential bias was applied through the cell, followed by charge carrier generation by excitation from a laser pulse source. The charge carrier mobility values derived from the transient photocurrent curves (ESI, Fig. S10†) are plotted as a function of temperature in Fig. 2a for 3a and Fig. 2b for 2b and 3b.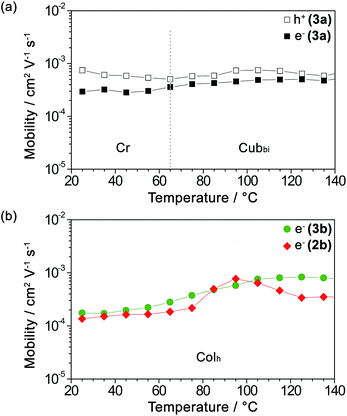 | ||
Fig. 2 Logarithmic plots of (a) the hole mobility ( ) and electron mobility ( ) and electron mobility ( ) of 3a and (b) the electron mobility of 3b ( ) of 3a and (b) the electron mobility of 3b ( ) and 2b ( ) and 2b ( ) as a function of temperature upon heating. ) as a function of temperature upon heating. | ||
We found that compound 3a exhibits ambipolar charge carrier transport properties with hole and electron mobility values in the order of 10−4 to 10−3 cm2 V−1 s−1 in the Cubbi phase and the Cr phase as well (Fig. 2a and ESI, Fig. S10a–c†), with the values of hole mobility slightly higher than those of the electron mobilities. In contrast, compounds 2b and 3b in their Colh phases possess only electron transport properties with electron mobility values of 10−4 to 10−3 cm2 V−1 s−1 (Fig. 2b and ESI, Fig. S10d–f†). The electron mobility of 3b increases with an increase in temperature. As for 2b, which has a shorter π-conjugation length, the electron mobility value reaches a maximum at 95 °C, possibly due to the formation of an optimal π-stacked molecular arrangement during the viscosity change upon heating.
On the other hand, the transient photocurrents of 2b and 3b obtained by applying a positive bias exhibit weak and dispersive signals, which is probably attributed to the hole trapping effect. It has been previously reported that guanine–guanine stacks in DNA strands serve as shallow hole traps,42–44,50 which have the effect of causing highly dispersive photocurrent curves for holes and dramatically decreasing the hole carrier transport.59
Molecular modelling study
In order to make sense of the carrier transport properties of the guanine–oligothiophene conjugates, the frontier molecular orbitals of the guanine–bithiophene conjugate 2b and guanine–terthiophene conjugate 3a were determined computationally (Fig. 3) using density functional theory (DFT).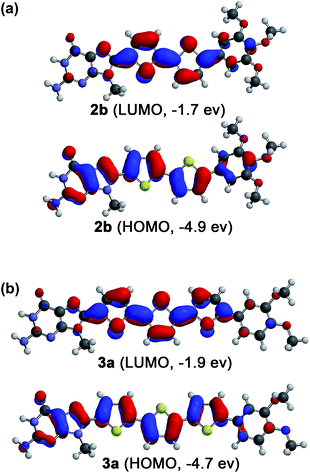 | ||
| Fig. 3 Computationally calculated HOMOs and LUMOs of phenylmethoxy- and N-9 methyl-substituted model compounds (a) for 2b and (b) for 3a by the DFT method with B3LYP/6-31G(d) parameters. | ||
The HOMOs for both molecules consist of contributions from both the oligothiophene and guanine moieties, while for the LUMOs the guanine moiety has minimal contribution. This implies that if it is supposed that the π–π stacking is guanine dominant, such as in the case of a tetrameric stacking structure, hole transport properties may be expected. However, as discussed previously, this stacking of guanines can lead to a detrimental effect on the hole carrier transport properties. In contrast, stacking of the oligothiophenes should lead to electron transport properties.
As previously revealed by the TOF photoconductivity measurements, compound 3a exhibits ambipolar charge carrier transport, which can be explained by two factors: (1) the Cubbi phase allows three-dimensional transport for both holes and electrons without the need for alignment in the sandwiched ITO cells, and (2) guanine–guanine (G–G) stacking is limited in the Cubbi assembly, which can help to avoid the shallow hole traps found in the G–G stacks. In this regard, compounds 2b and 3b in the Colh phases are (1) polydomain with respect to the ITO substrates, and (2) tetrameric with stacked guanines in the LC assembly that could potentially lead to shallow hole traps.50 These two factors for both 2b and 3b possibly lead to inhibition of the hole transport properties in the columnar structures, allowing only electron carrier transport.
Potassium ion-induced LC properties
As guanine derivatives tend to form 8![[thin space (1/6-em)]](https://www.rsc.org/images/entities/char_2009.gif) :
:![[thin space (1/6-em)]](https://www.rsc.org/images/entities/char_2009.gif) 1 or 4
1 or 4![[thin space (1/6-em)]](https://www.rsc.org/images/entities/char_2009.gif) :
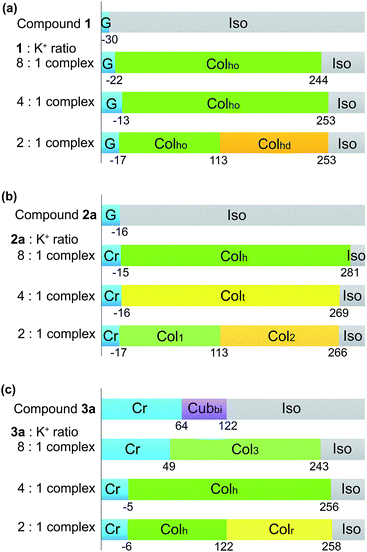
:![[thin space (1/6-em)]](https://www.rsc.org/images/entities/char_2009.gif) 1 complexes with respect to potassium ions,28 these organic to K+ ratios were used to investigate the ion-responsive liquid crystallinity of compounds 1, 2a and 3a when potassium trifluoromethanesulfonate (CF3SO3K) was introduced. CF3SO3K was selected as the potassium source due to the excellent thermal stability of the trifluoromethanesulfonate anion. The phase transition temperatures of the respective guanine–oligothiophene liquid crystals and their complexes with K+ were characterised via DSC and WAXRD (ESI, Section 3 for the DSC thermograms and Section 5 for the WAXRD spectra of the liquid crystal:K+ complexes†) and are summarised in Fig. 4.
1 complexes with respect to potassium ions,28 these organic to K+ ratios were used to investigate the ion-responsive liquid crystallinity of compounds 1, 2a and 3a when potassium trifluoromethanesulfonate (CF3SO3K) was introduced. CF3SO3K was selected as the potassium source due to the excellent thermal stability of the trifluoromethanesulfonate anion. The phase transition temperatures of the respective guanine–oligothiophene liquid crystals and their complexes with K+ were characterised via DSC and WAXRD (ESI, Section 3 for the DSC thermograms and Section 5 for the WAXRD spectra of the liquid crystal:K+ complexes†) and are summarised in Fig. 4.
While both compounds 1 and 2a exhibit no LC phases in their single-component states, the introduction of K+ induces the formation of columnar phases for both of the compounds at room temperature. The 8![[thin space (1/6-em)]](https://www.rsc.org/images/entities/char_2009.gif) :
:![[thin space (1/6-em)]](https://www.rsc.org/images/entities/char_2009.gif) 1 molar complex of 1 with CF3SO3K shows an ordered hexagonal columnar (Colho) phase from 244 to −22 °C upon cooling (Fig. 4a), with a typical fan-shaped texture when observed under the POM (ESI, Fig. S11a†). The introduction of excess CF3SO3K causes no significant change in the glass transition temperature, while another disordered hexagonal columnar phase (Colhd) at above 113 °C upon cooling is observed for the 2
1 molar complex of 1 with CF3SO3K shows an ordered hexagonal columnar (Colho) phase from 244 to −22 °C upon cooling (Fig. 4a), with a typical fan-shaped texture when observed under the POM (ESI, Fig. S11a†). The introduction of excess CF3SO3K causes no significant change in the glass transition temperature, while another disordered hexagonal columnar phase (Colhd) at above 113 °C upon cooling is observed for the 2![[thin space (1/6-em)]](https://www.rsc.org/images/entities/char_2009.gif) :
:![[thin space (1/6-em)]](https://www.rsc.org/images/entities/char_2009.gif) 1 molar complex.
1 molar complex.
The 8![[thin space (1/6-em)]](https://www.rsc.org/images/entities/char_2009.gif) :
:![[thin space (1/6-em)]](https://www.rsc.org/images/entities/char_2009.gif) 1 molar complex of 2a with CF3SO3K also exhibits a wide temperature range of the Colh phase from 281 to −15 °C (Fig. 4b), with a typical texture for the columnar phase under POM observation (ESI, Fig. S11f†). A tetragonal columnar (Colt) phase and two unidentified columnar phases (Col1, Col2) were induced with 4
1 molar complex of 2a with CF3SO3K also exhibits a wide temperature range of the Colh phase from 281 to −15 °C (Fig. 4b), with a typical texture for the columnar phase under POM observation (ESI, Fig. S11f†). A tetragonal columnar (Colt) phase and two unidentified columnar phases (Col1, Col2) were induced with 4![[thin space (1/6-em)]](https://www.rsc.org/images/entities/char_2009.gif) :
:![[thin space (1/6-em)]](https://www.rsc.org/images/entities/char_2009.gif) 1 and 2
1 and 2![[thin space (1/6-em)]](https://www.rsc.org/images/entities/char_2009.gif) :
:![[thin space (1/6-em)]](https://www.rsc.org/images/entities/char_2009.gif) 1 molar complexes of 2a
1 molar complexes of 2a![[thin space (1/6-em)]](https://www.rsc.org/images/entities/char_2009.gif) :
:![[thin space (1/6-em)]](https://www.rsc.org/images/entities/char_2009.gif) CF3SO3K.
CF3SO3K.
On the other hand, the introduction of K+ to compound 3a to form the Cubbi phase led to the induction of columnar phases with a significant increase in the isotropic temperature (Fig. 4c). As the K+ to 3a molar ratio increases, unidentified columnar (Col3), Colh and rectangular columnar (Colr) phases are observed. The Col3 phase is hypothesised to be an intermediate phase between the Cubbi and Colh phases. The crystallisation temperature of the complexes shows a decreasing trend with the increase of K+ in the complexes. The properties of these ion-responsive liquid crystals will be explored in a later section.
While it has been considered that the change in the LC assemblies induced by the introduction of K+ could have an effect on the charge carrier transport, the photoconductivity measurements of the complexes are excluded from our current study due to the difficulty in the preparation of measurement cells containing the complexes with very high clearing points.
FTIR spectroscopic studies
As a means to gain an insight into the hydrogen bonding structures of the guanine–oligothiophene conjugates, all of the guanine–oligothiophene derivatives and their complexes with CF3SO3K were characterised via Fourier transform infrared (FTIR) spectroscopy (Fig. 5 and ESI, Fig. S12†).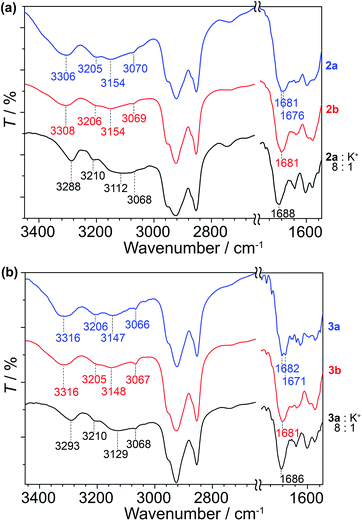 | ||
| Fig. 5 FTIR spectra of (a) 2a, 2b and the complex of 2a with CF3SO3K at room temperature and (b) 3a, 3b and the complex of 3a with CF3SO3K at 100 °C. | ||
Guanine–bithiophene derivatives 2a and 2b in the isotropic and Colh phases, respectively, at room temperature show almost identical spectra (Fig. 5a). For compound 2a with a di(dodecyloxy)phenyl moiety, the amine N2–H asymmetric stretch band νa(N2–H) at 3306 cm−1, the symmetric N2–H stretch bands νs(N2–H) at 3205, 3154 and 3070 cm−1, and two carbonyl stretch bands ν(C![[double bond, length as m-dash]](https://www.rsc.org/images/entities/char_e001.gif) O) at 1681 and 1676 cm−1 from the guanine moiety can be observed (Fig. 5a).60 As for compound 2b, which has a fan-shaped tri(dodecyloxy) moiety, only one carbonyl peak at ν(C
O) at 1681 and 1676 cm−1 from the guanine moiety can be observed (Fig. 5a).60 As for compound 2b, which has a fan-shaped tri(dodecyloxy) moiety, only one carbonyl peak at ν(C![[double bond, length as m-dash]](https://www.rsc.org/images/entities/char_e001.gif) O) at 1681 cm−1 can be seen.
O) at 1681 cm−1 can be seen.
Compound 2a complexed with CF3SO3K also shows one carbonyl peak at ν(C![[double bond, length as m-dash]](https://www.rsc.org/images/entities/char_e001.gif) O) at 1688 cm−1 in its FTIR spectrum. The 8
O) at 1688 cm−1 in its FTIR spectrum. The 8![[thin space (1/6-em)]](https://www.rsc.org/images/entities/char_2009.gif) :
:![[thin space (1/6-em)]](https://www.rsc.org/images/entities/char_2009.gif) 1 molar complex of compound 2a with CF3SO3K exhibits redshifts in two of the amine peaks, νa(N2–H) at 3288 cm−1 and νs(N2–H) at 3112 cm−1. The redshifts of the amine peaks could be attributed to the ion–dipole interactions of the alkali ion on the G-tetrads, resulting in weaker N–H bonds. Similar observations can be made for the FTIR spectra of compound 1 and its potassium salt complex (ESI, Fig. S12†).
1 molar complex of compound 2a with CF3SO3K exhibits redshifts in two of the amine peaks, νa(N2–H) at 3288 cm−1 and νs(N2–H) at 3112 cm−1. The redshifts of the amine peaks could be attributed to the ion–dipole interactions of the alkali ion on the G-tetrads, resulting in weaker N–H bonds. Similar observations can be made for the FTIR spectra of compound 1 and its potassium salt complex (ESI, Fig. S12†).
Guanine–terthiophene derivatives exhibit similar FTIR spectra to their guanine–bithiophene counterparts. Compound 3a shows νa(N2–H) at 3316 cm−1, νs(N2–H) at 3206, 3147 and 3066 cm−1 and ν(C![[double bond, length as m-dash]](https://www.rsc.org/images/entities/char_e001.gif) O) at 1682 and 1671 cm−1, and the detection of the two distinct carbonyl peaks is exclusive to the di(dodecyloxy) moiety attached guanine–terthiophene derivative 3a (Fig. 5b). Similarly, a shift to a lower wavenumber of the amine peaks is observed for the 8
O) at 1682 and 1671 cm−1, and the detection of the two distinct carbonyl peaks is exclusive to the di(dodecyloxy) moiety attached guanine–terthiophene derivative 3a (Fig. 5b). Similarly, a shift to a lower wavenumber of the amine peaks is observed for the 8![[thin space (1/6-em)]](https://www.rsc.org/images/entities/char_2009.gif) :
:![[thin space (1/6-em)]](https://www.rsc.org/images/entities/char_2009.gif) 1 molar complex of compound 3a with CF3SO3K.
1 molar complex of compound 3a with CF3SO3K.
The observed two ν(C![[double bond, length as m-dash]](https://www.rsc.org/images/entities/char_e001.gif) O) stretching bands for compounds 1 and 2a in the Iso phases and 3a in the Cubbi phase can be ascribed to ν(C
O) stretching bands for compounds 1 and 2a in the Iso phases and 3a in the Cubbi phase can be ascribed to ν(C![[double bond, length as m-dash]](https://www.rsc.org/images/entities/char_e001.gif) O) coupled with the NH2 scissoring and N1–H in-plane bending vibrations.60 Whereas for the Colh phases of the fan-shaped 2b, 3b, and various guanine–oligothiophene complexes with K+, the single ν(C
O) coupled with the NH2 scissoring and N1–H in-plane bending vibrations.60 Whereas for the Colh phases of the fan-shaped 2b, 3b, and various guanine–oligothiophene complexes with K+, the single ν(C![[double bond, length as m-dash]](https://www.rsc.org/images/entities/char_e001.gif) O) peak suggests that the adoption of a single configuration of the hydrogen bonding through N1H–O6 and N2H–N7 (G-tetrads) of the guanine moiety eliminates such a coupling effect. As such, through these experimental observations, we proposed that more than one configuration of hydrogen bonding structures is present for the Iso and Cubbi phases of compounds 1, 2a and 3a (vide infra).
O) peak suggests that the adoption of a single configuration of the hydrogen bonding through N1H–O6 and N2H–N7 (G-tetrads) of the guanine moiety eliminates such a coupling effect. As such, through these experimental observations, we proposed that more than one configuration of hydrogen bonding structures is present for the Iso and Cubbi phases of compounds 1, 2a and 3a (vide infra).
Proposed self-assembled structures
Based on the XRD data, FTIR, charge transport properties and molecular modelling studies, the self-assembled structures of the guanine–oligothiophenes derivatives are proposed.The number of formula units per unit cell (Z) for compound 3a was calculated to be approximately 8 (ESI, Section 4†). Hence, it is proposed that compound 3a in the Cubbi phase self-assembled in a ribbon-like, catenary-like form (Fig. 6a). Similar molecular arrangements have previously been reported.30 In this case, N1H–O6, N2H–O6 and N2H–N3 hydrogen bonds are present in the nanoscale assembly. Moreover, this molecular assembly is supposedly arranged in such a way that guanine–guanine stackings are non-dominant, reducing hole traps and allowing ambipolar transport in the nanostructures. The molecular assembly of the eight molecules of 3a measures 72 by 76 Å, which is larger than the lattice parameter derived from the WAXRD spectra at 58.9 Å. It is proposed that the alkyl chains fit into the space between adjacent oligothiophene groups, resulting in a smaller-than-simulated lattice parameter.
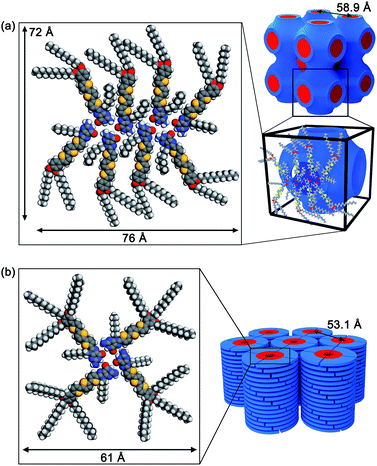 | ||
| Fig. 6 Proposed molecular assembled structures of (a) 3a in the Cubbi phase and (b) 3b in the Colh phase. | ||
Compound 3b is proposed to form G-tetrads that stack on top of each other to form a columnar structure (Fig. 6b). The column diameter for compound 3b was calculated to be approximately 61 Å. This theoretical column diameter is observably longer than the diameter of the column as determined by the WAXRD patterns at 53.1 Å, which can be explained by interdigitating of the alkyl chains as well. Compound 2b is also thought to share a similar self-assembled structure.
Ion-stimuli responsive emission properties
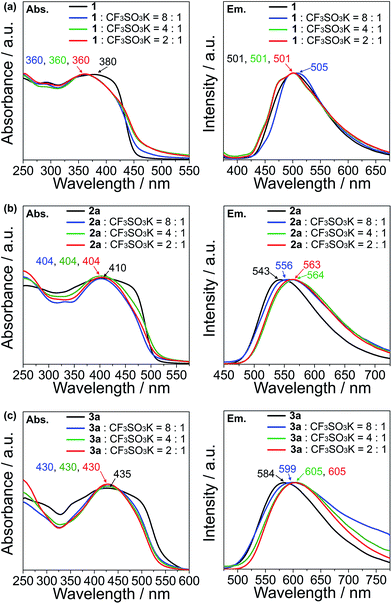
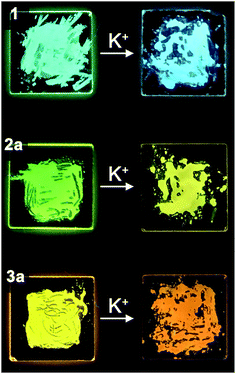
The UV-vis absorption and emission response of the ion-responsive liquid crystals were investigated via UV-vis absorption and fluorescence spectroscopy (Fig. 7) and by visual inspection under the illumination of UV light (Fig. 8).The absorption spectrum of 1 shows a plateau with a peak at 380 nm, with a drop off at 420 nm, while all of the complexes of 1 with CF3SO3K exhibit a distinct peak at 360 nm which can be ascribed to the π → π* transition (Fig. 7a, left). As for the emission spectra, there are no appreciable shifts in the emission wavelength for compound 1 and its K+ complexes, with an emission peak at 501 nm which corresponds to the S1 → S0 relaxation (Fig. 7a, right).
Compound 2a exhibits an absorption peak that shows a plateau until 470 nm with a maximum at 410 nm (π → π*), while its complexes exhibit a more distinct peak at 404 nm (Fig. 7b, left). On the other hand, the emission peaks exhibit a redshift that increases in magnitude as the K+ ratio increases in the complexes, from 543 nm (S1 → S0) for compound 2a, to 556 nm for the 8![[thin space (1/6-em)]](https://www.rsc.org/images/entities/char_2009.gif) :
:![[thin space (1/6-em)]](https://www.rsc.org/images/entities/char_2009.gif) 1 molar complex of 2a with CF3SO3K (Fig. 7b, right). The redshift is maximised with 4
1 molar complex of 2a with CF3SO3K (Fig. 7b, right). The redshift is maximised with 4![[thin space (1/6-em)]](https://www.rsc.org/images/entities/char_2009.gif) :
:![[thin space (1/6-em)]](https://www.rsc.org/images/entities/char_2009.gif) 1 and 2
1 and 2![[thin space (1/6-em)]](https://www.rsc.org/images/entities/char_2009.gif) :
:![[thin space (1/6-em)]](https://www.rsc.org/images/entities/char_2009.gif) 1 molar complexes at 564 and 563 nm, respectively.
1 molar complexes at 564 and 563 nm, respectively.
Compound 3a and its complexes show a similar trend. 3a shows a less distinct absorption peak at 435 nm (π → π*) with a plateau that ends at 490 nm, while its K+ complexes exhibit a distinct peak at 430 nm (Fig. 7c, left). Similar to the emission spectra of compound 2a, the addition of K+ to compound 3a induces a redshift in the spectra. While 3a shows an emission peak at 584 nm (S1 → S0), the 8![[thin space (1/6-em)]](https://www.rsc.org/images/entities/char_2009.gif) :
:![[thin space (1/6-em)]](https://www.rsc.org/images/entities/char_2009.gif) 1 molar complex of 3a with the CF3SO3K complex exhibits a peak at 599 nm, and at 605 nm for both the 4
1 molar complex of 3a with the CF3SO3K complex exhibits a peak at 599 nm, and at 605 nm for both the 4![[thin space (1/6-em)]](https://www.rsc.org/images/entities/char_2009.gif) :
:![[thin space (1/6-em)]](https://www.rsc.org/images/entities/char_2009.gif) 1 and 2
1 and 2![[thin space (1/6-em)]](https://www.rsc.org/images/entities/char_2009.gif) :
:![[thin space (1/6-em)]](https://www.rsc.org/images/entities/char_2009.gif) 1 molar complexes (Fig. 7c, right).
1 molar complexes (Fig. 7c, right).
The observation of distinct peaks in the UV-vis absorption spectra for the K+ complexes instead of plateaus, as seen for uncomplexed guanine–oligothiophene conjugates, can be explained by the formation of discrete nanoscale assembly in the columnar phases that limits the possible excitation pathways. As for the emission spectra, compound 1 exhibits no significant bathochromic shift probably due to insufficient overlapping from the monothiophene moiety. On the contrary, the bathochromic shifts for the emission peaks for compounds 2a and 3a with K+ can be attributed to the increased π–π stacking interactions of the columnar phases. The stacking distance is thought to further decrease with respect to the increase in K+ ions, with the interactions between each layer maximised with the 4![[thin space (1/6-em)]](https://www.rsc.org/images/entities/char_2009.gif) :
:![[thin space (1/6-em)]](https://www.rsc.org/images/entities/char_2009.gif) 1 complexes.
1 complexes.
For compounds 2b and 3b in the Colh phases, the introduction of K+ also causes a redshift (ESI, Section 9†), but with a magnitude of change less significant than that of the K+ complexes of 2a and 3a.
In order to gain further insight into the emission colour change in the bulk states, we conducted studies of the absorbance and emission spectra of the THF solution of guanine–oligothiophene conjugates in the presence of K+ ions (ESI, Fig S15†). It has been previously reported that G-tetrads are formed in THF solution with a concentration of 10−3 M or higher, while the monomeric form exists at a concentration of 10−4 M or lower.30–33 As such, THF solutions containing guanine–oligothiophenes conjugates with a concentration of 2 × 10⁻⁵ M (Fig. S15a†) and 4 × 10⁻³ M (Fig. S15b†) in the presence of CF3SO3K (3.6 × 10⁻³ M) were prepared and characterised via UV-vis absorption and fluorescence spectroscopy.
Through our investigation, it was discovered that the presence of high concentrations of K+ does not affect the spectra of dilute solutions (2 × 10⁻⁵ M) in any noticeable way. On the other hand, the concentrated solutions (4 × 10⁻³ M) exhibited observable spectroscopic redshift in the emission spectra when K+ was introduced, indicating the formation of G-tetrads and subsequently better π–π stacking interactions resulting from such a molecular assembly. Thus, we believe that the colour change when K+ is introduced to guanine–oligothiophene conjugates is a result of increased molecular stacking induced by ion–dipole interactions.
Conclusion
We have demonstrated that the LC properties and photonic behaviour of hydrogen-bonded π-conjugates can be tuned through complexation and binding of potassium ions. We have also established that guanine–oligothiophene conjugates adopt nanoscale assembly structures that exhibit charge transport properties. This is a new approach in the field of supramolecular materials, where ionic, photonic, and electronic functions are induced in the same molecule. The presented strategy would contribute to the development of materials in organic electronics and sensor devices.Conflicts of interest
There are no conflicts to declare.Acknowledgements
This study was partially supported by Scientific Research on Innovative Areas (Stimuli-responsive Chemical species, KAKENHI 15H00921 for M. Y.) from the Ministry of Education, Culture, Sports, Science and Technology of Japan (MEXT). This work was also partially supported by CREST, JST (JPMJCR1422) for T. K. K. P. G. is grateful for the support of MEXT for his research and pursuit of graduate degrees at the University of Tokyo.Notes and references
- Supramolecular Soft Matter: Applications in Materials and Organic Electronics, ed. T. Nakanishi, John Wiley & Sons, Hoboken, NJ, 2011 Search PubMed.
- T. Kato, N. Mizoshita and K. Kishimoto, Angew. Chem., Int. Ed., 2006, 45, 38–68 CrossRef CAS PubMed.
- S. J. Rowan and P. T. Mather, in Liquid Crystalline Functional Assemblies and Their Supramolecular Structures, Structure and Bonding, ed. T. Kato, Springer Berlin Heidelberg, Berlin, Heidelberg, 2008, vol. 128, pp. 119–149 Search PubMed.
- S. Yagai and A. Kitamura, Chem. Soc. Rev., 2008, 37, 1520–1529 RSC.
- C. C. Lee, C. Grenier, E. W. Meijer and A. P. H. J. Schenning, Chem. Soc. Rev., 2009, 38, 671–683 RSC.
- L. E. Buerkle and S. J. Rowan, Chem. Soc. Rev., 2012, 41, 6089–6102 RSC.
- S. S. Babu, V. K. Praveen and A. Ajayaghosh, Chem. Rev., 2014, 114, 1973–2129 CrossRef CAS PubMed.
- T. Kato, M. Yoshio, T. Ichikawa, B. Soberats, H. Ohno and M. Funahashi, Nat. Rev. Mater., 2017, 2, 17001 CrossRef.
- M. Kumar and S. Kumar, Polym. J., 2017, 49, 85–111 CrossRef CAS.
- T. Kato, in Molecular Self-Assembly Organic Versus Inorganic Approaches, Structure and Bonding, ed. M. Fujita, Springer Berlin Heidelberg, Berlin, Heidelberg, 2000, vol. 96, pp. 95–146 Search PubMed.
- T. Kato, N. Mizoshita and K. Kanie, Macromol. Rapid Commun., 2001, 22, 797–814 CrossRef CAS.
- F. J. M. Hoeben, P. Jonkheijm, E. W. Meijer and A. P. H. J. Schenning, Chem. Rev., 2005, 105, 1491–1546 CrossRef CAS PubMed.
- B. Donnio, S. Buathong, I. Bury and D. Guillon, Chem. Soc. Rev., 2007, 36, 1495–1513 RSC.
- C. Tschierske, Chem. Soc. Rev., 2007, 36, 1930–1970 RSC.
- Z. Chi, X. Zhang, B. Xu, X. Zhou, C. Ma, Y. Zhang, S. Liu and J. Xu, Chem. Soc. Rev., 2012, 41, 3878–3896 RSC.
- Handbook of Liquid Crystals, ed. J. W. Goodby, P. J. Collings, T. Kato, C. Tschierske, H. Gleeson and P. Raynes, Wiley-VCH, Weinheim, Germany, 2nd edn, 2014 Search PubMed.
- T. Kato and J. M. J. Frechet, Macromolecules, 1989, 22, 3818–3819 CrossRef CAS.
- T. Kato and J. M. J. Frechet, J. Am. Chem. Soc., 1989, 111, 8533–8534 CrossRef CAS.
- M. Suárez, J.-M. Lehn, S. C. Zimmerman, A. Skoulios and B. Heinrich, J. Am. Chem. Soc., 1998, 120, 9526–9532 CrossRef.
- Y. Sagara and T. Kato, Angew. Chem., Int. Ed., 2008, 47, 5175–5178 CrossRef CAS PubMed.
- Y. Sagara and T. Kato, Nat. Chem., 2009, 1, 605–610 CrossRef CAS PubMed.
- M. Lehmann, S. Gloza and S. Roth, Chem. Mater., 2015, 27, 8181–8184 CrossRef CAS.
- M. Mitani, S. Ogata, S. Yamane, M. Yoshio, M. Hasegawa and T. Kato, J. Mater. Chem. C, 2016, 4, 2752–2760 RSC.
- S. Herbst, B. Soberats, P. Leowanawat, M. Lehmann and F. Würthner, Angew. Chem., Int. Ed., 2017, 56, 2162–2165 CrossRef CAS PubMed.
- J. T. Davis and G. P. Spada, Chem. Soc. Rev., 2007, 36, 296–313 RSC.
- S. Sivakova and S. J. Rowan, Chem. Soc. Rev., 2005, 34, 9–21 RSC.
- S. Zhang, Y. Wu and W. Zhang, ChemMedChem, 2014, 9, 899–911 CrossRef CAS PubMed.
- E. Mezzina, P. Mariani, R. Itri, S. Masiero, S. Pieraccini, G. P. Spada, F. Spinozzi, J. T. Davis and G. Gottarelli, Chem.–Eur. J., 2001, 7, 388–395 CrossRef CAS.
- A. Ghoussoub and J.-M. Lehn, Chem. Commun., 2005, 5763–5765 RSC.
- D. González-Rodríguez, P. G. A. Janssen, R. Martín-Rapún, I. D. Cat, S. D. Feyter, A. P. H. J. Schenning and E. W. Meijer, J. Am. Chem. Soc., 2010, 132, 4710–4719 CrossRef PubMed.
- Y.-L. Wu, K. E. Brown and M. R. Wasielewski, J. Am. Chem. Soc., 2013, 135, 13322–13325 CrossRef CAS PubMed.
- Y.-L. Wu, K. E. Brown, D. M. Gardner, S. M. Dyar and M. R. Wasielewski, J. Am. Chem. Soc., 2015, 137, 3981–3990 CrossRef CAS PubMed.
- M. Garcia-Iglesias, T. Torres and D. Gonzalez-Rodriguez, Chem. Commun., 2016, 52, 9446–9449 RSC.
- T. Kato and N. Mizoshita, Curr. Opin. Solid State Mater. Sci., 2002, 6, 579–587 CrossRef CAS.
- T. Kato, T. Yasuda, Y. Kamikawa and M. Yoshio, Chem. Commun., 2009, 729–739 RSC.
- K. Kanie, T. Yasuda, M. Nishii, S. Ujiie and T. Kato, Chem. Lett., 2001, 30, 480–481 CrossRef.
- K. Kanie, M. Nishii, T. Yasuda, T. Taki, S. Ujiie and T. Kato, J. Mater. Chem., 2001, 11, 2875–2886 RSC.
- T. Kato, T. Matsuoka, M. Nishii, Y. Kamikawa, K. Kanie, T. Nishimura, E. Yashima and S. Ujiie, Angew. Chem., Int. Ed., 2004, 43, 1969–1972 CrossRef CAS PubMed.
- N. Sakai, Y. Kamikawa, M. Nishii, T. Matsuoka, T. Kato and S. Matile, J. Am. Chem. Soc., 2006, 128, 2218–2219 CrossRef CAS PubMed.
- C. R. Treadway, M. G. Hill and J. K. Barton, Chem. Phys., 2002, 281, 409–428 CrossRef CAS.
- H.-A. Wagenknecht, Nat. Prod. Rep., 2006, 23, 973–1006 RSC.
- J. C. Genereux and J. K. Barton, Chem. Rev., 2010, 110, 1642–1662 CrossRef CAS PubMed.
- F. D. Lewis, T. Wu, X. Liu, R. L. Letsinger, S. R. Greenfield, S. E. Miller and M. R. Wasielewski, J. Am. Chem. Soc., 2000, 122, 2889–2902 CrossRef CAS.
- F. D. Lewis, X. Liu, J. Liu, S. E. Miller, R. T. Hayes and M. R. Wasielewski, Nature, 2000, 406, 51–53 CrossRef CAS PubMed.
- E. M. Conwell and S. M. Bloch, J. Phys. Chem. B, 2006, 110, 5801–5806 CrossRef CAS PubMed.
- F. Ortmann, K. Hannewald and F. Bechstedt, J. Phys. Chem. B, 2009, 113, 7367–7371 CrossRef CAS PubMed.
- F. F. Maia, V. N. Freire, E. W. S. Caetano, D. L. Azevedo, F. A. M. Sales and E. L. Albuquerque, J. Chem. Phys., 2011, 134, 175101 CrossRef PubMed.
- J. D. Slinker, N. B. Muren, S. E. Renfrew and J. K. Barton, Nat. Chem., 2011, 3, 228–233 CrossRef CAS PubMed.
- A. K. Thazhathveetil, A. Trifonov, M. R. Wasielewski and F. D. Lewis, J. Am. Chem. Soc., 2011, 133, 11485–11487 CrossRef CAS PubMed.
- J. Choi, J. Park, A. Tanaka, M. J. Park, Y. J. Jang, M. Fujitsuka, S. K. Kim and T. Majima, Angew. Chem., Int. Ed., 2013, 52, 1134–1138 CrossRef CAS PubMed.
- L. Xiang, J. L. Palma, C. Bruot, V. Mujica, M. A. Ratner and N. Tao, Nat. Chem., 2015, 7, 221–226 CrossRef CAS PubMed.
- G. Maruccio, P. Visconti, V. Arima, S. D’Amico, A. Biasco, E. D’Amone, R. Cingolani, R. Rinaldi, S. Masiero, T. Giorgi and G. Gottarelli, Nano Lett., 2003, 3, 479–483 CrossRef CAS.
- A. K. Shaytan, E.-K. Schillinger, E. Mena-Osteritz, S. Schmid, P. G. Khalatur, P. Bäuerle and A. R. Khokhlov, Beilstein J. Nanotechnol., 2011, 2, 525–544 CrossRef CAS PubMed.
- D. A. Stone, A. S. Tayi, J. E. Goldberger, L. C. Palmer and S. I. Stupp, Chem. Commun., 2011, 47, 5702–5704 RSC.
- G. P. Spada, S. Lena, S. Masiero, S. Pieraccini, M. Surin and P. Samorì, Adv. Mater., 2008, 20, 2433–2438 CrossRef CAS.
- H. Ouchi, X. Lin, T. Kizaki, D. D. Prabhu, F. Silly, T. Kajitani, T. Fukushima, K.-i. Nakayama and S. Yagai, Chem. Commun., 2016, 52, 7874–7877 RSC.
- R. Bou Zerdan, P. Cohn, E. Puodziukynaite, M. B. Baker, M. Voisin, C. Sarun and R. K. Castellano, J. Org. Chem., 2015, 80, 1828–1840 CrossRef CAS PubMed.
- K. Okano, K.-i. Okuyama, T. Fukuyama and H. Tokuyama, Synlett, 2008, 1977–1980 CAS.
- C. Li, L. Duan, H. Li and Y. Qiu, J. Phys. Chem. C, 2014, 118, 10651–10660 CAS.
- R. P. Lopes, M. P. M. Marques, R. Valero, J. Tomkinson and L. A. E. B. de Carvalho, Spectrosc. Int. J., 2012, 27, 20 Search PubMed.
Footnotes |
| † Electronic supplementary information (ESI) available: Experimental, gHMBC NMR spectrum, DSC traces, lattice analyses, WAXRD spectra, POM images, FTIR spectra and transient photocurrent curves. See DOI: 10.1039/c7sc03764c |
| ‡ Current address: Semiconductor Nano-interfaces Group, Research Center for Functional Materials, National Institute for Materials Science, Namiki, Tsukuba, Ibaraki 305-0044, Japan, E-mail: E-mail: yoshio.masafumi@nims.go.jp, Tel: +81-298-60-4728, Fax: +81-298-60-4718. |
| This journal is © The Royal Society of Chemistry 2018 |


