
 Open Access Article
 This Open Access Article is licensed under a Creative Commons Attribution-Non Commercial 3.0 Unported Licence
Dynamical inversion of the energy landscape promotes non-equilibrium self-assembly of binary mixtures†
Luis Ruiz
Pestana
 a,
Natalie
Minnetian
d,
Laura Nielsen
Lammers
bc and
Teresa
Head-Gordon
*adef
a,
Natalie
Minnetian
d,
Laura Nielsen
Lammers
bc and
Teresa
Head-Gordon
*adef
aChemical Sciences Division, Lawrence Berkeley National Laboratory, University of California, Berkeley, USA. E-mail: thg@berkeley.edu
bEarth and Environmental Science Area, Lawrence Berkeley National Laboratory, University of California, Berkeley, USA
cDepartment of Environmental Science, Policy, and Management, University of California, Berkeley, USA
dDepartment of Chemistry, University of California, Berkeley, USA
eDepartment of Bioengineering, University of California, Berkeley, USA
fDepartment of Chemical and Biomolecular Engineering, University of California, Berkeley, USA
First published on 2nd January 2018
Abstract
When driven out of equilibrium, many diverse systems can form complex spatial and dynamical patterns, even in the absence of attractive interactions. Using kinetic Monte Carlo simulations, we investigate the phase behavior of a binary system of particles of dissimilar size confined between semiflexible planar surfaces, in which the nanoconfinement introduces a non-local coupling between particles, which we model as an activation energy barrier to diffusion that decreases with the local fraction of the larger particle. The system autonomously reaches a cyclical non-equilibrium state characterized by the formation and dissolution of metastable micelle-like clusters with the small particles in the core and the large ones in the surrounding corona. The power spectrum of the fluctuations in the aggregation number exhibits 1/f noise reminiscent of self-organized critical systems. We suggest that the dynamical metastability of the micellar structures arises from an inversion of the energy landscape, in which the relaxation dynamics of one of the species induces a metastable phase for the other species.
Introduction
Self-assembly is typically defined as an equilibrium process whereby molecular building blocks spontaneously associate into highly organized complex structures.1 Because it provides atomistic level structural resolution but does not require explicit manipulation at that scale, it has become the most promising bottom-up strategy to fabricate functional nanostructured materials.2,3 Current self-assembly strategies to achieve complex structures have been directed towards designing complicated networks of short-range interactions enabled mostly by DNA technology.4–7 Self-assembly is also ubiquitous in natural systems, and spans a wide range of length scales, from concerted motion in flocks to spatial patterning in bacterial colonies.8,9 But in contrast to engineered systems, most natural self-assembly processes occur out-of-equilibrium. By exploiting the anomalous phase behavior of systems under non-equilibrium conditions, natural systems can produce complex patterns that are otherwise inaccessible through an equilibrium process. Despite recent efforts to use far-from-equilibrium conditions in nanostructured systems,10,11 the discovery and understanding of non-equilibrium effects in the self-organization of particle systems is in its infancy. Extending our current knowledge to a broader class of systems and non-equilibrium conditions is important for both engineered and natural applications of nanostructure organization.In this work, we investigate the phase behavior of a model inspired by a binary mixture of ionic particles (K and Cs) that have different size, rK < rCs, and are under semiflexible planar confinement (Fig. 1a). The critical feature of the system is that the activation energy barrier to diffusion of the larger (Cs) particles is higher than that of the smaller (K) particles, given the same local environment, and the activation energy barrier of all the particles decreases with the local concentration of the larger particles because they mechanically expand the semiflexible slit locally (Fig. 1b). Non-equilibrium effects will arise when the particles are confined between two semiflexible interfaces, which introduces a non-local coupling between the particles and their diffusion energy barriers. These abstracted features of the model have been derived from a recent study of the kinetics of ion migration in anhydrous clay interlayers,12 which we investigate here in the limit of infinite screening (i.e. the electrostatic interactions between the ions are negligible).
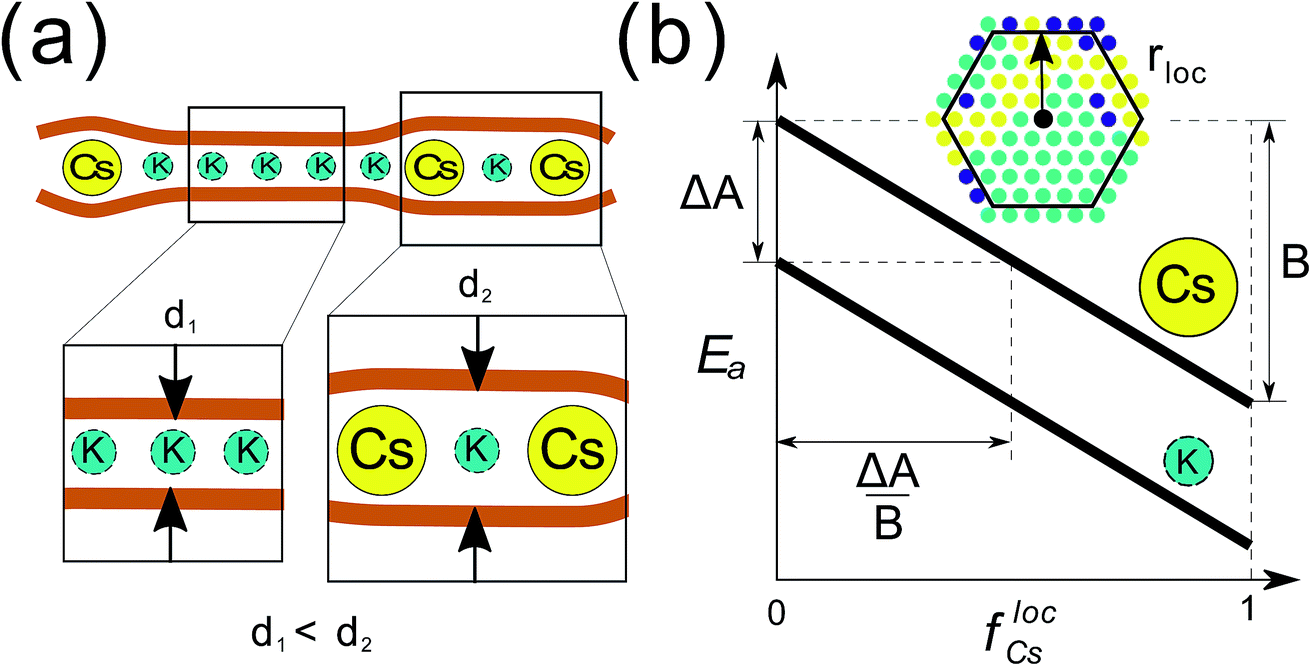 | ||
| Fig. 1 Summary of the binary mixture model that exhibits non-equilibrium phase behavior. (a) Schematic representation of the system under study: a binary mixture of particles of dissimilar size under semiflexible planar confinement. The larger Cs particles expand the interlayer locally, which reduces the activation energy barrier of neighboring particles. (b) Activation energy barriers to diffusion, Ea, of each particle type as a function of the fraction of Cs in the local neighborhood, flocCs. The critical parameters are: (i) the difference between the Ea for the two species, which is ΔA for the same local environment, (ii) the strength of the dependence of Ea on the local environment, given by B, and (iii) the characteristic length scale of the local neighborhood in units of lattice sites, rloc. The geometric representation of the adimensional parameter ΔA/B is also presented. | ||
We find that for a broad range of conditions, quantified below, the model reaches a state characterized by the cyclical formation and dissolution of metastable micelle-like clusters, with smaller K particles in the core and larger Cs particles in the corona. We call this a cyclical self-organized (CSO) state. We show that the cyclical nature of the dynamics arises from the inversion of the energy landscape13,14 of one particle type induced by the aggregation of particles of the other type, but by a mechanism in which the relaxation dynamics of the K particles is arrested by the Cs particles. We denote this novel mechanism dynamical inversion of the energy landscape (DIEL). Furthermore, the power spectrum of the fluctuations of the aggregation number in the CSO state exhibits a power law tail, reminiscent of self-organized critical systems.15
In what follows, we discuss first the phenomenology of the model, and then quantitatively analyze the phase behavior and dynamics of the system and its dependence on the relevant model parameters. We also derive a simple analytical form to predict the transition of the system to the CSO state and summarize our findings in a phase diagram that could guide experimental efforts towards reproducing the anomalous phase behavior observed here.
Computational methods
The system under study consists of a two dimensional triangular lattice, and dimensions of 30 × 30, 60 × 60 and 100 × 100 sites were investigated. The 60 × 60 lattice was chosen because it is big enough so that it does not affect the natural dynamics also observed in the larger system, but the computational cost is low enough to achieve adequate temporal sampling. The left/right boundaries of the interlayer are reflective, and the top/bottom are periodic. Each lattice site is either empty or occupied by a particle of type K or Cs. The stoichiometry of K to Cs particles is 1![[thin space (1/6-em)]](https://www.rsc.org/images/entities/char_2009.gif) :1, i.e. f0Cs = f0K = 0.5. The other parameters of the model, ΔA, B, and rloc have been explained in the main text, and illustrated in Fig. 1b. In the Results section, the particles are initially distributed at random in the lattice at the prescribed occupancy density ρ = (NCs + NK)/602.
:1, i.e. f0Cs = f0K = 0.5. The other parameters of the model, ΔA, B, and rloc have been explained in the main text, and illustrated in Fig. 1b. In the Results section, the particles are initially distributed at random in the lattice at the prescribed occupancy density ρ = (NCs + NK)/602.
At each step of the KMC simulation we assign to each particle a characteristic waiting time determined using by eqn (1) and (2) in the main text. For each particle, a waiting time is randomly generated from an exponential distribution, effectively assuming a Poisson process. Then, we attempt to move a particle with the shortest waiting time to a neighboring lattice site selected at random. If the selected site is occupied by another particle, new waiting times are generated for all the particles, and a new move corresponding to the particle with new shortest waiting time is attempted. For each step we iterate this procedure until a move is successfully realized. The time step is calculated as the sum of the waiting times of all the attempted moves. We output the configuration of the lattice every 103 steps and run each simulation for a total of 3.5 × 10⁸ steps.
Results and discussion
To simulate the dynamics of the system we use a Kinetic Monte Carlo (KMC) scheme on a 2D triangular lattice where sites are either empty or occupied by particles of type K or Cs. Particle moves from occupied to neighboring vacant sites are based on a standard KMC algorithm that assumes Poisson statistics with a characteristic waiting time tc, which according to transition state theory (TST) is: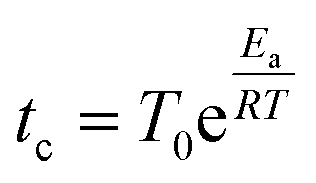 | (1) |
| Ea = Ai − BflocCs | (2) |
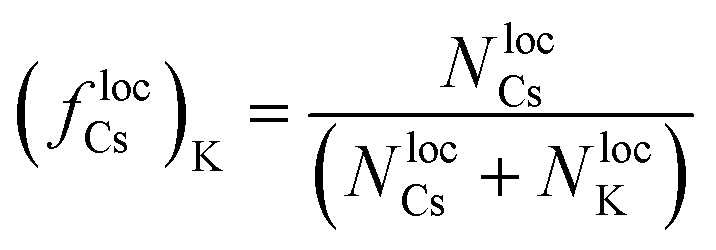
The parameter Ai is the activation energy barrier of particle type i in a local environment where flocCs = 0, whereas B determines the strength of the dependence on the fraction of Cs within a local neighborhood of radius rloc. In what follows, we show that the transition to the non-equilibrium cyclical state is governed by the dimensionless parameter ΔA/B, where ΔA = ACs − AK. Further details of the KMC model and governing equations are described in detail in the Computational methods section.
In the trivial case where B = 0 and ΔA < kBT (i.e. the activation barriers of Cs and K are approximately equivalent, and there is no dependence of the activation energy barriers on the local environment) the entropy of mixing is maximized and the particles exhibit diffusive dynamics, as expected from a system without pairwise interactions in thermodynamic equilibrium (Fig. S1–S3†). Increasing ΔA alone has the effect of separating the timescales at which Cs and K diffuse, but the dynamics of both remain diffusive. Because increasing ΔA makes the Cs particles to be exponentially less mobile than K, at high occupancy densities and ΔA ≫ kBT, Cs particles act as fixed obstacles to the much faster K particles, which leads to sub-diffusive behavior of K. This phenomenon is equivalent to crowding-induced sub-diffusion observed in a variety of systems.16,17 Because in our system the particles aggregate into clusters with high local concentrations, sub-diffusive dynamics of individual particles is manifested even at moderately low occupancy densities.
When the dimensionless parameter ΔA/B takes finite values, we observe a phase transition from the well-mixed diffusive state (ΔA/B → ∞) to a state where K particles aggregate into clusters. In an initial well-mixed state, the local environment of every particle is the same on average, (flocCs)K = (flocCs)Cs = 0.5, which makes the activation energy barriers of K particles, EKa = AK − B(flocCs)K, lower than those of Cs, ECsa = ACs − B(flocCs)Cs, by ΔA. Therefore, the well-mixed configuration represents an unstable state for the K particles such that they drift towards regions with high concentrations of K (i.e. clusters of K) where they diffuse much more slowly. If we examine the scaling of the fluctuations in the number of particles, ΔN, averaged over time in a subsystem as a function of subsystem size, N0, i.e. ΔN ∼ N0α, we see that K exhibits out-of-equilibrium fluctuations (i.e. α > 0.5) for all finite values of ΔA/B (Fig. 2). We show in the ESI† that purely diffusive systems exhibit equilibrium fluctuations (Fig. S2†). The mechanism of aggregation of K particles, where the particles accumulate in low-diffusivity regions and diffuse slowly in the regions where they accumulate, is analogous to the positive feedback responsible for clustering in models of active matter where the mobility of the particles decreases with their concentration.9,18,19
 | ||
| Fig. 2 Fluctuations of the number of particles. The results shown are for ρ = 0.3. We partition the system into M subsystems of equal size N0 = Ntot/M, where Ntot is the total number of particles in the system. Each time step, for each subsystem, we calculate ΔN(t) = N(t) − N0. (a) Average of the fluctuations over time and over all the subsystems, ΔN, as a function of the reference number of particles per subsystem, N0. The black dashed lines show the scaling of equilibrium ΔN ∼ N0.5, and non-equilibrium, ΔN ∼ N, fluctuations. (b) The value of the exponent α in ΔN ∼ Nα for both K and Cs as a function of ΔA/B. | ||
For Cs particles to start diffusing once K has aggregated into clusters, the activation energy barrier of Cs dispersed in the lattice needs to be lowered such that ECsa = EKa. This condition can be written as:
| (ΔA/B)c = ΔflocCs | (3) |
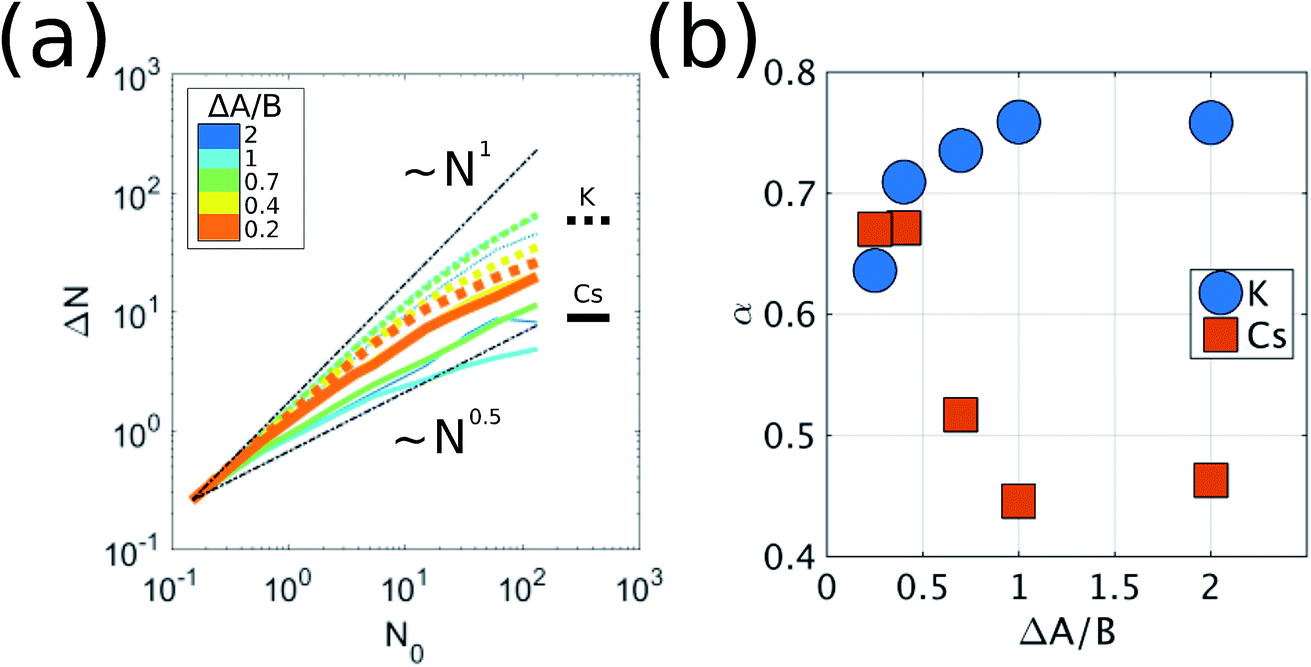
The micelle-like clusters are not stable, however, but kinetically arrested in a metastable state. The aggregation of Cs has the effect of increasing the local concentration of Cs for K particles at the boundaries of each cluster, thus enhancing the mobility of the K particles, which become unstable with respect to their aggregated current state. However, their relaxation path is hindered by the Cs particles in the corona. Eventually, a finite-size fluctuation occurs (i.e. the Cs corona becomes significantly disrupted) and the metastable micelle-like cluster disperses in the lattice, which brings the system back to a state where both species are mixed in the lattice, before the self-organization resumes the next cycle. The destabilizing effect that the dynamical relaxation of one particle type has on the other can be rationalized considering a recently developed concept: the inversion of the energy landscape (IEL). Originally, IEL was invoked to explain the anomalous formation of metastable states through spinodal decomposition, triggered by the variation of a thermodynamic external parameter.13,14 In our case, the inversion of the energy landscape of each particle type is dynamically driven by the aggregation of particles of the other type. This dynamical inversion of the landscape (DIEL) leads to the cyclical behavior illustrated in Fig. 3. (Movies of simulations showing this phenomenon are provided in the ESI†). We note that the phenomena we observe for finite ΔA/B is insensitive to initial conditions by showing the same features are exhibited when the binary system is initially phase-separated (Fig. S4†). Because the barrier to escape the transient state can be quite large (particularly for high values of B, high occupancy density of the lattice, and/or initial phase separated conditions), the system can take a long simulation time to manifest the cyclic behavior. Because our goal is to investigate the cyclical non-equilibrium behavior rather than the initial transient, we decided to use well-mixed starting configurations to more straightforwardly quantify the result.
 | ||
| Fig. 3 Schematic illustration of the dynamical inversion of the energy landscape (DIEL). (a) Each cluster progresses cyclically through 4 different states. State-1 corresponds to K and Cs mixed and dispersed in the lattice. State-2 corresponds to K aggregated into stable clusters, but with Cs still dispersed. State-3 corresponds to the micelle-like metastable clusters with K in the core and Cs in the corona. State-4 occurs after a finite-size fluctuation of the Cs corona allows K to leak out and disperse, but Cs is still aggregated for a brief period. (b) Schematic representation of the energy landscapes for different particle types as a function of the order parameter, which is 1 when all the particles of the given type are aggregated into clusters, and 0 when they are dispersed in the lattice. The vertical transitions (t1 and t3 for Cs, and t2 and t4 for K) correspond to inversions in the energy landscape driven by the relaxation to equilibrium of the other particle type. (c) Illustration of the different states of the system through snapshots from an actual simulation. Results are generated for the system condition where ρ = 0.3, f0K = f0Cs = 0.5, and rloc = 4. | ||
To show that the DIEL phenomena is robust over a range of system parameters, and in order to gain quantitative insight into the order parameters that drive the phase behavior and dynamics of the system to make predictive outcomes, we analyze the effect of varying ΔA/B as well as its dependence on occupancy density, ρ, which is the fraction of lattice sites occupied by particles. Fig. 4a and c show the probability distribution of the aggregation fraction, fiagg ∈ [0,1], defined as the number of particles of type i in an aggregated state divided by the total number of particles of that type in the system, for different values of ΔA/B. For both types of particles the probability distributions display Gaussian profiles with well-defined averages, indicating that the average fraction, fiagg, could be a reasonable order parameter for the system. In Fig. 4b and d, fiagg is plotted as a function of ΔA/B. We find that K aggregates into clusters across all finite ΔA/B values (Fig. 4b). The nature of the K clustering is classifiable as non-equilibrium aggregation (Fig. S5a and b† shows that the aggregation fraction remains approximately constant through the simulation and that the average cluster size is inversely proportional to the instantaneous number of clusters). The aggregation of Cs, on the other hand, exhibits a relatively sharp transition at ΔA/B ≈ 0.7 (Fig. 4d). For ΔA/B > 0.7, Cs exhibits stochastic aggregation due to equilibrium fluctuations, where the average cluster size is small and independent on the instantaneous number of clusters (Fig. S5c and d†). For ΔA/B < 0.7 we observe the non-equilibrium aggregation behavior of Cs. This analysis provides quantitative evidence of the non-equilibrium and metastable phenomenology described earlier, namely, the aggregation first of K into clusters, followed by aggregation of Cs for values of ΔA/B ≤ (ΔA/B)c.
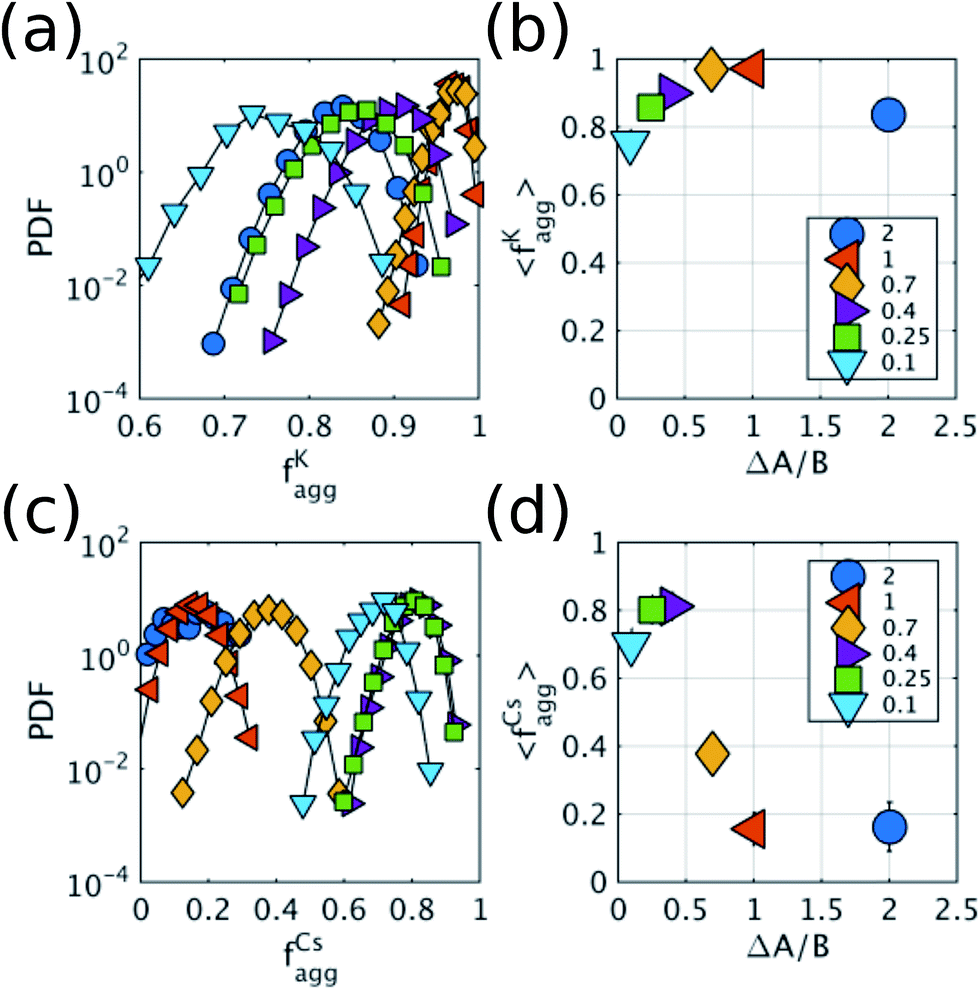 | ||
Fig. 4 Aggregation behavior as a function of ΔA/B for ρ = 0.3. Panels (a) and (c) show the probability distributions of the aggregation fraction, fiagg, for K and Cs, respectively. Panels (b) and (d) show the average aggregation fraction, 〈fiagg〉, as a function of ΔA/B for K and Cs, respectively. The results shown in the figure are for ρ = 0.3. It is interesting that the average stochastic aggregation fraction for K decreases slightly, but consistently, for the lower values of ΔA/B, which can be explained by the fact that, the lower ΔA/B is, the earlier in the clustering process Cs would arrest the aggregation of K by surrounding the existing clusters. Because the values of fiagg have been corrected for background values of aggregation under diffusive conditions, in the diffusive case, when ΔA/B → ∞, fiagg = 0. It is worth noting that the values of fiagg have been corrected according to  , where fiagg,eq is the background aggregation (Fig. S3b†) and , where fiagg,eq is the background aggregation (Fig. S3b†) and  is the uncorrected value. is the uncorrected value. | ||
Because it is the aggregation of Cs that triggers the metastability in the micelle-like clusters, we can use fCsagg as an order parameter to identify additional features of the transition to the CSO state (Fig. 4d). In the CSO state, the system adopts a dynamical behavior whereby micelles form and dissolve as a function of time, which we hypothesize, originates from the dynamical inversion of the energy landscape, and where many micelles at different stages of their lifetimes coexist. A particularly important question is whether the dynamics in the CSO state exhibit any particular time-scale or periodicity. To answer that question, we calculate in Fig. 5 the power spectrum, S(ω), of the time signal of the order parameter, fCsagg. For all cases, we observe that the power spectrum exhibits a power law tail, which indicates the absence of a characteristic frequency governing the dynamical behavior. We note that the inverse power law behavior that arises from the dynamical metastability of the micelles due to DIEL, is similar to that observed in self-organized critical systems.21
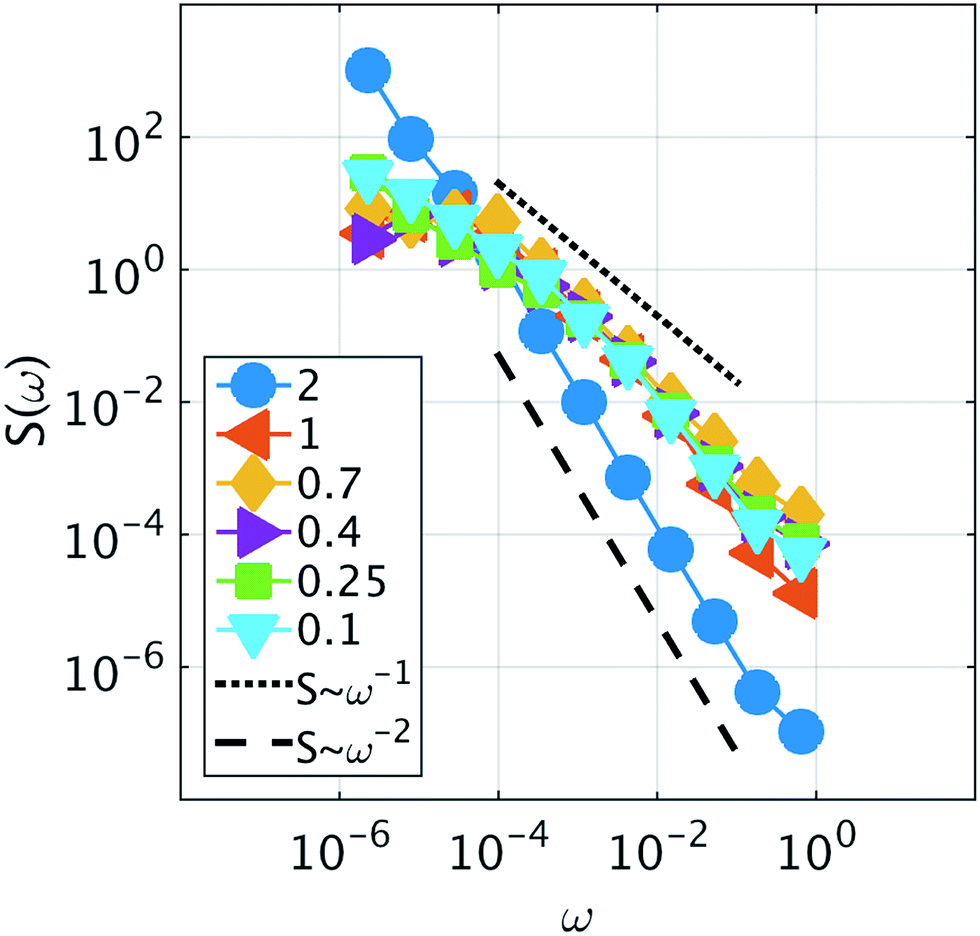 | ||
| Fig. 5 Power spectrum of the fluctuations of the order parameter fCsagg. The different series correspond to different values of ΔA/B. Two visual guidelines are provided that correspond to ω−1 and ω−2 noise. The results shown in the figure are for ρ = 0.3. | ||
We also investigate the behavior of the system in the CSO state for values of the occupancy density, ρ, ranging between 0.2 and 0.7 (Fig. 6a). We observe that the K clusters become more compact as the occupancy density increases. What is conserved across systems with different occupancy density is the thickness of the compact K phase, RK ≈ rloc (Fig. S6a†). For example, for lower ρ values the large clusters that form display hollow cores that preserve RK ≈ rloc. Using simple geometry and assuming that the micellar clusters are circular with a K core of radius RK and a corona of Cs of thickness DCs, the condition that each micelle has the same amount of Cs than K leads to 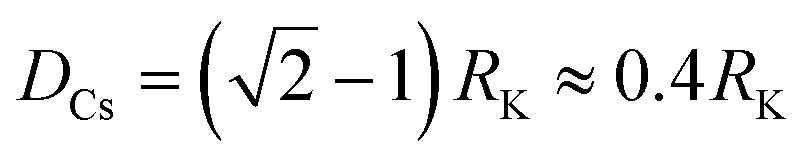 which agrees reasonably well with the numerical observations. Given this relation between RK and DCs, the question remains as to why the system tends to form micelles of size RK ≈ rloc? If the system evolves such that the activation energy barriers of Cs particles are maximized, or equivalently such that the Cs diffusivity is minimized, the clusters should evolve to a state where the total overlap area between the local neighborhood of Cs in the corona and the K particles in the core,
 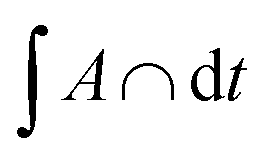 , is maximized. In fact, this analysis, shown if Fig. S6b,† reveals that
 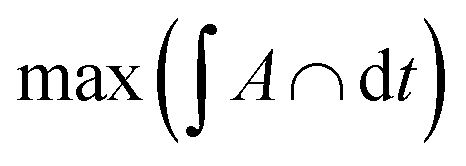 corresponds to RK/rloc ≈ 1, which agrees with the simulation data histogrammed in Fig. S6a.†
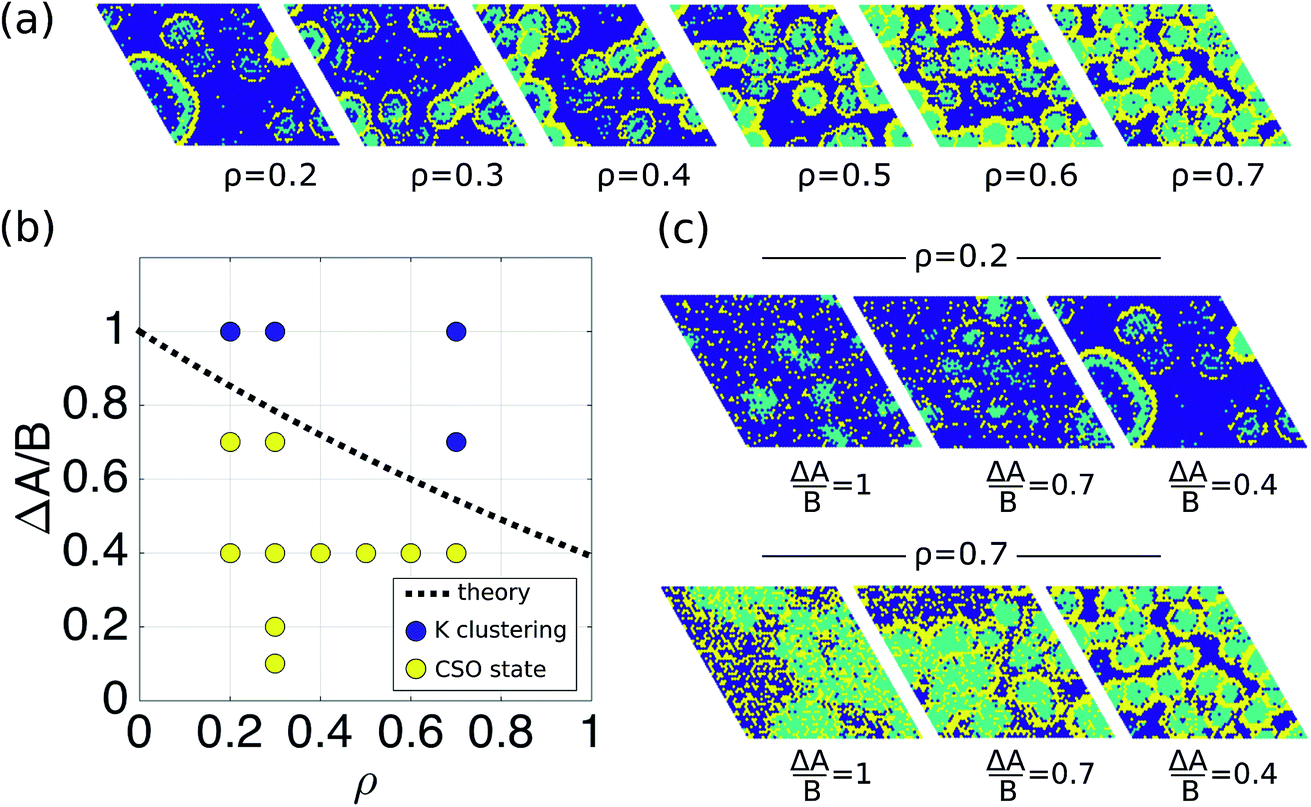 | ||
| Fig. 6 Phase behavior of the system as a function of ΔA/B and ρ. (a) Snapshots illustrating the aggregation behavior as a function of occupancy density, ρ. The snapshots corresponds to simulations where ΔA/B = 0.4. (b) Phase diagram as a function of ΔA/B and the occupation density ρ. The black line is the theoretical phase boundary between just K clustering, ΔA/B > (ΔA/B)c, and the cyclical self-organized state (CSO) with metastable micelle like clusters for ΔA/B ≤ (ΔA/B)c. The circles are results from the simulations. A system was considered to be in the CSO state if the order parameter fCsagg > 0.2. (c) Snapshots illustrating the aggregation behavior as a function of ΔA/B for two different occupancy densities, ρ = 0.2 and ρ = 0.7. | ||
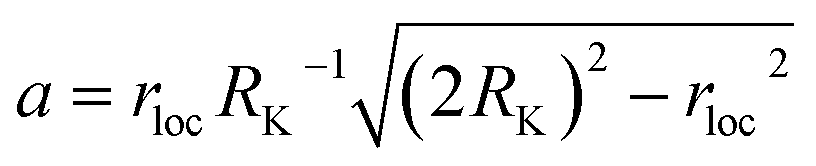
Finally, in order to provide a simple analytical model for the threshold of the adimensional parameter (ΔA/B)c under which transitions to the CSO state are observed as a function of density, we return to the condition of metastability defined in eqn (3) by analyzing ΔflocCs in the situation when K is aggregated into clusters of radius RK = rloc and Cs is still dispersed in the lattice. For mathematical simplicity, we again assume the clusters are circular, and that the unit area is a lattice site. In this configuration (flocCs)Cs ≈ 1, and the K particles with the lowest energy barriers in the system are at the boundary of the cluster. The local fraction of Cs, (flocCs)K, is by definition:
 | (4) |
| NlocK = RK2(θRK − sinθRKcosθRK) + rloc2(θrloc − sinθrloccosθrloc) | (5) |
 . The number of Cs particles in the local neighborhood is:
| NlocCs = AlocCsρlocCs | (6) |
 | (7) |
Using eqn (4)–(7), we can calculate (ΔA/B)c as a function of fundamental parameters of the model ΔA, B, f0Cs, f0K, ρ, and rloc. The dashed black line in Fig. 6b shows the relationship (ΔA/B)cvs. ρ, for the simulation conditions rloc = 4 and f0Cs = f0K = 0.5, as well as the results from the simulations for different densities. This result suggests that the transition to the CSO state is facilitated at lower occupancy densities.
Conclusion
The phase behavior of a confined binary system, in which mobilities are dependent on local concentrations of one species, is shown to undergo a metastable and cyclical self-organized state that we propose arises from a dynamical inversion of the energy landscape. In the CSO state, the system displays out-of-equilibrium aggregation and complex cyclical dynamical behavior, with micelles dissolving and reforming but lacking of any characteristic frequency. The findings reported here can be generalized to any other binary system where the diffusivity or mobility of the species, particles, or agents, depends on their local concentration, where one of the species diffuses faster than the other given the same local environment, the presence of steric repulsions between the particles or species, and a source of dissipation (which for the original clay system is the friction introduced by the nanoconfinement of ions in the clay interlayers12). For example, our model could be used to describe non-equilibrium spatial clustering of active matter systems (e.g. bacterial) where species exhibit concentration-dependent mobilities, or the phase behavior of binary granular monolayers, systems that have already been experimentally realized albeit under different conditions than that proposed here.22–24Conflicts of interest
There are no conflicts to declare.Acknowledgements
LRP and THG thank the Director, Office of Science, Office of Basic Energy Sciences, Chemical Sciences Division of the U.S. Department of Energy under Contract No. DE-AC02-05CH11231 for support. LNL gratefully acknowledges support from the Laboratory Directed Research and Development Program of Lawrence Berkeley National Laboratory under U.S. Department of Energy Contract No. DE-AC02-05CH11231. This research used resources of the National Energy Research Scientific Computing Center, a DOE Office of Science User Facility supported by the Office of Science of the U.S. Department of Energy under Contract No. DE-AC02-05CH11231.References
- G. M. Whitesides, J. P. Mathias and C. T. Seto, Molecular self-assembly and nanochemistry: a chemical strategy for the synthesis of nanostructures, DTIC Document, 1991 Search PubMed.
- O. Ikkala and G. ten Brinke, Science, 2002, 295, 2407–2409 CrossRef CAS PubMed.
- S. Zhang, Nat. Biotechnol., 2003, 21, 1171–1178 CrossRef CAS PubMed.
- S. Hormoz and M. P. Brenner, Proc. Natl. Acad. Sci. U. S. A., 2011, 108, 5193–5198 CrossRef CAS PubMed.
- S. Y. Park, A. K. R. Lytton-Jean, B. Lee, S. Weigand, G. C. Schatz and C. A. Mirkin, Nature, 2008, 451, 553–556 CrossRef CAS PubMed.
- J. D. Halverson and A. V. Tkachenko, Phys. Rev. E: Stat., Nonlinear, Soft Matter Phys., 2013, 87, 062310 CrossRef PubMed.
- C. A. Mirkin, R. L. Letsinger, R. C. Mucic and J. J. Storhoff, Nature, 1996, 382, 607–609 CrossRef CAS PubMed.
- S. Ramaswamy, Annu. Rev. Condens. Matter Phys., 2010, 1, 323–345 CrossRef.
- M. E. Cates and J. Tailleur, Annu. Rev. Condens. Matter Phys., 2015, 6, 219–244 CrossRef CAS.
- B. A. Grzybowski and W. T. S. Huck, Nat. Nanotechnol., 2016, 11, 585–592 CrossRef CAS PubMed.
- S. Mann, Nat. Mater., 2009, 8, 781–792 CrossRef CAS PubMed.
- L. Ruiz Pestana, K. Kolluri, T. Head-Gordon and L. N. Lammers, Environ. Sci. Technol., 2017, 51, 393–400 CrossRef CAS PubMed.
- R. Alert, P. Tierno and J. Casademunt, Nat. Commun., 2016, 7, 13067 CrossRef CAS PubMed.
- R. Alert, J. Casademunt and P. Tierno, Phys. Rev. Lett., 2014, 113, 198301 CrossRef PubMed.
- P. Bak, C. Tang and K. Wiesenfeld, Phys. Rev. Lett., 1987, 59, 381–384 CrossRef PubMed.
- I. Golding and E. C. Cox, Phys. Rev. Lett., 2006, 96, 098102 CrossRef PubMed.
- M. Weiss, M. Elsner, F. Kartberg and T. Nilsson, Biophys. J., 2004, 87, 3518–3524 CrossRef CAS PubMed.
- J. Tailleur and M. E. Cates, Phys. Rev. Lett., 2008, 100, 218103 CrossRef CAS PubMed.
- Y. Fily and M. C. Marchetti, Phys. Rev. Lett., 2012, 108, 235702 CrossRef PubMed.
- I. S. Aranson, A. Snezhko, J. S. Olafsen and J. S. Urbach, Science, 2008, 320, 612 CrossRef CAS PubMed.
- P. Bak, C. Tang and K. Wiesenfeld, Phys. Rev. A, 1988, 38, 364–374 CrossRef.
- M. Grunwald, S. Tricard, G. M. Whitesides and P. L. Geissler, Soft Matter, 2016, 12, 1517–1524 RSC.
- D. E. Woodward, R. Tyson, M. R. Myerscough, J. D. Murray, E. O. Budrene and H. C. Berg, Biophys. J., 1995, 68, 2181–2189 CrossRef CAS PubMed.
- J. S. Olafsen and J. S. Urbach, Phys. Rev. Lett., 1998, 81, 4369–4372 CrossRef CAS.
Footnote |
| † Electronic supplementary information (ESI) available. See DOI: 10.1039/c7sc03524a |
| This journal is © The Royal Society of Chemistry 2018 |