
Goal orientations of general chemistry students via the achievement goal framework
Scott E.
Lewis

University of South Florida, USA. E-mail: slewis@usf.edu
First published on 25th October 2017
Abstract
The Achievement Goal Framework describes students’ goal orientations as: task-based, focusing on the successful completion of the task; self-based, evaluating performance relative to one's own past performance; or other-based, evaluating performance relative to the performance of others. Goal orientations have been used to explain student success in a range of educational settings, but have not been used in post-secondary chemistry. This study describes the goal orientations of General Chemistry students and explores the relationship of goal orientations to success in the course. On average, students report higher task and self orientations than other orientation. Task orientation had a positive relationship with exam performance and self orientation had a negative relationship with exam performance. Clustering students showed that for the majority of students task and self orientations moved concurrently and students with low preference across the three orientations also performed lowest on exams. Finally, students in classes using Flipped-Peer Led Team Learning, a pedagogy designed to bring active learning to a large lecture class, showed higher task orientation than those in classes with lecture-based instruction.
Understanding aspects of chemistry students’ academic motivations can inform instructors and education researchers in their efforts to aid student success and to better understand why interventions are successful. The Achievement Goal Framework has been widely used to model students’ motivations in a variety of educational settings (Gegenfurtner and Hagenauer, 2013) but has not been used in post-secondary chemistry. This study seeks to explore the utility of this framework to describe General Chemistry students’ motivations. To do so, a questionnaire developed from the framework was administered to two independent samples of General Chemistry students and the results are related to multiple measures of academic success. Additionally, an investigation into the impact of an active learning pedagogy on student motivations is presented.
Background
Achievement goal framework
The Achievement Goal Framework describes student motivations based on their perceptions of evaluating competence. The framework describes two orientations for goal setting: mastery and performance (Elliot and McGregor, 2001). Mastery goals are task oriented, where success is judged relative to what the task requires, or intrapersonal, where success is judged relative to one's own abilities or past performances. In contrast, performance goals are necessarily interpersonal, where success is judged relative to the performance of others. The framework builds on the earlier work of Dweck (1986) who describes incremental theorist (mastery-oriented students) as using an adaptive learning pattern and valuing effort over performance. Further, these students more likely rate intelligence as fluid and seek out challenges for the purpose of developing expertise. In contrast, entity theorists (performance-oriented students) view intelligence as fixed and tend to select tasks with a high rate of success with a goal of gaining favorable judgment. Dweck and Leggett (1988) also propose that mastery orientation leads to viewing events as occurring within one's control (internal locus of control) while performance orientation leads to attributing events as occurring outside of one's control (external locus of control).The work of Elliot and colleagues has further developed the Achievement Goal Framework. First, the dimension of valence has been added where an approaching valence describes one who frames competence as approaching success while an avoidance valence describes one who frames competence as avoiding failures (Elliot and McGregor, 2001). Second, the dual components of the mastery goal construct were disentangled to task-referenced goals and intrapersonal or self-referenced goals (Elliot et al., 2011). The interaction of the three goal reference frames and two valence orientations results in six distinct goal complexes: task-approach, task-avoidance, self-approach, self-avoidance, other-approach and other-avoidance. Among these complexes, the other-approach and other-avoidance represent performance goals and the remaining four are variants of mastery goals. The interactions of the goal orientations and valence combinations are summarized in Fig. 1.
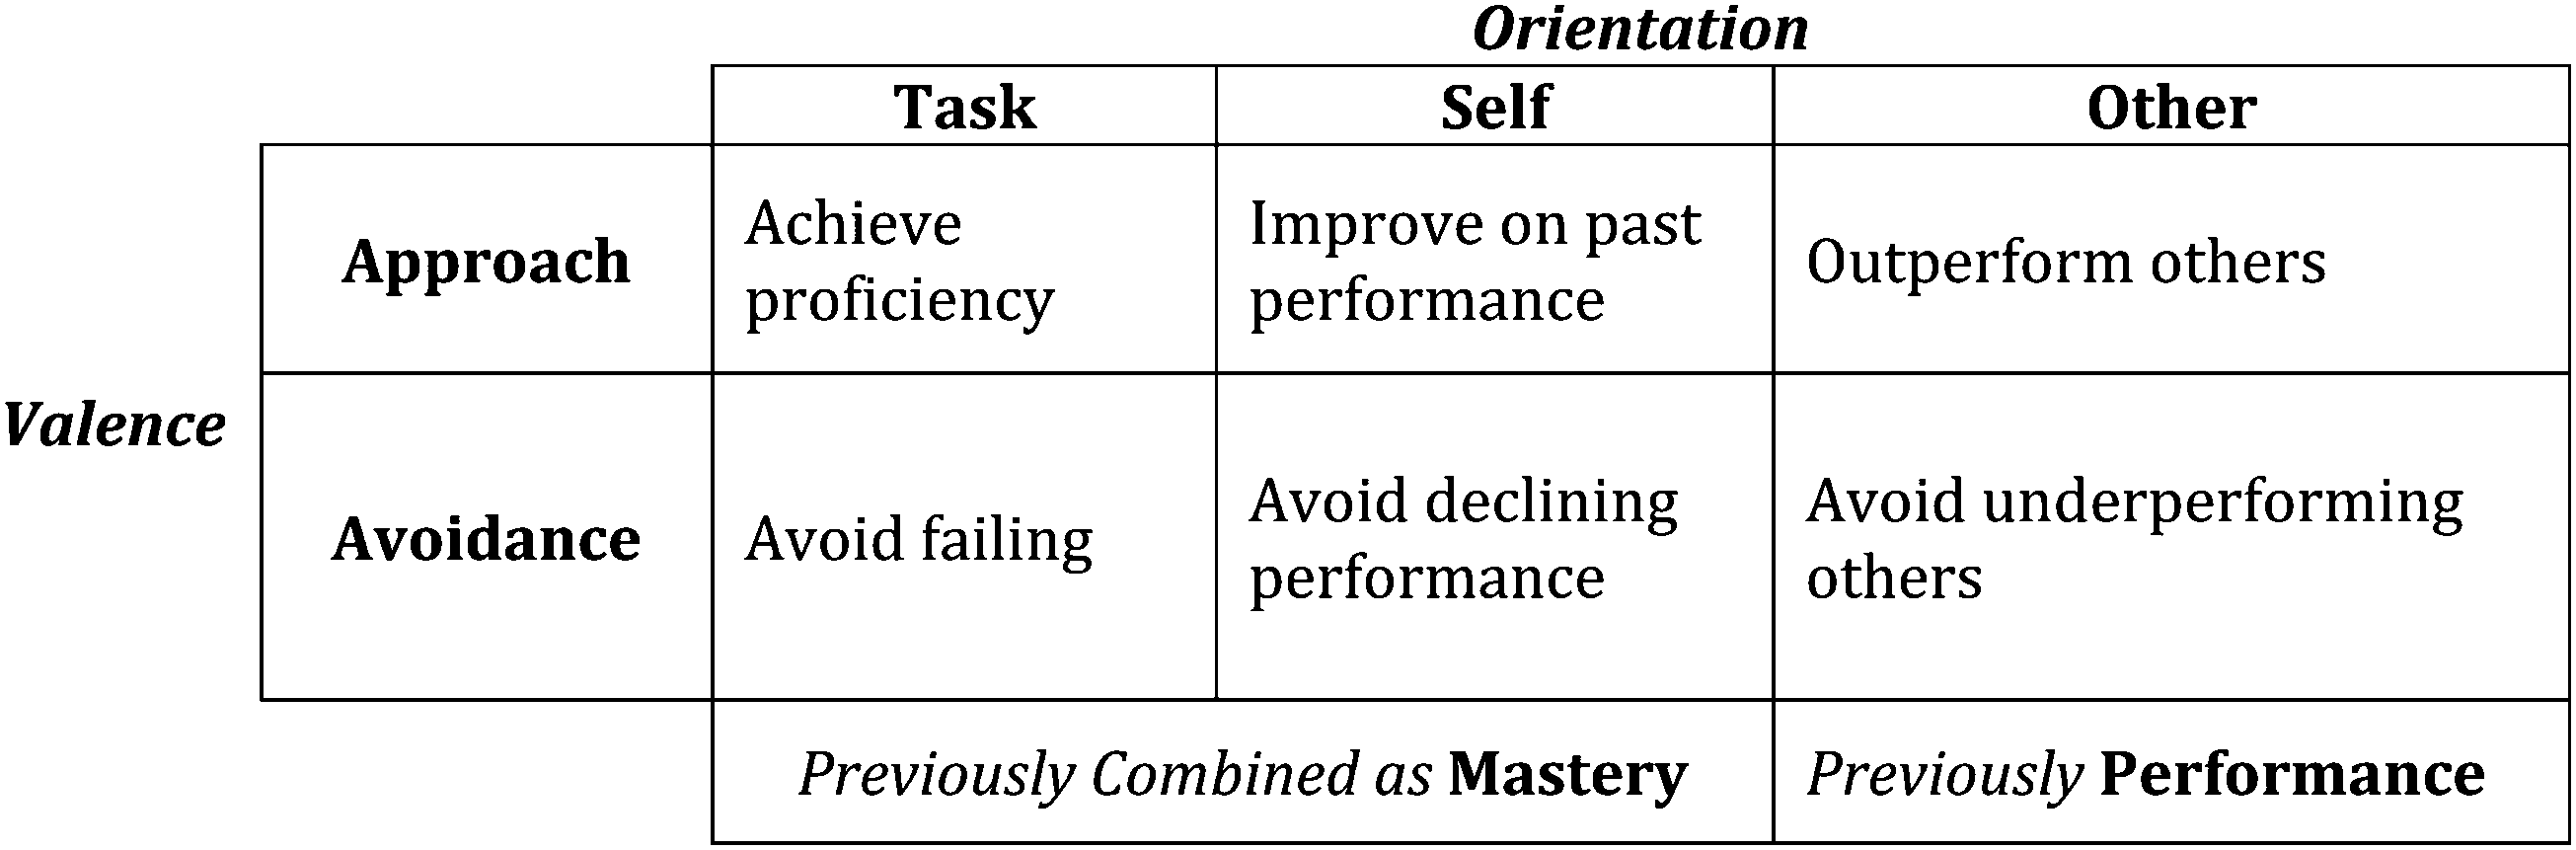 | ||
| Fig. 1 Orientation and valence interactions. | ||
3 × 2 achievement goal questionnaire
To measure participants’ orientation on the six goal complexes, the 3 × 2 Achievement Goal Questionnaire (AGQ), an eighteen item Likert-style questionnaire (three items per complex) has been developed (Elliot et al., 2011). The questionnaire asks participants to indicate how true each statement is, on a seven-point scale ranging from “Not true of me” to “Extremely true of me”. Example items on the questionnaire follow and the full instrument is available within the reference (Elliot et al., 2011).“To get a lot of questions right on the exams in this class” [Task-approach]
“To avoid incorrect answers on the exams in this class” [Task-avoidance]
“To perform better on the exams in this class than I have done in the past on these types of exams” [Self-approach]
“To avoid doing worse on the exams in this class than I normally do on these types of exams” [Self-avoidance]
“To outperform other students on the exams in this class” [Other-approach]
“To avoid doing worse than other students on the exams in this class” [Other-avoidance]
Data generated from the AGQ was validated by administering the questionnaire with post-secondary psychology students (Elliot et al., 2011). First, confirmatory factor analysis was performed to demonstrate internal fit. Second, external validity was explored by the relationship between achievement goal ratings and exam performance where other-approach was positively related and other-avoidance negatively related, relationships that held true while controlling for SAT scores. Third, task-approach was related to a measure of intrinsic motivation while other-avoidance was negatively related to intrinsic motivation and positively related to test anxiety.
Past research on achievement goals
There is an extensive literature base relating achievement goals to academic performance. Much of the research relies on the 2 × 2 AGQ that measures mastery-approach and mastery-avoidance. The 2 × 2 AGQ was a predecessor to the 3 × 2 AGQ where the 3 × 2 divided mastery into task-based and self-based competencies. In general, the mastery-approach has been positively related to academic success (Luo et al., 2014; Sparfeldt et al., 2015; Martin and Elliot, 2016). A meta-analysis found that mastery-approach had the strongest positive relationship to academic performance of the goal complexes and when demarcated by subject area the relationship was strongest within the natural sciences (Wirthwein et al., 2013). Another meta-analysis also found a positive relationship between mastery-approach and academic performance particularly when participants expected no feedback and had no time pressure (Van Yperen et al., 2015). However, there are examples where performance-approach is related to academic achievement while mastery goals were unrelated (Elliot et al., 1999; Elliot and McGregor, 2001) which may be partly explained by mastery incorporating both the task-based and self-based competencies (Benita et al., 2017).In searching the literature, one study was located that related achievement goals to academic success in chemistry (Uzuntiryaki-Kondakci and Senay, 2015). This study used the 2 × 2 AGQ and measured chemistry achievement with a 33 item multiple choice chemistry achievement test for Turkish secondary chemistry students. Correlations found the mastery-approach goal to have the strongest relation with chemistry achievement at 0.23, followed by performance-approach at 0.14 and neither of the avoidance goals having a significant correlation. A structural equation model on the data suggested that students who rate chemistry more useful rated each goal complex higher except for performance-avoidance. Additionally, the relationship between approach-oriented goal complexes and achievement was mediated by self-efficacy, which opens the possibility that goal complexes and other affective measures have some redundancy.
Achievement goal complexes have been related to a range of measures of student affect. Mastery goals have been associated with positive attitudes toward learning, enjoyment and intrinsic motivation (Elliot et al., 2011; Goetz et al., 2016; Johnson et al., 2016). Other-avoidance has been related to test anxiety (Elliot and McGregor, 2001; Elliot et al., 2011; Goetz et al., 2016). Studies have also explored the ability of affective measures to mediate the relationship between achievement goals and academic achievement. For instance, goal complexes and self-concept were found to be confounding variables in predicting academic achievement with approach valence corresponding with high self-concept and avoidance valence to low self-concept; (Luo et al., 2014; Niepel et al., 2014).
Classroom goal structure
The Achievement Goal Framework can also inform how instructional characteristics promote goal orientations through consideration of the classroom goal structure. Turner et al. (2002) describe instructional practices that promote mastery orientation as including explicit discussions with students to not feel inadequate or ashamed and “By modeling their own thinking processes, mastery-oriented teachers demonstrated that being unsure, learning from mistakes, and asking questions were natural and necessary parts of learning” (pp. 102–103). Mastery orientation can also be promoted by assessment practices that offer multiple opportunities to demonstrate proficiency and feedback that promotes learning from mistakes (Meece et al., 2006). In contrast, scoring systems that focus on comparisons among students such as curving scores or feedback that emphasizes performance of other students such as describing the class average promote a performance orientation (Meece et al., 2006). Highly competitive academic environments would also promote a performance orientation (Martin and Elliot, 2016). It is also worth recognizing that teachers have goal orientations for demonstrating competence as well, with mastery goals that focus on increasing their competence or performance goals that focus on either demonstrating teaching competence to others or not appearing incompetent (Wang et al., 2017). Teachers’ goal orientations have been found to match the classroom goal structure and teachers’ goal orientation and students’ perceptions of the classroom goal structure influence students’ achievement goals (Dresel et al., 2013; Mascret et al., 2017).Study rationale
Past research has shown the utility of students’ goal orientations in predicting academic achievement in a variety of educational settings. Research with chemistry knowledge as an outcome metric is sparse, with one identified study that relied on the prior 2 × 2 model. The purpose of the following study is to investigate the relationship between the students’ goal orientations on academic success among post-secondary chemistry students. In light of past research it is expected that mastery orientations (task or self) will have a positive relationship with academic achievement and performance avoidance will have a negative relationship with academic achievement.There is substantive evidence of the relationship of affect measures such as self-concept to chemistry achievement (Bauer, 2005; Nieswandt, 2007; Lewis et al., 2009). As past research found that goal orientations are confounding with self-concept in relating to academic performance it is likely that goal orientations will relate to academic performance in chemistry as hypothesized above. Understanding student goal orientations has an advantage, potentially, over general measures of student affect: the literature base on classroom goal structure offers concrete suggestions for instructional practices to influence students’ goal orientations. To explore the impact of instructional practice on goal orientations, this study also seeks to investigate the extent an active learning instructional practice, Flipped Peer-Led Team Learning (PLTL), can influence students’ toward productive goal orientations. Based on the literature from the classroom goal structure, it is hypothesized that Flipped PLTL's regular incorporation of formative assessments (described below) would support mastery-oriented goal orientations. By investigating this hypothesis, there is the potential to identify instructional techniques that promote productive goal orientation and subsequent improved academic performance. These two rationales are represented in the following research questions.
(1) What are the goal orientations of post-secondary General Chemistry students?
(2) Which goal orientations relate to academic success in General Chemistry?
(3) To what extent does Flipped Peer-Led Team Learning promote productive goal orientations (as determined from question 2)?
Methods
Setting
The research takes place at a large research intensive university located in the southeastern United States. At the setting, General Chemistry is run as a two-semester sequence with multiple classes of each course run each term. The data was collected during the Spring 2017 semester where four classes of first-semester General Chemistry (GC1) were offered, with class sizes ranging from 140 to 208 students, and five classes of second-semester General Chemistry (GC2) were offered with class sizes ranging from 270 to 276 students. Each course is coordinated where the different classes have agreed to a common syllabus, pace and sequence of content and constructed common exams that were administered concurrently to all classes. The content coverage can be described based on the exams as follow:• GC1, Exam 1: Structure of atom, bonding, stoichiometry and molarity
• GC1, Exam 2: Reactions in solution, gas laws, thermodynamics
• GC1, Exam 3: Quantum numbers, periodic trends, Lewis structures
• GC1, Final Exam: First-Term General Chemistry Exam from the American Chemical Society Examinations Institute(2015), cumulative exam also including molecular shapes and polarity
• GC2, Exam 1: Intermolecular forces, colligative properties, chemical kinetics
• GC2, Exam 2: Equilibrium, weak acids and bases
• GC2, Exam 3: Buffers, acid–base titrations, entropy and spontaneity
• GC2, Final Exam: Second-Term General Chemistry Exam from the American Chemical Society Examinations Institute(2014), cumulative exam also including electrochemistry
Each exam used multiple-choice questions and, except for the final exam, included a Measure of Linked Concept (Ye et al., 2015). The Measure of Linked Concept provided a single prompt and had students rate six related statements, spanning all prior content, as true, false or unsure. Students were scored as receiving 3 points for marking true or false correctly and 1 point for marking unsure to control for chance guessing. Within each exam, the Measure of Linked Concept counted for 11% of the exam score and multiple-choice questions comprised the remainder. Each exam was scored in terms of percentage of points earned and correlations among the GC1 exams ranged from 0.48 to 0.69 and among the GC2 exams from 0.67 to 0.73 indicating convergent validity. The table of correlation values is presented in the appendix.
Given the role of assessment procedures in classroom goal structure, it is necessary to detail the assessment procedures at the setting to add context to students’ goal orientations. In each course, each exam counted for 15% of students’ overall grade and the final exam counted for 25%. Additionally, 10% of the grade was determined by performance on an online homework system. In GC1, all classes included weekly PLTL sessions and attendance to these sessions was 10% of their grade with the remaining 10% coming from in-class clickers. In GG2 the remaining 20% was at instructors’ discretion. In three of the five GC2 classes in-class clickers and online quizzes were each worth 10%. The other two GC2 classes employed a Flipped PLTL approach, described below, where 5% of students’ grade was attendance, 5% was online quizzes and 10% in-class clickers.
At the conclusion of each exam, except the final exam, a copy of the exam with the correct answers highlighted was posted for students. The online course management software provided the class average on each exam for students who elected to view it. For the online homework, students had five attempts for each question with no penalty for incorrect answers. Additionally, students could view explanations to questions at the conclusion of their attempts. For in-class clicker questions, students received half credit for attempting a question and full credit for scoring the question correct. To promote clickers as a formative assessment there were an excess number of questions available for students to reach full credit, so that it was possible for students to mark up to 40% (in some classes more) of the questions incorrectly and reach full credit. Grades were determined by a point system where students earned points for completing assignments or answering questions correctly on the exam and the points earned determined the final letter grade assigned. As the final exam was externally sourced, the average score on the final exam was ten to fifteen percent lower than the in-term exams. To avoid grade deductions resulting from the nature of the exam, the difference in points between the final exam and the average in-term exam score was added to everyone's overall score. This curving of scores, equal to approximately 3% of the overall grade, was announced at the conclusion of the semester. This practice had been enacted in the past at the setting so it is possible that students were expecting it.
Flipped peer-led team learning
Flipped PLTL hybridizes two pedagogical approaches presented in the research literature. In this implementation, the class is partially flipped by creating a series of brief videos to present content outside of class. Moving the presentation of some of the content outside of class opened up class time for students to engage the content in active learning sessions. Owing to the large class sizes in GC2, peer-leaders facilitated the active learning sessions. Peer leaders are undergraduate students who have successfully completed the course who return to lead students in the target class. Each peer leader was assigned twelve to sixteen students to work with throughout the term. Peer leaders engage in weekly training that model the role of peer leader with the same weekly content their students will see. The training is meant to model facilitating active learning and to promote familiarity with the content. Peer leaders are instructed to help struggling students by providing the smallest amount of assistance needed (e.g. pointing out an equation or referencing a page in their notes) for students to continue to progress. Peer leaders are also instructed to challenge successful students to explain their reasoning and describe how their problem solving process would change under alternative conditions.Students in GC2 with the Flipped PLTL approach met twice weekly for 75 minutes, the same as the traditional classes. For one class meeting each week, content was presented in a lecture complimented with in-class clickers. For the second weekly class meeting, students worked cooperatively on problem sets in sessions facilitated by the peer leader. Student answers to the problem sets were not scored and peer leaders were trained to provide feedback focusing on the process, thus the problem sets served as regular formative assessment within the class setting meant to promote proficiency. Clickers were also used during the active learning to identify class-wide understanding that occasionally led to mini-lectures to address common misconceptions identified. Outside of class students were asked to view three to five brief videos on content (average time 5 min 33 s) and answer an online quiz on the videos preceding the active learning class each week. The Flipped PLTL class is described in more detail by Robert et al. (2016).
3 × 2 achievement goal questionnaire
The 3 × 2 AGQ was administered online during the four days preceding the first in-term exam. For GC1 it was the fourth week of the term and for GC2 it was the fifth week of the term. The AGQ features five descriptors across the seven-point scale and to format the questionnaire for online use, it was modified to a five-point scale using the same descriptors as the published instrument. Additionally, an option was included where students could decline to answer. Students received extra credit for completing the survey equal to 0.5% of their final grade in the course. For GC1, of the 757 students enrolled in the course, 704 students completed the survey. Of the 704 students 33 students withdrew during the semester. Students who chose not to answer an item (63 students) or answered consistently across every item (57 students) were removed from the data resulting in complete surveys from 551 students who completed the course. For GC2, of the 1367 students enrolled in the course, 1281 students took the survey. Of the 1281 students 32 withdrew during the semester. Students who chose not to answer an item (100 students) or answered consistently across every item (104 students) were removed from the data resulting in complete surveys from 1045 students who completed the course. The analysis will focus on students who completed the survey and completed the course. An analysis on the generalizability of the resulting samples to the overall sample on SAT scores and exam scores is presented in the appendix, in short the GC1 sample had minor deviations from the overall sample on the available data and the GC2 sample had negligible deviations from the overall sample.To investigate the structure of the dataset, the GC1 and GC2 data were combined and randomly split in half. For one half, an exploratory factor analysis was conducted using the recommendations put forth by Costello and Osborne (2005). First factors were extracted using principal axis factoring. The resulting scree plot flattened out from the fourth factor onward and the decision was made to retain three factors; this decision concurred with the guideline of retaining factors with eigenvalues greater than one. To simplify the interpretation of the factors, and in accordance with theory, an Oblimin rotation was used to model the factors as potentially correlated. The resulting pattern matrix was evaluated for loadings greater than 0.3 and seven items were loaded on one factor and six items each on the other two. For each factor the set of six items corresponded to one set of goal orientations: task, self and other. The one exception was the first self-approach item that also loaded onto the task-based factor. These results suggest that the approach-avoidance valence dimension is not differentiated among this sample and the questionnaire should be treated as providing scores for the three goal orientations.
To determine the plausibility of a three-factor model a confirmatory factor analysis was conducted on the second-half of the combined database using MPlus version 7.31. The original six-factor model proposed by Elliot et al. (2011) was first conducted, followed by the three-factor model. Each model was run using robust maximum likelihood estimator as recommended when excessive kurtosis (described below) is observed with the data (Brown, 2006, p. 379). The six-factor model was not positive definite. This is possibly owing to the linearity between the avoid-approach dimensions, where the approach-avoid pair for each goal orientation in the six-factor model had standardized loadings greater than 0.85 and self-approach and self-avoid was 0.98. The initial three-factor model showed fit indices outside of the acceptable range and examination of the modification indices suggested common residual variance between the first and third other-approach items: “To outperform other students on the exams in this class.” and “To do better than my classmates on this exam.” Given the common phrasing in these statements, the decision was made to correlate the error terms between these two items. Doing so resulted in fit indices in line with recommendations: CFI = 0.913, RMSEA = 0.070 with a 90% interval of [0.064, 0.075] and SRMR = 0.057 (Brown, 2006, p. 87). The pattern matrix, scree plot and CFA model are presented in the appendix.
Ultimately, in consideration of the exploratory factor analysis suggesting three factors, the plausibility of three factors found from confirmatory factory analysis (combined with the high loadings on approach-avoidance in the six-factor model) and the parsimony of the three-factor model, the decision was made to proceed with scoring the AGQ with three factors, each as the average of the associated six items. This decision matches an observation in the literature that found conflation between the approach and avoidance valences, as reviewed in Law et al. (2012), though the conflation may be a result of the similar phrasing between valence dimensions used within the AGQ. The Cronbach's alpha for each of the three factors for GC1 and GC2 separately are presented in Table 1. Each alpha value is greater than 0.8 indicating satisfactory internal consistency for each goal orientation construct.
| Cronbach's alpha GC1 | Cronbach's alpha GC2 | |
|---|---|---|
| Task | 0.867 | 0.871 |
| Self | 0.815 | 0.840 |
| Other | 0.918 | 0.926 |
Analytical methods
The analytical methods employed are described primarily within the results section. In brief, descriptive statistics and cluster analysis were used to detail the goal orientations of the students. Multiple regression was used to relate the goal orientations to academic performance and analysis of variance was used to compare clusters on academic performance metrics. Finally, a quasi-experimental design was used to compare the two pedagogical approaches for impact on goal orientations. All statistical analyses were conducted in SPSS 24.0 unless otherwise specified. The university's Institutional Review Board reviewed the research protocol and approved this research in accordance with institutional and local regulations.Results
Goal orientations of general chemistry students
To describe the goal orientations of General Chemistry students, descriptive statistics were calculated for GC1 and GC2 students and are presented in Table 2.| Course | GC1 (N = 551) | GC2 (N = 1045) | ||||
|---|---|---|---|---|---|---|
| Goal | Task | Self | Other | Task | Self | Other |
| Mean | 4.24 | 3.96 | 3.49 | 4.20 | 4.03 | 3.46 |
| Std. dev. | 0.68 | 0.73 | 1.04 | 0.69 | 0.72 | 1.01 |
| Median | 4.33 | 4.00 | 3.67 | 4.17 | 4.00 | 3.50 |
| Skewness | −0.90 | −0.51 | −0.62 | −0.78 | −0.68 | −0.53 |
| Skewness std. error | 0.10 | 0.076 | ||||
| Kurtosis | 0.70 | −0.045 | −0.19 | 0.47 | 0.42 | −0.23 |
| Kurtosis std. error | 0.21 | 0.15 | ||||
The mean values indicate that students overall had an orientation aligned more toward task and self with other rated the lowest. The standard deviation suggests that task and self have a more pronounced ceiling effect where some students rated these at 5.00, the highest value possible. Examining the data showed that 22.1% of students were at the ceiling for task, 12.7% for self and 6.7% for others. The ceiling effect is likely responsible for the negative skew where the positive tail was truncated by the ceiling. There is also significant positive kurtosis for task with both cohorts and self with GC2 that indicates the presence of outliers from a normal distribution. Namely the outliers are the presence of a handful of students who rated these items very low. The decision was made to retain the outliers as they may represent a meaningful description of students with orientations particularly opposed to a goal complex.
To further describe students’ goal orientations, cluster analysis was used to look for patterns among the three goal orientations. Cluster analysis is an algorithm that seeks to group students with the goal to maximize similarity within groups and minimize similarity across groups (Clatworthy et al., 2005). Cluster analysis began with a hierarchical approach where similar students are clustered together and the decision to cluster is not revisited. The metric for distance to determine similarity was squared Euclidean distance and the cluster analysis algorithm was Ward's method with both decisions meant to promote spherical groupings of students (Everitt et al., 2011). To determine the number of clusters present in the data, stopping rules were employed (Milligan and Cooper, 1985) using Stata 13, along with consideration of the uniqueness in clusters across the neighboring number of clusters, and it was determined to proceed with a five-cluster solution. Next, the data was randomly sorted and split approximately in half for each cohort. The five-cluster solution was found for each half and compared qualitatively. Each half of the sample resulted in similar qualitative descriptions of the cluster that provided an indication of the stability of the cluster solution. More information on the stopping rules and split-half reliability of the clusters is presented in the appendix.
Afterwards, the five-cluster solution was found for each cohort using the hierarchical approach described above. Finally, the solution to the hierarchical approach was used as a starting point for K-means clustering. K-means clustering is an iterative approach that revisits earlier clustering decisions to refine the cluster solution (Clatworthy et al., 2005). The technique of following hierarchical clustering with K-means clustering has been recommended to optimize the resulting cluster solution. The resulting cluster solutions are shown in Tables 3 and 4 for GC1 and GC2 respectively.
| Cluster | N (%) | Task average (SD) | Self average (SD) | Other average (SD) | Description |
|---|---|---|---|---|---|
| 1 | 175 (32%) | 4.67 (0.36) | 4.51 (0.45) | 4.55 (0.34) | High all |
| 2 | 149 (27%) | 3.87 (0.35) | 3.71 (0.38) | 3.54 (0.48) | Average all |
| 3 | 60 (11%) | 2.98 (0.54) | 2.83 (0.48) | 2.47 (0.65) | Low all |
| 4 | 99 (18%) | 4.73 (0.31) | 4.36 (0.47) | 3.38 (0.43) | Low other |
| 5 | 68 (12%) | 4.36 (0.51) | 3.50 (0.68) | 1.73 (0.57) | Very low other |
| Overall | 551 | 4.24 (0.68) | 3.96 (0.73) | 3.49 (1.04) | |
| Cluster | N (%) | Task average (SD) | Self average (SD) | Other average (SD) | Description |
|---|---|---|---|---|---|
| 1 | 290 (28%) | 4.77 (0.30) | 4.63 (0.37) | 4.52 (0.39) | High all |
| 2 | 299 (29%) | 4.01 (0.43) | 3.77 (0.47) | 3.80 (0.40) | Average all |
| 3 | 152 (15%) | 3.12 (0.56) | 3.05 (0.58) | 2.75 (0.54) | Low all |
| 4 | 202 (19%) | 4.51 (0.43) | 4.42 (0.45) | 2.93 (0.42) | Low other |
| 5 | 102 (9.8%) | 4.11 (0.58) | 3.75 (0.62) | 1.54 (0.46) | Very low other |
| Overall | 1045 | 4.20 (0.69) | 4.03 (0.72) | 3.46 (1.01) | |
Each cluster is characterized by the average across each goal orientation and qualitatively described by considering the goal orientation relative to both the overall average for the same goal orientation and to the different goal orientations within the same cluster. There was considerable similarity between the GC1 and GC2 cluster analysis results leading to identical cluster descriptions. The largest difference between cohorts is the other average of the “Low other” cluster, where GC1 is 0.45 higher than GC2, but in both cohorts the other orientation is clearly lower than task and self, leading to the same qualitative description.
In terms of relative rating of orientations the first three clusters have minimal relative differentiation among the three orientations. It is noteworthy that these three clusters comprise approximately 70% of the sample within each cohort. One possible interpretation of these three clusters may be to consider these groups of students to have a non-specific orientation, but the “High all” cluster places a greater emphasis on perceptions of competence and the “Low all” cluster places less emphasis. Across all five clusters, there is also minimal differentiation between task and self-based orientations. The only difference between task and self greater than 0.4 is in the GC1 “Very low other” where task is 0.86 greater than self.
Relationship to academic success
To investigate the relationship between goal orientations and academic success, a multiple regression was conducted relating the set of the goal orientations to each in-class exam and using Math SAT (SATM) as a covariate. SATM serves as a proxy for prior academic preparation (Lewis and Lewis, 2007) and correlations between SATM and GC1 exams range from 0.24 to 0.43 and with GC2 exams range from 0.46 to 0.58. Owing to the eight separate outcome variables leading to eight regression analyses, significance testing was set at 0.01 to limit group-wise error. The coefficients and proportion of variance (R2) for each regression analysis are presented in Tables 5 and 6.| Outcome variable (N) | Constant | b task | b self | b other | b SATM | R 2 |
|---|---|---|---|---|---|---|
| *p < 0.01. | ||||||
| Exam 1 (313) | 19.11 | 5.86* | −3.32 | 0.49 | 0.083* | 0.170 |
| Exam 2 (313) | −5.73 | 5.91* | −6.09* | 1.80 | 0.110* | 0.224 |
| Exam 3 (308) | 24.15* | 3.51 | −1.87 | 1.33 | 0.055* | 0.082 |
| Final exam (302) | −16.12 | 5.65* | −4.74* | 1.30 | 0.104* | 0.234 |
| Outcome variable (N) | Constant | b task | b self | b other | b SATM | R 2 |
|---|---|---|---|---|---|---|
| *p < 0.01. | ||||||
| Exam 1 (767) | −11.10 | 6.47* | −6.02* | 1.89* | 0.117* | 0.301 |
| Exam 2 (767) | 5.62 | 5.07* | −5.10* | 2.77* | 0.098* | 0.272 |
| Exam 3 (763) | −1.51 | 5.44* | −4.50* | 1.30 | 0.107* | 0.242 |
| Final exam (761) | −23.22 | 5.99* | −4.28* | 0.76 | 0.119* | 0.384 |
Of particular note across each regression is the consistent positive relationship between task orientation and academic performance. Task had a significant, positive relationship with seven of the eight chemistry exams. Of those seven, the coefficient ranged from 5.07 to 6.47 indicating a comparable impact across the suite of exams. In contrast, self orientation had a consistent negative relationship with academic performance which was significant on six of the eight exams. The coefficient for self implies that comparable gains in both task and self would cancel out a substantial portion of the impact of task on nearly every exam. The other approach, in most cases, did not have a significant relationship with academic performance. Re-running the analyses without SATM as a covariate led to similar results and no changes in interpretation.
Because task and self were seen as having an offsetting impact on academic performance and the cluster solution found that task and self had a covariate relationship across many of the clusters, the relationship with clusters and academic performance was investigated to support the utility of the identified clusters. An analysis of variance (ANOVA) of the GC1 clusters on each of the academic measures showed no significant relationships except with the final exam (F = 2.5, p = 0.043). This may be a result of statistical power as comparing five groups with the sample size present would have a post-hoc estimate of statistical power of 44% to detect a small effect size (defined as Cohen's f = 0.10) (Cohen, 1988). Conversely, the ANOVA power for the GC2 sample had a power of 74% to detect a small sample size and the GC2 clusters had significant differences with each of the exams. The outcome from the ANOVA with GC2 clusters is displayed in Table 7.
| Cluster | SATM average (SD) | Exam 1 average (SD) | Exam 2 average (SD) | Exam 3 average (SD) | Final exam average (SD) |
|---|---|---|---|---|---|
| High all | 596 (79) | 68.7 (20.5) | 74.7 (18.1) | 71.4 (19.7) | 58.4 (17.0) |
| Average all | 593 (78) | 69.3 (19.4) | 76.2 (17.5) | 73.0 (18.7) | 58.6 (16.8) |
| Low all | 584 (65) | 62.6 (18.6) | 68.0 (18.4) | 64.5 (20.5) | 52.2 (15.7) |
| Low other | 585 (66) | 65.0 (19.3) | 71.6 (18.8) | 69.1 (18.8) | 55.7 (15.9) |
| Very low other | 575 (77) | 63.9 (19.4) | 69.9 (16.6) | 69.8 (19.0) | 57.1 (16.9) |
| Overall | 589 (74) | 66.8 (19.7) | 73.1 (18.2) | 70.2 (19.5) | 56.9 (16.7) |
| ANOVA F-value (sig.) | 1.5 (p = 0.20) | 4.7 (p = 0.001) | 7.0 (p < 0.001) | 5.4 (p < 0.001) | 4.7 (p = 0.001) |
| Cohen's f | 0.089 | 0.13 | 0.16 | 0.14 | 0.13 |
Tukey post hoc pairwise comparisons showed a consistent relationship where the “High all” and “Average all” clusters outperformed the “Low all” cluster on each exam. The other significant result was “Low other” outperforming “Low all” on the first exam and “Very low other” outperforming “Low all” on the final exam. A review of the outcome metrics with the GC1 clusters is presented in the appendix.
Impact of Flipped PLTL on goal orientations
Within the GC2 sample two distinct instructional approaches were employed. Two of the five classes employed Flipped PLTL instruction as described above. The remaining three classes employed lecture with the regular use of clicker questions, termed traditional instruction. Students were compared across the two instructional approaches and the results are presented in Table 8.| Goal orientation | Flipped PLTL instruction (N = 422) | Traditional instruction (N = 623) | t-Value | p-Value | Cohen's d |
|---|---|---|---|---|---|
| Task | 4.26 | 4.15 | 2.61 | 0.009 | 0.16 |
| Self | 4.03 | 4.02 | 0.31 | 0.756 | 0.01 |
| Other | 3.49 | 3.44 | 0.70 | 0.481 | 0.05 |
The results of the comparison show that students in the Flipped PLTL instruction reported a higher preference of task-oriented competence on average than those in traditional instruction. The difference in average scores on the task item is just below the Cohen's description of a small effect size (d = 0.20). To determine how robust the difference is within the sample, a bootstrap operation was performed. Bootstrapping is a procedure where a sample is randomly drawn from the original sample with replacement, and this resampling procedure is repeated a specified number of times. The resulting analysis of the iterations can be used to create a 95% confidence interval that can be used to determine the robustness of the results. In bootstrapping the above data with one thousand iterations, it was found that the students with traditional instruction would have an average task value ranging between [4.08, 4.21] and students with Flipped PLTL instruction would have an average range between [4.23, 4.37]. The differences in confidence intervals suggest that while the observed difference represents a small effect size, it is likely distinguishable from random noise.
The results of the self and other orientations showed no statistical significant difference. Follow-up equivalence testing was conducted using the two one-sided t-test procedure for establishing equivalence (Lewis and Lewis, 2005). In this procedure, a symmetric confidence interval was set equal to an effect size of 0.2 and each one-sided t-test had an alpha-value of 0.025. The null hypotheses that the difference could be above or below this confidence interval were rejected providing evidence that the groups were equivalent on the self and other orientations.
Discussion
The regression results showed a positive relationship between task-based competencies and academic achievement in post-secondary chemistry. This finding was consistent across multiple exams including an external final exam and across both cohorts of general chemistry students. The impact of the task-based competencies is remediated partially by self-based competencies. Although task and self-based competencies are correlated, their correlation values of 0.57 for GC1 and 0.60 for GC2 suggest that there remains considerable independence between the measures. In contrast, the cluster analysis described student clusters where the task and self-based averages were often approximate. A likely explanation for these contrasting results is that there is some independence between task and self-based competencies present within each cluster, but the task versus self variance is marginal relative to the variance exhibited overall across the three orientations and this latter overall variation determined the establishment of clusters. This relationship can be demonstrated in comparing a scatter plot of self versus task for a random sample of all students (Fig. 2, left) to a scatter plot of a single cluster (“Average all” cluster in Fig. 2, right). In comparing the scatter plots, there is a linear trend among all students which informed the cluster creation, but in examining a single cluster self and task feature more independence. Combined, the results suggest that students who report low preference across all three constructs are at particular risk for not succeeding in chemistry, and efforts to bolster goal orientation should focus on the task-based orientation.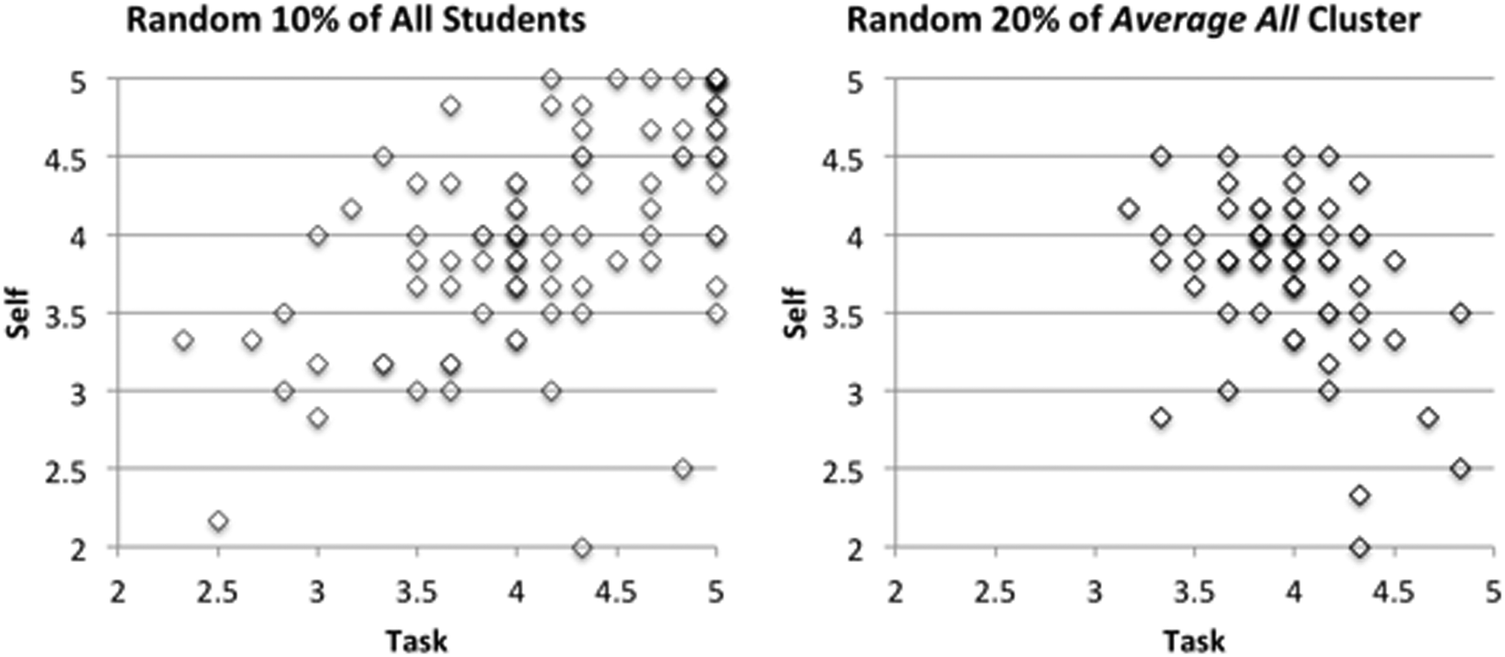 | ||
| Fig. 2 Scatter plot of a random sample of all students versus “Average all” cluster. | ||
The negative relationship between self-based competencies and academic achievement has been observed previously in the literature (Elliot et al., 2011; Diseth, 2015). One explanation advanced is that task-based competencies are less complex than self-based competencies and the complexity of self-based evaluations hinders the process of incorporating feedback into regulating learning (Elliot et al., 2011; Diseth, 2015). It is also possible that students with high self-based competencies find feedback threatening to one's self-image (Diseth, 2015). Both explanations are grounds for future research that may potentially improve academic achievement in chemistry. It is also worth noting that in the setting, academic performance was primarily evaluated by task-based competency with a point system delineating final grades and correct responses on exams earning the majority of points (Hodis et al., 2016).
The positive relationship between task-based competencies and academic achievement calls for instructional efforts to promote task-based competencies. The research literature on classroom goal structure offers potential paths forward including the incorporation of formative assessment, the inclusion of detailed feedback and the modeling of uncertainty in learning. The incorporation of Flipped PLTL advances some of the recommended traits though the pedagogy was not designed with this literature perspective. The Flipped PLTL pedagogy provides students an opportunity to receive feedback by engaging students in problem solving during class with peer leaders that are trained to monitor progress and provide feedback. Additionally, the problem sets students engage in are not scored, in line with formative assessment and modeling that learning requires the ability to make mistakes.
The higher task-based competency observed with Flipped PLTL, although small, may be attributed to the task-based focus on the problem-solving sessions. The difference of 0.11 on the task-based competency would be expected to result in gains of 0.5% to 0.7% across all exams based on the regression equations. While this gain in scores is not remarkable, it is important to consider that this is the expected average gain for 422 students enrolled in Flipped PLTL classes. The difference in task-based competencies would only partially explain the academic impact of Flipped PLTL observed in the setting. The Flipped PLTL classes performed 7% to 12% better than the traditional classes across the range of exams. The small difference on task-based competency is expected given the limited nature of the intervention at the time of the survey. Students had completed four problem-solving sessions prior to survey administration. Additionally, the small difference observed is also understandable given the ceiling effect observed, particularly with the task-based competency. Students with the traditional instruction averaged 4.15 out of a maximum score of five making the realistic opportunity to positively impact this score considerably narrow. Future research may benefit from returning to a seven-point scale in line with the original design of the AGQ (Elliot et al., 2011).
Finally, the impact of classroom goal structure on students’ goal orientations and academic performance in chemistry is a ripe area for future research. Some aspects of the goal structure in the setting are in line with literature recommendations for promoting mastery orientation, particularly the aforementioned point structure where students’ academic performance is determined independent of other students. Additionally settings on the online homework and the formatting of clicker questions permitted incorrect answers without penalty in line with expectations of formative assessment. In contrast, the addition of points to make the final exam average in line with in-term exams represents curving, an action that could promote competition and other-based goal orientations. That said much more about the classroom goal structure could be investigated. First, students’ perception of the goal structure is arguably more important than the intended goal structure. For example, students could have perceived that a curve was inevitable and subsequently framed their performance relative to others, even if no announcement was made until the conclusion of the semester. Second, instructors’ perception of the goal structure and how they articulated goals to students could also be investigated, such as the explicit and frequent incorporation of learning objectives or indicating the role of formative assessment to promote proficiency on tasks. Investigations that deliberately measure classroom goal structure or interventions to alter the classroom goal structure to improve students’ goal orientations would be warranted given the relevance of goal orientations for academic performance in chemistry.
Limitations
A primary limitation of this study is the unknown extent that the findings are generalizable to other settings. In addressing the first two research questions, describing students’ goal orientations and relating them to academic success, the results were consistent across two distinct General Chemistry classes both of which were located at the same institution. It is proposed that the relationship to academic success is applicable to other General Chemistry classes with large class sizes but data from multiple institutions would be needed to investigate this hypothesis. The third research question, the impact of a pedagogical approach on students’ goal orientations, has unique considerations. First, replication of the results at the research setting would aid in terms of the robustness of the results and investigations at other settings would be needed to explore the extent the results are generalizable. Second, the quasi-experimental study design is not able to rule out alternative explanations including the potential for students to differ on their incoming goal orientations possibly through self-selection bias into the pedagogical technique. There was no identification of pedagogical technique when students registered for the class, but students may have identified the relevant sections from previous implementations of the pedagogy. To measure change over time that could be attributed to pedagogy, future work would benefit from a pre/post research design. Finally, it is possible that the results observed could be attributed to an instructor effect and not a result of the pedagogy itself. As a brief inquiry into this possibility, data from another chemistry class taught by two of these instructors, one that used Flipped PLTL and another using traditional instruction in the data herein was examined. In the different chemistry class both instructors used lecture-based pedagogy and the observed result was opposite that observed here: the former instructor's class reported lower task scores. Ultimately, while it is not possible to control for a potential instructor effect with the data available, it may be more plausible to attribute the observed differences to the Flipped PLTL pedagogy.Conclusions
This study sought to explore the goal orientations of General Chemistry students, the relationship of goal orientations to academic performance and the impact of a pedagogical innovation on students’ goal orientations. To strengthen the findings, the investigation was conducted on two independent cohorts, comprised of GC1 and GC2 students. The results with each cohort make a consistent case that task-based orientation is positively related to academic success and self-based orientation is negatively related to academic success. The cluster analysis suggests that these orientations often track together, however students who report low preferences across the three orientations are at particular risk for not succeeding. Combined, these results suggest that future research to better understand and improve students’ task-based orientation may prove fruitful, with the incorporation of active-learning and formative assessment showing potential.The research literature indicates the benefits of modeling uncertainly, incorporating formative assessment and providing student feedback that encourages learning from mistakes in promoting students’ mastery orientation. Subsequent research has demarcated mastery orientation into task and self. The results here indicated the task orientation positively related to success in General Chemistry and the self orientation inversely related to success in General Chemistry, thus the promotion of mastery orientation, combining task and self orientations, may be expected to have mixed outcomes on academic performance. To investigate this, the impact of a Flipped PLTL pedagogical approach on students’ goal orientation was investigated with a quasi-experimental design. The pedagogy incorporated more regular formative assessment than lecture-based instruction in line with literature recommendations for promoting mastery. It was found that students within the Flipped PLTL pedagogy reported higher task orientation and comparable self orientation than students within the traditional instruction.
Finally, the results present a measure of student affect that is relevant for General Chemistry performance and suggest the potential for influencing student affect through classroom goal structure with the potential to promote academic performance in General Chemistry. Future research would benefit from designing and evaluating explicit instructional interventions in chemistry to impact classroom goal structure. Such research can explore the nature of assessment procedures, feedback and scoring; instructors' goal orientations and in-class verbiage; the treatment of uncertainty and the utilization of active learning techniques. Ultimately such interventions can be evaluated for impact on academic performance and may provide concrete instructional suggestions for increasing student success.
Conflicts of interest
There are no conflicts to declare.Appendix
Correlation values among tests
The correlation values between each of the GC1 tests ranged from 0.48 to 0.69 and among the GC2 exams from 0.67 to 0.73 indicating convergent validity. The correlation values between each exam are presented in Table 9.| Test 1 | Test 2 | Test 3 | |
|---|---|---|---|
| GC1 | |||
| Test 2 | 0.612 | ||
| Test 3 | 0.481 | 0.570 | |
| Final exam | 0.687 | 0.690 | 0.619 |
| GC2 | |||
| Test 2 | 0.706 | ||
| Test 3 | 0.677 | 0.729 | |
| Final exam | 0.732 | 0.730 | 0.731 |
Missing data considerations
The primary concern in the exclusion of missing data is the extent that the dataset with complete data is representative of the larger sample. To investigate differences between the students with complete data and the students with missing data, the two groups were compared on available SAT sub-scores and exam scores. Of the 206 GC1 students with missing data, 93 had SAT scores and 149 had exam scores available. The comparison is conducted in Table 10. It was found that the GC1 students with missing data were lower on SAT Math and higher on Exam 2, with both differences approaching a small effect size (d = 0.2). The two one-sided t-test equivalence procedure was conducted with the same parameters specified previously (alpha = 0.025, confidence interval equal to d = 0.2) and equivalence was found only on Exam 1.| Complete data average (SD) | Missing data average (SD) | Cohen's d | |
|---|---|---|---|
| SAT math | 543 (66) | 534 (66) | 0.13 |
| SAT verbal | 550 (66) | 545 (71) | 0.07 |
| Exam 1 | 77.1 (16.9) | 76.7 (17.2) | 0.02 |
| Exam 2 | 60.6 (18.4) | 62.8 (19.2) | −0.12 |
| Exam 3 | 66.4 (15.9) | 65.4 (16.2) | 0.06 |
| Final exam | 50.1 (16.4) | 50.9 (16.5) | −0.05 |
Of the 322 GC2 students with missing data, 228 had SAT scores and exam scores were available for 270 students. A similar comparison was conducted and presented in Table 11. For GC2, the largest deviation was on Exam 1 with a d = 0.055, indicating a negligible difference between the complete data and missing data samples. The same two-one sided t-test procedure was conducted and the groups were found to be equivalent on every measure. Based on the measures available, there was no evidence that indicated the GC2 sample with complete data differed from the overall sample of GC2 students.
| Complete data average (SD) | Missing data average (SD) | Cohen's d | |
|---|---|---|---|
| SAT math | 589 (74) | 588 (82) | 0.018 |
| SAT verbal | 574 (75) | 573 (76) | 0.011 |
| Exam 1 | 66.8 (19.7) | 65.7 (20.1) | 0.055 |
| Exam 2 | 73.1 (18.2) | 72.7 (19.0) | 0.022 |
| Exam 3 | 70.2 (19.5) | 69.6 (20.5) | 0.033 |
| Final exam | 56.9 (16.7) | 57.2 (16.5) | −0.017 |
Scree plot
An exploratory factor analysis was conducted on half of the combined GC1 and GC2 data set using principal axis factoring. The resulting scree plot (Fig. 3), has a consistent plateau originating from the fourth factor onward, suggesting three factors are retained in the exploratory factor analysis in line with guidelines put forth by Costello and Osborne (2005).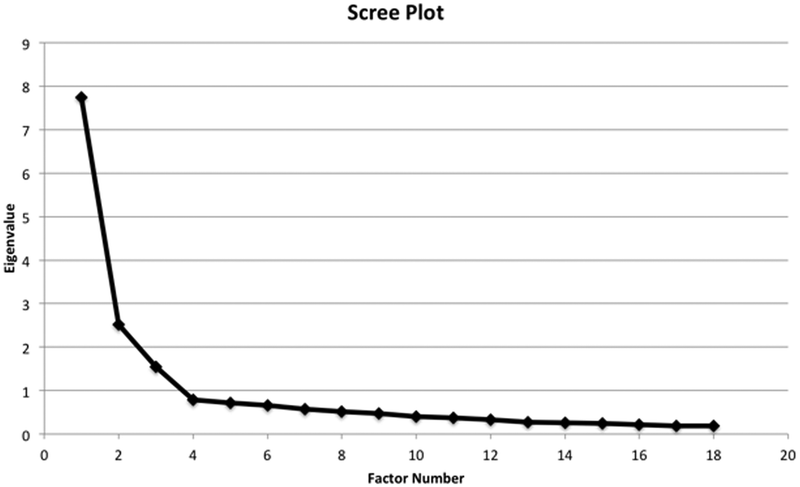 | ||
| Fig. 3 Scree plot from exploratory factor analysis. | ||
The eigenvalues and factor loadings for the retained factors are displayed in Table 12. In Table 12, the item codes indicate the survey item: the first letter stands for the orientation: T = Task, S = Self and O = Other, the next two letters represent the valence: Ap = Approach, Av = Avoidance and the digit represents the order found within the AGQ. Thus, Tap1 is the first item in Task–Approach on the AGQ. Factor loadings with an absolute value less than 0.3 are omitted.
| Factor 1 | Factor 2 | Factor 3 | |
|---|---|---|---|
| Eigenvalue (% variance) | 7.736 (43.0%) | 2.520 (14.0%) | 1.546 (8.59%) |
| TAP1 | 0.717 | ||
| TAV1 | 0.721 | ||
| SAP1 | 0.368 | −0.367 | |
| SAV1 | −0.602 | ||
| OAP1 | −0.799 | ||
| OAV1 | −0.723 | ||
| TAP2 | 0.684 | ||
| TAV2 | 0.665 | ||
| SAP2 | −0.363 | ||
| SAV2 | −0.665 | ||
| OAP2 | −0.853 | ||
| OAV2 | −0.746 | ||
| TAP3 | 0.697 | ||
| TAV3 | 0.591 | ||
| SAP3 | −0.711 | ||
| SAV3 | −0.878 | ||
| OAP3 | −0.911 | ||
| OAV3 | −0.780 |
Confirmatory factor analysis model
The standardized loadings in the confirmatory factor analysis are shown in Fig. 4. The loadings show moderate to strong relations with each item and the corresponding underlying factor, the smallest loading is Sap2, and four more loadings are also between 0.50 and 0.65.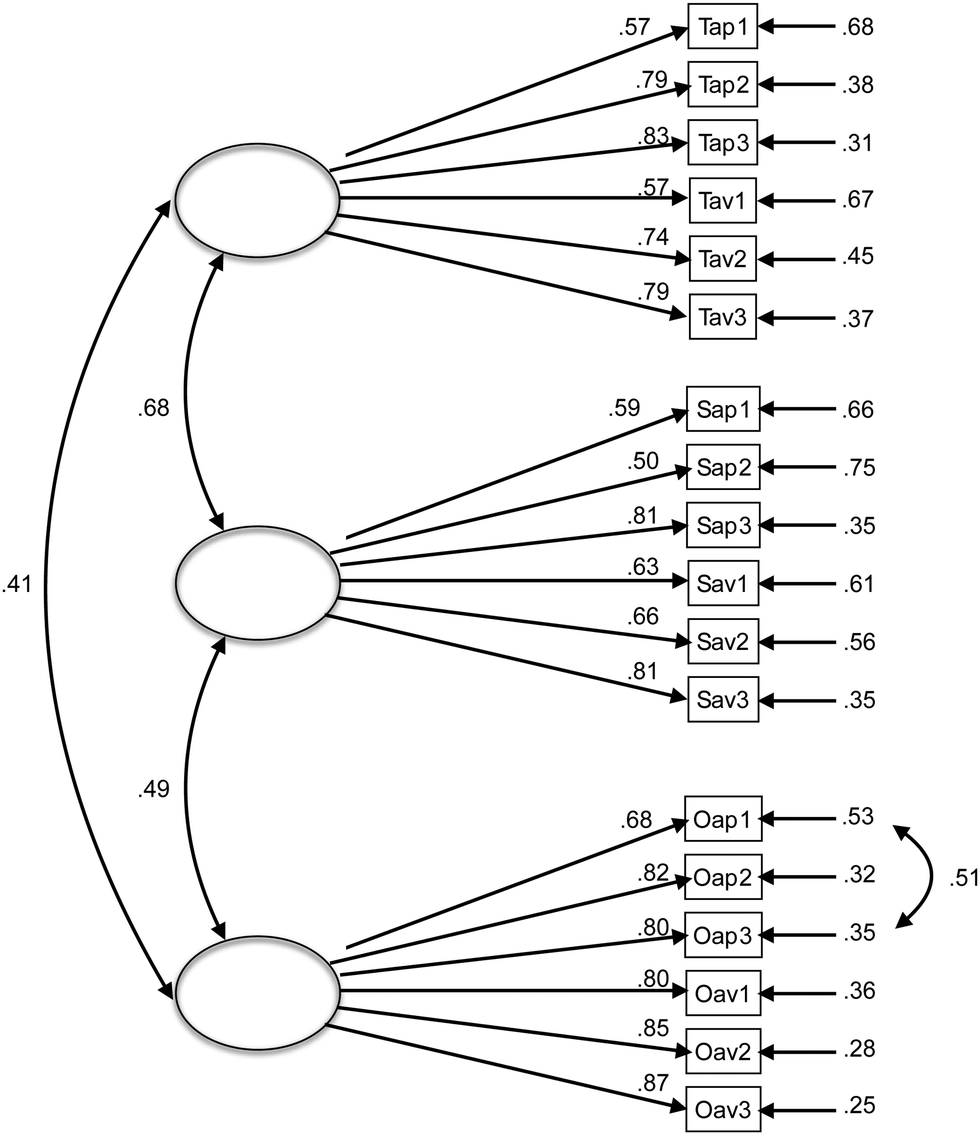 | ||
| Fig. 4 Confirmatory factor model. | ||
Stopping rules and number of clusters
Stopping rules were one consideration in determining the number of clusters. Stopping rules statistics were conducted separately on the GC1 and GC2 data with the resulting output shown in Table 13. In reviewing the C/H Pseudo-F statistic local minimum values suggest a number of clusters and in reviewing the Duda/Hart statistics local maximum for Je(2)/Je(1) and local minimum for Pseudo T-squared would suggest a number of clusters (Milligan and Cooper, 1985). In reviewing the statistics presented in Table 13, no clear number of clusters satisfies all of the criteria. However, the five cluster solution offers some strengths: it has a clear local minimum of the Pseudo T-squared with the GC1 data and a clear local maximum of the Je(2)/Je(1) statistic with the GC2 data.| Number of clusters | General Chemistry I | General Chemistry II | ||||
|---|---|---|---|---|---|---|
| C/H Pseudo-F | Duda/Hart Je(2)/Je(1) | Pseudo T-squared | C/H Pseudo-F | Duda/Hart Je(2)/Je(1) | Pseudo T-squared | |
| C/H = Calinski/Harbasz. | ||||||
| 2 | 396 | 0.76 | 81 | 591 | 0.73 | 251 |
| 3 | 293 | 0.59 | 145 | 546 | 0.63 | 272 |
| 4 | 286 | 0.64 | 157 | 542 | 0.58 | 142 |
| 5 | 277 | 0.59 | 36 | 517 | 0.67 | 151 |
| 6 | 262 | 0.60 | 77 | 484 | 0.51 | 158 |
| 7 | 259 | 0.70 | 73 | 472 | 0.65 | 202 |
| 8 | 253 | 0.57 | 68 | 477 | 0.51 | 105 |
| 9 | 249 | 0.59 | 26 | 473 | 0.69 | 119 |
| 10 | 244 | 0.64 | 46 | 464 | 0.68 | 107 |
Other considerations are in contrast the C/H Pseudo-F statistic suggests continual expanding of the number of clusters up to ten, with one exception. The local maximum of the GC1 Je(2)/Je(1) statistic suggests two or seven clusters and the local minimum of the GC2 Pseudo T-squared suggests four, eight or ten clusters. Ultimately, the five cluster solution was deemed to have the most support from the stopping rules.
Split-half reliability of cluster analysis
To support the validity of the clusters found, the data was randomly divided in half and a cluster analysis was performed on each half independently (Clatworthy et al. 2005). The results from the cluster analysis with GC1 are presented in Table 14. Each half was qualitatively described and it was found that the proposed cluster solution for each half had substantial agreement. The largest differences occurred for the “Low other” self-based orientation (0.83) but the “Low other” description appropriately describes the relative position of each construct for each cluster. A similar rationale describes the “Very low other” while the absolute values for self and other are different by 0.55 and 0.58 respectively.| % of N | Task | Self | Other | Description | Task | Self | Other | % of N |
|---|---|---|---|---|---|---|---|---|
| 49 | 4.61 | 4.48 | 4.34 | High all | 4.68 | 4.52 | 4.24 | 39 |
| 8.2 | 3.66 | 3.49 | 3.67 | Average all | 4.00 | 3.81 | 4.08 | 15 |
| 9.7 | 2.96 | 2.85 | 2.51 | Low all | 3.41 | 3.37 | 2.89 | 29 |
| 22 | 4.56 | 4.06 | 3.09 | Low other | 4.77 | 3.23 | 2.63 | 8.8 |
| 10 | 4.12 | 3.28 | 1.80 | Very low other | 4.32 | 3.83 | 1.22 | 8.5 |
| N = 267 | 4.31 | 4.02 | 3.57 | Overall | 4.18 | 3.91 | 3.43 | N = 284 |
The split-half cluster solutions for GC2 are presented in Table 15. Notably, the fourth cluster was initially termed “High task” owing to the high task score relative to the self and other scores. This cluster is renamed “Low other” in the manuscript after the K-means iteration resulted in new averages. In comparing the clusters, GC2 offers more agreement than GC1, likely owing to the larger initial sample size of GC2. The largest differences among the GC2 clusters is 0.61 between the “High task” other construct and then 0.37 between the “Very low other” task rating. All other differences were less than 0.25.
| % of N | Task | Self | Other | Description | Task | Self | Other | % of N |
|---|---|---|---|---|---|---|---|---|
| 31 | 4.70 | 4.53 | 4.53 | High all | 4.73 | 4.50 | 4.38 | 35 |
| 34 | 3.94 | 3.79 | 3.47 | Average all | 3.96 | 3.79 | 3.50 | 29 |
| 14 | 3.01 | 2.90 | 2.71 | Low all | 2.98 | 3.15 | 2.87 | 11 |
| 12 | 4.75 | 4.45 | 3.27 | High task | 4.72 | 4.54 | 2.66 | 15 |
| 9.9 | 4.23 | 3.95 | 1.62 | Very low other | 3.86 | 3.70 | 1.67 | 10 |
| N = 546 | 4.17 | 3.99 | 3.49 | Overall | 4.22 | 4.07 | 3.43 | N = 499 |
Relation of GC1 clusters to academic performance
The relationship of the GC1 clusters to academic measures is presented in Table 16. The scale of the effect sizes (Cohen's f) observed in Table 16 is slightly less in magnitude than the GC2 data, which ranged from 0.13 to 0.16 (Table 7) though there is some overlap. This supports the argument that the smaller GC1 sample size resulted in lower statistical power as the primary reason for not finding statistical significance.| Cluster | SATM average (SD) | Exam 1 average (SD) | Exam 2 average (SD) | Exam 3 average (SD) | Final exam average (SD) |
|---|---|---|---|---|---|
| High all | 550 (67) | 78.3 (15.0) | 61.7 (18.8) | 67.3 (15.3) | 51.2 (16.7) |
| Average all | 535 (60) | 75.2 (18.0) | 58.6 (17.5) | 65.5 (15.2) | 47.4 (15.7) |
| Low all | 557 (67) | 73.6 (18.2) | 59.0 (19.4) | 63.9 (18.7) | 47.4 (16.2) |
| Low other | 540 (70) | 77.3 (17.1) | 61.0 (18.6) | 66.8 (15.1) | 51.3 (15.8) |
| Very low other | 533 (73) | 80.8 (16.8) | 63.3 (20.3) | 67.9 (17.1) | 53.8 (17.5) |
| Overall | 543 (66) | 77.1 (16.8) | 60.6 (18.4) | 66.4 (15.9) | 50.1 (16.4) |
| ANOVA F-value (sig.) | 1.22 (0.30) | 2.17 (0.071) | 1.09 (0.36) | 0.79 (0.53) | 2.48 (0.043) |
| Cohen's f | 0.13 | 0.13 | 0.090 | 0.077 | 0.14 |
In qualitatively reviewing the GC1 clusters the “Low all” cluster was consistently below average and had the lowest score on all four exams except for Exam 2 where it was 0.4% from the lowest. This trend is similar to the GC2 data where “Low all” was the lowest performing cluster on every exam. The primary difference is that in the GC1 data the “Very low other” cluster is the highest performing cluster on every exam while in the GC2 data the “Average all” is the highest performing cluster. This is likely owing to the GC1 “Very low other” cluster having a more pronounced task score relative to self score than the GC2 “Very low other” cluster. This finding corresponds to the regression interpretation where task is positively related to success and self is negatively related.
Acknowledgements
Partial support for this work was provided by the National Science Foundation's Improving Undergraduate STEM Education (IUSE) program under DUE-1432085. Any opinions, findings, and conclusions or recommendations expressed in this material are those of the author and do not necessarily reflect the views of the National Science Foundation.References
- Bauer C. F., (2005), Beyond “Student Attitudes”: Chemistry Self-Concept Inventory for Assessment of the Affective Component of Student Learning, J. Chem. Educ., 82, 1864–1869.
- Benita M., Shane N., Elgali O. and Roth G., (2017), The important role of the context in which achievement goals are adopted: an experimental test, Motiv. Emotion, 41, 180–195.
- Brown T. A., (2006), Confirmatory Factor Analysis for Applied Research, New York, NY: The Guilford Press.
- Clatworthy J., Buick D., Hankins M., Weinman J. and Horne R., (2005), The use and reporting of cluster analysis in health psychology: a review, Br. J. Health Psychol., 10, 329–358.
- Cohen J., (1988), Statistical Power Analysis for the Behavioral Sciences, Hillsdale: Lawrence Erlbaum Associates.
- Costello A. B. and Osborne J. W., (2005), Best Practices in Exploratory Factor Analysis: Four Recommendations for Getting the Most From Your Analysis, Pract. Assess. Res. Eval., 10, 1–9.
- Diseth A., (2015), The advantages of task-based and other-based achievement goals as standards of competence, Int. J. Educ. Res., 72, 59–69.
- Dresel M., Fashing M. S., Steuer G., Nitsche S. and Dickhaeuser O., (2013), Relations between Teachers' Goal Orientations, Their Instructional Practices and Students' Motivation, Psychology, 4, 572–584.
- Dweck C. S., (1986), Motivational Processes Affecting Learning, Am. Psychol., 41, 1040–1048.
- Dweck C. S. and Leggett E. L., (1988), A Social-Cognitive Approach to Motivation and Personality, Psychol. Rev., 95, 256–273.
- Elliot A. J. and McGregor H. A., (2001), A 2 × 2 Achievement Goal Framework, J. Pers. Soc. Psychol., 80, 501–519.
- Elliot A. J., McGregor H. A. and Gable S., (1999), Achievement Goals, Study Strategies, and Exam Performance: A Mediational Analysis, J. Educ. Psychol., 91, 549–563.
- Elliot A. J., Murayama K. and Pekrun R., (2011), A 3 × 2 Achievement Goal Model, J. Educ. Psychol., 103, 632–648.
- Everitt B. S., Landau S., Leese M. and Stahl D., (2011), Cluster Analysis, West Sussex, UK: John Wiley & Sons, Ltd.
- Examinations Institute of the American Chemical Society Division of Education, (2014), Second-Term General Chemistry Exam, Milwaukee, WI: University of Wisconsin–Milwaukee.
- Examinations Institute of the American Chemical Society Division of Education, (2015), First-Term General Chemistry Exam, Milwaukee, WI: University of Wisconsin–Milwaukee.
- Gegenfurtner A. and Hagenauer G., (2013), Achievement goals and achievement goal orientations in education, Int. J. Educ. Res., 61, 1–4.
- Goetz T., Sticca F., Pekrun R., Murayama K. and Elliot A. J., (2016), Intraindividual relations between achievement goals and discrete achievement emotions: an experience sampling approach, Learn. Instruct., 41, 115–125.
- Hodis F. A., Tait C., Hodis G. M., Hodis M. A. and Scornavacca E., (2016), Analyzing student motivation at the confluence of achievement goals and their underlying reasons: an investigation of goal complexes, Soc. Psychol. Educ., 19, 643–660.
- Johnson M. L., Taasoobshirazi G., Clark L., Howell L. and Breen M., (2016), Motivations of Traditional and Nontraditional College Students; From Self-Determination and Attributions, to Expectancy and Values, J. Contin. High. Educ., 64, 3–15.
- Law W., Elliot A. J. and Murayama K., (2012), Perceived Competence Moderates the Relation Between Performance–Approach and Performance–Avoidance Goals, J. Educ. Psychol., 104, 806–819.
- Lewis S. E. and Lewis J. E., (2005), The Same or Not the Same: Equivalence as an Issue in Educational Research, J. Chem. Educ., 82, 1408–1412.
- Lewis S. E. and Lewis J. E., (2007), Predicting at-risk students in General Chemistry: comparing formal thought to a general achievement measure, Chem. Educ. Res. Pract., 8, 32–51.
- Lewis S. E., Shaw J. L. and Heitz J. O., (2009), Attitude Counts: Self-Concept and Success in General Chemistry, J. Chem. Educ., 86, 744–749.
- Luo W., Hogan D., Tan L. S., Kaur B., Ng P. T. and Chan M., (2014), Self-construal and students' math self-concept, anxiety and achievement: an examination of achievement goals as mediators, Asian J. Soc. Psychol., 17, 184–195.
- Martin A. J. and Elliot A. J., (2016), The role of personal best (PB) and dichotomous achievement goals in students' academic motivation and engagement: a longitudinal investigation, Educ. Psychol., 36, 1285–1302.
- Mascret N., Elliot A. J. and Cury F., (2017), The 3 × 2 Achievement Goal Questionnaire for Teachers, Educ. Psychol., 37, 346–361.
- Meece J. L., Anderman E. M. and Anderman L. H., (2006), Classroom Goal Structure, Student Motivation, and Academic Achievement, Annu. Rev. Psychol., 57, 487–503.
- Milligan G. W. and Cooper M. C., (1985), An Examination of Procedures for Determing the Number of Clusters in a Data Set, Psychometrika, 50, 159–179.
- Niepel C., Brunner M. and Preckel F., (2014), Achievement goals, academic self-concept, and school grades in mathematics: Longitudinal reciprocal relations in above average ability secondary school students, Contemporary Educ. Psychol., 39, 301–313.
- Nieswandt M., (2007), Student Affect and Conceptual Understanding in Learning Chemistry, Journal of Research in Science Teaching, 44, 908–937.
- Robert J., Lewis S. E., Oueini R. and Mapugay A., (2016), Coordinated Implementation and Evaluation of Flipped Classes and Peer-Led Team Learning in General Chemistry, J. Chem. Educ., 93, 1993–1998.
- Sparfeldt J. R., Brunnemann N., Wirthwein L., Buch S. R., Schult J. and Rost D. H., (2015), General versus specific achievement goals: a re-examination, Learn. Individ. Differ., 43, 170–177.
- Turner J. C., Midgley C., Meyer D. K., Gheen M., Anderman E. M., Kang Y. and Patrick H., (2002), The Classroom Environment and Students' Reports of Avoidance Strategies in Mathematics: A Multimethod Study, J. Educ. Psychol., 94, 88–106.
- Uzuntiryaki-Kondakci E. and Senay A., (2015), Predicting Chemistry Acheivement through Task Value, Goal Orientations, and Self-Efficacy: A Structural Model, Croat. J. Educ., 17, 725–753.
- Van Yperen N. W., Blaga M. and Postmes T., (2015), A Meta-Analysis of the Impact of Situationally Induced Achievement Goals on Task Performance, Hum. Perform., 28, 165–182.
- Wang H., Hall N. C., Goetz T. and Frenzel A. C., (2017), Teachers' goal orientations: effects on classroom goal structures and emotions, Br. J. Educ. Psychol., 87, 90–107.
- Wirthwein L., Sparfeldt J. R., Pinquart M., Wegerer J. and Steinmayr R., (2013), Achievement goals and academic achievement: a closer look at moderating factors, Educ. Res. Rev., 10, 66–89.
- Ye L., Oueini R. and Lewis S. E., (2015), Developing and Implementing an Assessment Technique to Measure Linked Concepts, J. Chem. Educ., 92, 1807–1812.
| This journal is © The Royal Society of Chemistry 2018 |