 Open Access Article
Non-photochemical catalytic hydrolysis of methyl parathion using core–shell Ag@TiO2 nanoparticles†
Somayeh Talebzadeha,
Florian Foratob,
Bruno Bujolib,
Scott A. Trammellc,
Stéphane Grolleaud,
Hemant Pala,
Clémence Queffélec *b and
D. Andrew Knight
 *a
*a
aChemistry Department, Florida Institute of Technology, 150 West University Boulevard, Melbourne, Florida 32901, USA. E-mail: aknight@fit.edu
bChimie Et Interdisciplinarité: Synthèse Analyse Modélisation (CEISAM), Université de Nantes, CNRS, UMR 6230, 2, rue de la Houssinière, BP 92208, 44322 Nantes Cedex 3, France. E-mail: clemence.queffelec@univ-nantes.fr
cUS Naval Research Laboratory, 4555 Overlook Avenue, SW, Washington, DC 20375, USA
dInstitut des Matériaux Jean Rouxel, CNRS-Université de Nantes, 2 rue de la Houssinière, B. P. 32229, 44322 Nantes Cedex 3, France
First published on 19th December 2018
Abstract
Highly water-dispersible core–shell Ag@TiO2 nanoparticles were prepared and shown to be catalytically active for the rapid degradation of the organothiophosphate pesticide methyl parathion (MeP). Formation of the hydrolysis product, p-nitrophenolate was monitored at pH 7.5 and 8.0, using UV-Vis spectroscopy. 31P NMR spectroscopy confirmed that hydrolysis is the predominant pathway for substrate breakdown under non-photocatalytic conditions. We have demonstrated that the unique combination of TiO2 with silver nanoparticles is required for catalytic hydrolysis with good recyclability. This work represents the first example of MeP degradation using TiO2 doped with AgNPs under mild and ambient conditions. Analysis of catalytic data and a proposed dark mechanism for MeP hydrolysis using core–shell Ag@TiO2 nanoparticles are described.
1. Introduction
Titanium dioxide (TiO2) is a well-known wide-bandgap (3.2 eV) semiconductor which upon irradiation with UV light results in conduction band electron (eCB−)–valence band hole (hVB+) charge separation. Positively charged hVB+ combine with water to generate highly oxidizing hydroxyl radicals which can further react. The photocatalytic applications of TiO2 are extensive and include water splitting, oxidation of organic compounds such as VOCs, waste-water treatment, antibacterial coatings, removal of air-borne pollutants such as NOX gases, to name a few. TiO2 is also known for its chemical stability, highly reactive surface, low cost and minimal environmental impact and therefore its commercial use has increased steadily over the last few decades. The doping of TiO2 with metal nanoparticles, metal ions, and metal oxides has resulted in some interesting chemical properties with many possessing increased oxidizing ability. Adding metal nanoparticles to metal oxides such as TiO2 can give rise to metal–semiconductor heterojunctions which in turn may increase photocatalytic activity. Modification of TiO2 with dopants such as fluoride anion, germanium cation and cerium dioxide (CeO2) gives hybrid materials possessing modified physical and chemical properties, and these materials were used for the decontamination of phosphate esters under ambient conditions.1–4 TiO2 can also be modified with noble metal nanoparticles such as silver and gold. Core–shell Ag@TiO2 nanoparticles have the advantages of (i) higher surface interaction between silver ions and the oxide surface, (ii) reduced release of relatively toxic silver ions into the environment and (iii) protection of AgNPs core against oxidation. Ag@TiO2 nanocomposites have been studied as photocatalysts. The photoreduction of CO2 to CO, CH4 and CH3OH (reverse water gas shift reaction) was shown to occur using AgNPs coated onto TiO2 nanowires under both UV and visible light.5 The authors' explanation for the high catalytic activity involved light absorption due to localized surface plasmon resonance excitation of the nanoparticle, the formation of trapped electrons, and a low charge recombination rate. A non-plasmonic electron transfer from TiO2 to AgNPs was suggested for the mechanism of methanol and ethene photo-oxidation using AgNPs in direct contact with TiO2 thin films.6 Ag@TiO2 has also been used as catalyst for the reaction of aldehydes with 2-aminophenol.7We have been developing a research program directed towards the use of plasmonic materials in laser assisted homogeneous catalysis, and we recently described the use of copper(II) bipyridine functionalized core–shell Ag@TiO2 nanoparticles for the classical Ullman coupling reaction.8 In other work, we reported the use of gold nanoparticles (AuNPs) for the degradation of methyl parathion (MeP).9 MeP is a broad-spectrum organothiophosphate insecticide and hazardous pollutant. MeP also serves as a structural mimic for organophosphate nerve agents, and is often used as a model substrate for studies on the catalytic degradation of chemical warfare agents, which are known to act as acetylcholinesterase inhibitors (e.g. VX, soman, tabun).10 New methods for MeP removal from the environment, and studies on the mechanistic pathways for MeP breakdown (e.g. hydrolysis vs. oxidation) are of interest to environmental chemists.
Metal oxides such as MnO2 are known to hydrolyze MeP and the mechanism likely involves coordination of the P![[double bond, length as m-dash]](https://www.rsc.org/images/entities/char_e001.gif) S moiety to Mn2+.11 Zinc oxide supported on polyacrylonitrile fibers was found to be effective for MeP decontamination involving a hydrolytic mechanism.12 Cerium oxide has also been used for the degradation of a number of organophosphate pesticides.13 Lastly, TiO2 based materials have been used for organophosphate ester decomposition.14–18
S moiety to Mn2+.11 Zinc oxide supported on polyacrylonitrile fibers was found to be effective for MeP decontamination involving a hydrolytic mechanism.12 Cerium oxide has also been used for the degradation of a number of organophosphate pesticides.13 Lastly, TiO2 based materials have been used for organophosphate ester decomposition.14–18
The photocatalytic properties of Ag@TiO2 nanoparticle films have been reported for MeP degradation and a remarkable increase in the photocatalytic activity of TiO2 was observed, followed by deposition of AgNPs on the surface of the TiO2 film.19 However, the dark activity of the nanocomposites for MeP degradation was negligible. Herein, we describe the use of core–shell Ag@TiO2 for the hydrolysis of MeP in the dark and under relatively mild conditions, and we tentatively suggest a non-photochemical mode of action involving increased Lewis acidity of the oxide surface mediated by the presence of Ag nanoparticles.
2. Experimental section
2.1. General data
All 31P NMR spectra were recorded on a Bruker Avance 400 spectrometer and externally referenced to 85% H3PO4 in D2O. NMR spectra were processed using iNMR v3.4.UV-visible absorption spectra were recorded at room temperature on HP8453 diode array spectrometers in 1.0 cm cuvettes. Nanoparticle morphology was determined using a 1230 Jeol transmission electron microscope working at a voltage of 120 keV using holey carbon-coated copper grids (300 mesh). PXRD measurements were performed from 2 to 40° (in the 2θ axis) using a Bruker D8 Advance Xray diffractometer with CuKα radiation (λ = 1.5406 Å) with a Bragg–Brentano assembly.
ζ-Potential values were recorded in carbon-coated cells (Horiba) using an Horiba Instrument SZ-100 at 25 °C under a scattering angle of 90° at 532 nm. To measure the isoelectric point (IEP), the pH of the Ag@TiO2 dispersions were adjusted within the range 2 to 9 using either HNO3 or NaOH solutions.20 Total Ag+ content and dissolved Ag+ ions concentrations were determined using a Perkin-Elmer Model 5000 atomic absorption spectrometer. To determine Ag+ ion concentrations Ag@TiO2 nanocomposites were dispersed in aqueous media, buffered at pH = 8 using MOPS (20 mM). Aliquots were taken at intervals and after separating the nanocomposites using centrifugation, the supernatant was analysed. LC-MS analyses were performed on an Agilent 1260 chromatography module using a 3.0 × 50 mm, 2.7 micron Poroshell 120 EC-C18 column with a 0.40 mL min−1 flow rate. Samples were eluted with a gradient starting from 85% H2O to 15% MeOH (0.1% formic acid) to 10% H2O to 90% MeOH over a period of 7 min. Mass spectra were obtained on an Agilent 6120 quadropole mass spectrometer using an ESI/APCI technique. Scanning electron microscopy was carried out using a Jeol field emission gun SEM JSM 7600F. N2 adsorption/desorption analyses were performed after treatment under vacuum at 100 °C using a Micromeritics 3Flex surface characterization analyzer. The specific surface area was determined using the BET model and the pore size dimensions were calculated using the Barret–Joyner–Halenda (BJH) method.
Reagents and solvents were obtained as follows and used as received: 3-morpholinopropane-1-sulfonic acid and its corresponding sodium salt, AgNO3, cetyltrimethylammonium bromide, methyl parathion, parathion, methyl paraoxon, paraoxon, malathion (PESTANALR), anhydrous 200 proof ethanol (Sigma-Aldrich), 2-(cyclohexylamino)ethanesulfonic acid, titanium(IV) isopropoxide, N2H4·8H2O (Fisher Scientific), methanol (HPLC grade, Fisher Scientific), diazinon (Chem Service). All stock solutions and buffers were freshly prepared using Millipore Direct-Q 18.2 MΩ H2O.
2.2. Synthesis of Ag@TiO2
Ag@TiO2 nanoparticles were prepared according to the literature procedure.8,21 An aqueous solution of hydrazine monohydrate (0.50 mL, 100 mM) was added to an aqueous solution of CTAB (20 mL, 1.0 mM) and stirred for 1 min. Then, an aqueous solution of silver nitrate (0.50 mL, 50 mM) was added dropwise and stirred for 30 minutes to give a yellow suspension of silver nanoparticles. A solution of TTIP in absolute ethanol (25 mL, 1.0 mM) was then added, and the mixture was vigorously stirred for 30 minutes until a brown suspension was formed. The Ag@TiO2 suspension was centrifuged (3800 rpm, 30 min) and the supernatant was carefully removed via pipettor. The resulting pellet was washed with ethanol (40 mL) and DI H2O (2 × 40 mL) and then redispersed in 40 mL of DI H2O to give a stable solution.For larger scale synthesis (×10), a Ag@TiO2 sample was prepared as described above and the solution freeze-dried for 4 days. For the TiO2 sample, the synthesis was identical to that described above (×10) but prepared in the absence of silver nitrate solution. After 30 min of stirring, the precipitate was isolated by filtration on a membrane with a pore size of 0.22 μm and dried at 100 °C overnight.
2.3. Methyl parathion hydrolysis
Catalytic experiments were performed in 20 mL screw-capped vials protected from light and maintained at room temperature. Ag@TiO2 nanoparticles were sonicated for 10 min to obtain a dispersion and were added to a solution of organophosphate in MOPS/MeOH with a concentration of 5.28 × 10⁻⁸ M Ag. Based on atomic absorption measurements, the total concentration of silver ions was determined at 56 mg L−1, close to the theoretical value of 65 mg L−1. By assuming an average nanoparticle diameter of 20 nm from TEM images, a concentration of 1.27 × 10¹⁵ particles per L of AgNPs is estimated for the reaction mixture.22 Experiments were conducted with initial concentrations of organophosphate (0.2 mM), MOPS (20 mM) and methanol (5%) to aid in the solubilization of organophosphates because of low aqueous solubility. The reaction was stirred continuously and sample aliquots were collected at time intervals and then centrifuged at 13![[thin space (1/6-em)]](https://www.rsc.org/images/entities/char_2009.gif) 400 rpm for 20 minutes. The reaction progress for MeP hydrolysis was measured on the supernatant using UV-Vis spectroscopy, and the production of p-nitrophenolate (PNP) was monitored at 400 nm. PNP with the pKa of 7.15 is present in the both protonated and deprotonated forms at pH 8, and it is necessary to buffer all the solutions at pH 10 or higher to determine total of PNP concentration (for pH studies). Absorbance and concentration values for the hydrolysis products from triplicate experiments were averaged, and error bars are reported based on the standard deviation. For control experiments, TiO2 nanoparticles were prepared following the procedure used to synthesize Ag@TiO2 core–shell nanoparticles but in the absence of AgNO3. CTAB stabilized AgNPs were also obtained using the same method used for the synthesis of AgNPs prior to coating with TiO2. The catalytic activity of AgNPs and TiO2 for methyl parathion degradation was tested under the same conditions that were used for MeP hydrolysis in the presence of Ag@TiO2. MeP was added to a colloidal mixture of CTAB stabilized AgNPs or TiO2 nanoparticles and the formation of PNP was monitored at 400 nm using UV-Vis spectroscopy. TiO2 was separated by centrifugation prior to UV-Vis measurements. For diazinon, the formation of pyrimidinol (PY) was monitored at 266 nm. For malathion, the presence of hydrolysis product was confirmed using 31P NMR. Linear fit was made using the first seven points of the plot, and the slope was defined as the initial hydrolysis rate. For qualitative analysis of diazinon hydrolysis products using LC-MS, the aqueous phase was extracted using CH2Cl2 after removal of Ag@TiO2. The solvent was then removed from the organic phase using rotary evaporation, and the residue taken up in MeOH for analysis.
400 rpm for 20 minutes. The reaction progress for MeP hydrolysis was measured on the supernatant using UV-Vis spectroscopy, and the production of p-nitrophenolate (PNP) was monitored at 400 nm. PNP with the pKa of 7.15 is present in the both protonated and deprotonated forms at pH 8, and it is necessary to buffer all the solutions at pH 10 or higher to determine total of PNP concentration (for pH studies). Absorbance and concentration values for the hydrolysis products from triplicate experiments were averaged, and error bars are reported based on the standard deviation. For control experiments, TiO2 nanoparticles were prepared following the procedure used to synthesize Ag@TiO2 core–shell nanoparticles but in the absence of AgNO3. CTAB stabilized AgNPs were also obtained using the same method used for the synthesis of AgNPs prior to coating with TiO2. The catalytic activity of AgNPs and TiO2 for methyl parathion degradation was tested under the same conditions that were used for MeP hydrolysis in the presence of Ag@TiO2. MeP was added to a colloidal mixture of CTAB stabilized AgNPs or TiO2 nanoparticles and the formation of PNP was monitored at 400 nm using UV-Vis spectroscopy. TiO2 was separated by centrifugation prior to UV-Vis measurements. For diazinon, the formation of pyrimidinol (PY) was monitored at 266 nm. For malathion, the presence of hydrolysis product was confirmed using 31P NMR. Linear fit was made using the first seven points of the plot, and the slope was defined as the initial hydrolysis rate. For qualitative analysis of diazinon hydrolysis products using LC-MS, the aqueous phase was extracted using CH2Cl2 after removal of Ag@TiO2. The solvent was then removed from the organic phase using rotary evaporation, and the residue taken up in MeOH for analysis.
3. Results and discussion
3.1. Characterization of core–shell Ag@TiO2
The characterization of Ag@TiO2 has already been reported by several authors.8,21,23,24 However, in our hands, TEM images of the isolated Ag@TiO2 show AgNPs with an average size of 20 nm embedded in a TiO2 matrix (Fig. 1) as distinct from discreet spherical core–shell nanoparticles. The surface plasmon band (SPR) for Ag@TiO2 is centered at 430 nm representing a red-shift from 407 nm for Ag nanoparticles in the absence of an oxide shell. This behavior is due to the presence of the higher refractive index TiO2 shell (Fig. S1†).8,25Zeta potential measurements over the range of pH 3 to 8 show isoelectric values of 3.2 and 5.3 for Ag@TiO2 and TiO2 respectively which is consistent with previous reports (Fig. S2†).23
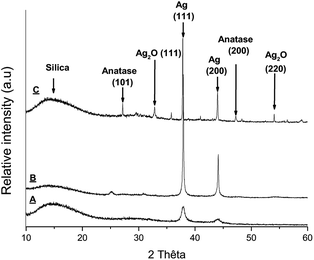
X-ray diffractograms were recorded for Ag@TiO2 NPs after heating the material at 200 °C, 650 °C and 1000 °C and are shown in Fig. 1.
The diffraction pattern for Ag@TiO2 heated at 200 °C revealed large peaks around 2θ = 38, 44° corresponding to silver reflections (111) and (200).26–28 No peak corresponding to TiO2 was detected confirming that the titanium dioxide shell is amorphous. The amorphous nature of the oxide shell in the starting material is consistent with the TEM image shown in Fig. S1.†
After heating at 600 °C, the diffraction peaks are clearly narrower and show a more crystalline nature, and the peak around 2θ = 25° can be tentatively assigned to anatase.26 The two diffraction peaks for silver are still present. Finally, heating the sample over 1000 °C leads to a more complicated X-ray diffraction pattern with a stronger peak for anatase. Peaks around 2θ = 33, 54° correspond to silver oxide reflections (111) and (220), suggesting a partial degradation of silver to silver oxide. The metal may have been displaced from the TiO2 shell explaining the black powder obtained upon heating.
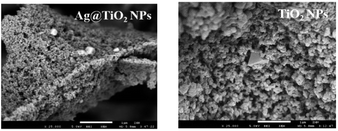
Fig. 2 shows typical scanning electron microscopic (SEM) images of the prepared samples, which indicate that in all cases the freeze-drying method led to the formation of large agglomerates with highly irregular surfaces. The TiO2 sample contains some large crystalline domains intertwined in the agglomerates and these are approximately 5 times larger than seen in Ag@TiO2.
BET analysis was performed on TiO2 and Ag@TiO2 NPs. The BET surface areas, average pore radius distributions (determined according to the Barrett, Joyner, and Halenda (BJH) method) and BJH desorption average pore diameters are given in Table 1.
| Sample | BET surface area [m2 g−1] | t-plot micropore area [m2 g−1] | BJH desorption cumulative surface area of pores [m2 g−1] | BJH desorption average pore diameter [nm] |
|---|---|---|---|---|
| TiO2 | 333 ± 4 m2 g−1 | 107.8 | 178 | 4.57 |
| Ag@TiO2 | 47.8 ± 0.2 m2 g−1 | 0 | 46 | 13.2 |
Ag@TiO2 NPs show the presence of mesopores while TiO2 possesses 32% micropores and 53% mesopores. Both materials have different surface areas, average pore diameters and pore volumes. This demonstrates the microstructure of the catalysts might affect their respective catalytic performances as the combination of silver and TiO2 is crucial for catalytic activity. This is consistent with the previously reported observation that a pore radius >35.2 Å is a requirement for minimizing pore diffusion limitations in the degradation of methyl paraoxon using Mg2+–Al3+ mixed oxides.29
3.2. Degradation of methyl parathion
Methyl parathion hydrolysis using Ag@TiO2 was monitored using the absorbance of the primary product p-nitrophenolate (PNP) anion at 400 nm. Fig. 3 shows UV-Vis absorption spectra for the MeP hydrolysis reaction in the presence of Ag@TiO2 at pH 8. The absorbance at 277 nm is characteristic of MeP and decreases over time. There is also an immediate increase in the absorbance at 400 nm, indicating the formation of PNP, thus confirming that hydrolysis of MeP is occurring. At room temperature and under dark conditions, control reactions performed in the absence of Ag@TiO2 showed no formation of PNP by 31P NMR (Fig. S3, ESI†). A single peak at 62.5 ppm assigned to methyl parathion was observed.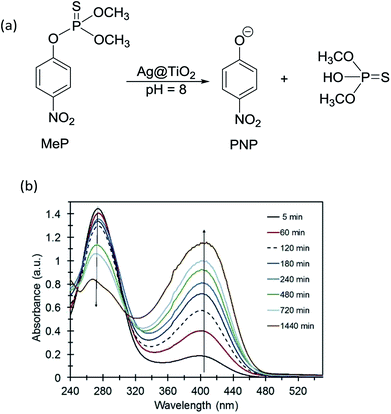 | ||
| Fig. 3 (a) Hydrolysis of methyl parathion using core–shell Ag@TiO2. (b) UV-Vis spectra for methyl parathion + Ag@TiO2 vs. time. | ||
A control reaction using a mixture of TiO2 nanoparticles and CTAB stabilized AgNPs did not exhibit PNP production (Fig. 4). Immediate formation of PNP in the presence of Ag@TiO2 and at pH 8 suggests that hybrid combination of embedded AgNPs within a TiO2 shell is essential for catalytic activity.
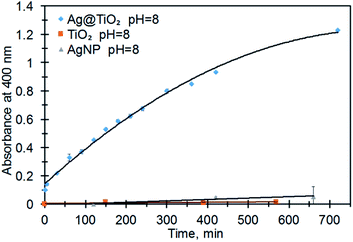 | ||
| Fig. 4 The formation of p-nitrophenolate (PNP, 400 nm) from MeP ([MeP] = 0.2 M) at pH = 8, 21 °C, and in the presence of AgNPs, TiO2NPs and Ag@TiO2 NPs. | ||
Qualitative analysis of the hydrolysis product, using 31P NMR spectroscopy indicated the presence of unreacted MeP with a chemical shift at 62.5 ppm and the appearance of a new peak at 58.2 ppm due to the hydrolysis product, named O,O-dimethyl hydrogen phosphorothioate (Fig. S4†).9,31,32 Isomerism and oxidation products were not observed indicating that hydrolysis is the only degradation pathway and alternative degradation pathways are not involved (Fig. S3, ESI†).
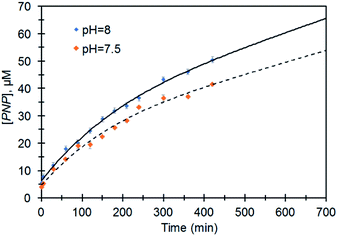
Fig. 5 represents the performance of Ag@TiO2 for the degradation of MeP to PNP at different pH values which show an increase in the initial rate of hydrolysis with increasing pH. Considering the fact that hydrolysis is limited to the O,O-dimethyl hydrogen phosphorothioate product, the initial rate values for the hydrolysis at pH 7.5 and 8 were 1 × 10⁻⁷ M min−1 and 2 × 10⁻⁷ M min−1 respectively.
The enhancement in the initial rate of the reaction along with an increase in the pH suggests that the hydroxide ion is responsible for hydrolytic activity. This data confirms the difference between activity and properties of TiO2 before and after doping with AgNP. The difference in the catalytic activity can be attributed to the higher surface acidity of Ag@TiO2 which is supported by the lower isoelectric point (Fig. S2†).
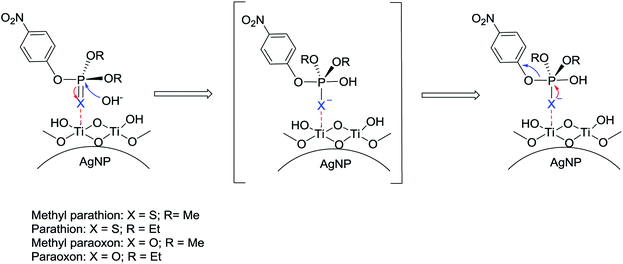
Higher surface acidity indicates an increase in Lewis acid sites on the surface of core–shell nanoparticles, promoting the interaction of methyl parathion P![[double bond, length as m-dash]](https://www.rsc.org/images/entities/char_e001.gif) S with the TiO2 shell, which does not take place in the presence of TiO2 particles alone.33 This reversible coordination could facilitate shifting of charge density toward the sulfur atom and promoting nucleophilic substitution of the hydroxyl ion. Previous authors have proposed a similar mechanism to explain the hydrolysis mechanism of a variety of organophosphates and organic transformations in the presence of TiO2 based materials or other metal oxides.7,29,34,35
S with the TiO2 shell, which does not take place in the presence of TiO2 particles alone.33 This reversible coordination could facilitate shifting of charge density toward the sulfur atom and promoting nucleophilic substitution of the hydroxyl ion. Previous authors have proposed a similar mechanism to explain the hydrolysis mechanism of a variety of organophosphates and organic transformations in the presence of TiO2 based materials or other metal oxides.7,29,34,35
Our proposed mechanism is shown in Fig. 6. We additionally observed that the catalytic activity of Ag@TiO2 varies for phosphate triesters, based on the presence of different heteroatom and non-leaving groups.
Under the same conditions (pH = 8, MOPS, 21 °C) the production of PNP occurs much faster for the catalytic hydrolysis of MeP compared to that of methyl paraoxon (X = O; R = Me) (Fig. 7). We tentatively suggest that the presence of an electron-rich sulfur atom in MeP assists in stabilizing the negative charge in a five-centered intermediate (Fig. 6). The sulfur atom in MeP provides higher stability in the intermediate compared to methyl paraoxon.
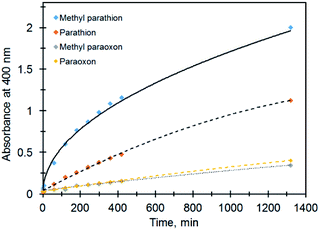 | ||
| Fig. 7 Profiles of absorbance (PNP, 400 nm) vs. time for different organophosphates in the presence of Ag@TiO2. | ||
The same results were obtained for the non-catalytic degradation of the above compounds under the same conditions so that while MeP reached its half-life at pH 9 and 50 °C in 49 hours, for parathion it took ca. two weeks. For methyl paraoxon and paraoxon, the half-lives are >2 months under the same conditions.
To confirm the catalytic role of Ag@TiO2 nanocomposites in the above set of experiments, nanocomposites were separated from the reaction mixture after 120 min. As shown in Fig. 8, no further PNP production was observed after removing the catalyst indicating Ag@TiO2 heterogeneously catalyzes MeP hydrolysis.
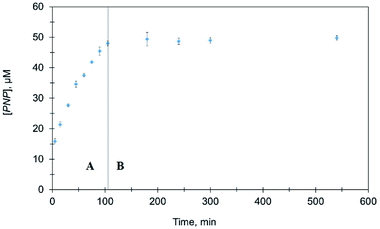 | ||
| Fig. 8 Comparison of PNP formation in the presence and absence of Ag@TiO2. (A) Before removal of Ag@TiO2 (B) after removal of Ag@TiO2. | ||
The role of Ag+ ions in hydrolysis of organophosphates has previously been described, suggesting the possibility that free Ag+ ion may be responsible for catalytic hydrolysis of methyl parathion in our experiments.36 Under catalytic conditions, we measured free silver ion in solution by atomic absorption spectroscopy which gave a value of 2.38 ppm after 6 hours. This value is too low to show any catalytic activity for MeP hydrolysis.36 Interestingly, the dark antibacterial activity of Ag@TiO2 has been described, and explained as due to the slow dissolution of AgNPs and formation of toxic Ag+ ions in solution.30
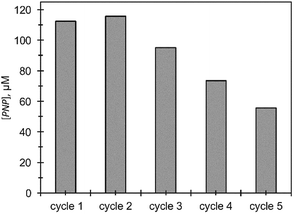
The efficiency of Ag@TiO2 recycle for MeP hydrolysis was tested over a period of 24 hours (Fig. 9). At the end of each time period, nanocomposites were separated from the dispersion and washed with 5% aqueous methanol to remove any excess of MeP. All reactions were conducted under identical conditions. Formation of PNP was observed for up to five cycles, although the conversion shows a considerable degradation in performance compared to the initial cycle. The significant decrease in catalytic performance could result from nanoparticle aggregation which was clearly observed using TEM at the end of the fourth cycle.
The catalytic action of Ag@TiO2 was also demonstrated for pesticides diazinon and malathion. In the case of diazinon, spectra of the catalytic mixture showed a constant increase in an absorbance at 266 nm due to an increase in the concentration of pyrimidinol (PY) (Fig. S6†). The presence of the hydrolysis product of diazinon, PY was also verified using LC-MS (Fig. S7†). Under the same conditions and in the presence of Ag@TiO2, malathion underwent hydrolysis, and analysis of the catalytic mixture using 31P NMR revealed two peaks with chemical shifts of 96.4 ppm for unreacted malathion and 58.2 ppm for O,O-dimethyl hydrogen phosphorothioate (Fig. S8†).
4. Conclusions
In this work, the use of Ag@TiO2 nanocomposites for non-photochemical hydrolysis of organophosphate pesticides is reported for the first time. The initial rate of hydrolysis can be correlated with the pH of the reaction mixture, and PNP is the sole degradation product. We propose that improved catalytic activity of Ag@TiO2 is related to the higher surface acidity of the nanocomposite which is mediated by the presence of silver nanoparticles. Thus the unique combination of silver nanoparticles and titania is a requirement for high catalytic activity. The mechanism of hydrolysis can be explained in three steps (i) coordination of the electron-rich P![[double bond, length as m-dash]](https://www.rsc.org/images/entities/char_e001.gif) S to Lewis acid sites on the surface of Ag@TiO2 (ii) nucleophilic attack of hydroxide ion towards the phosphorus atom and (iii) subsequent loss of the leaving group and formation of hydrolysis product. The catalytic activity of Ag@TiO2 was demonstrated for both organophosphates and organothiophosphates including paraoxon, malathion, and diazinon, and hydrolysis products were identified using 31P NMR and LC-MS. We are currently investigating the synthesis and application of less expensive core–shell nanoparticles such as Cu@TiO2 for decomposition of nerve agent simulants.
S to Lewis acid sites on the surface of Ag@TiO2 (ii) nucleophilic attack of hydroxide ion towards the phosphorus atom and (iii) subsequent loss of the leaving group and formation of hydrolysis product. The catalytic activity of Ag@TiO2 was demonstrated for both organophosphates and organothiophosphates including paraoxon, malathion, and diazinon, and hydrolysis products were identified using 31P NMR and LC-MS. We are currently investigating the synthesis and application of less expensive core–shell nanoparticles such as Cu@TiO2 for decomposition of nerve agent simulants.
Conflicts of interest
There are no conflicts to declare.Acknowledgements
The authors acknowledge financial support from the “Centre National de la Recherche Scientifique” (CNRS) through the PICS COSMOCAT and from the Defense Threat Reduction Agency-Joint Science and Technology Office for Chemical and Biological Defense (MIPR #HDTRA1516012). F. X. Lefèvre is gratefully acknowledged for his help for the SEM observation.Notes and references
- J. Henych, P. Janoš, M. Kormunda, J. Tolasz and V. Štengl, Arabian J. Chem. DOI:10.1016/j.arabjc.2016.06.002.
- S.-J. Lee, C.-H. Huang, S. Shian and K. H. Sandhage, J. Am. Ceram. Soc., 2007, 90, 1632–1636 CrossRef CAS.
- J. Henych, V. Stengl, M. Slusna, T. M. Grygar, P. Janos, P. Kuran and M. Stastny, Appl. Surf. Sci., 2015, 344, 9–16 CrossRef CAS.
- V. Stengl, T. Matys Grygar, F. Oplustil and T. Nemec, J. Hazard. Mater., 2012, 227, 62–67 CrossRef.
- M. Tahir, B. Tahir, N. A. S. Amin and Z. Y. Zakaria, J. CO2 Util., 2017, 18, 250–260 CrossRef CAS.
- R. Sellappan, M. G. Nielsen, F. Gonzalez-Posada, P. C. K. Vesborg, I. Chorkendorff and D. Chakarov, J. Catal., 2013, 307, 214–221 CrossRef CAS.
- B. Maleki, M. Baghayeri, S. M. Vahdat, A. Mohammadzadeh and S. Akhoondi, RSC Adv., 2015, 5, 46545–46551 RSC.
- F. Forato, S. Talebzadeh, B. Bujoli, C. Queffelec, S. A. Trammell and D. A. Knight, ChemistrySelect, 2017, 2, 769–773 CrossRef.
- R. Nita, S. A. Trammell, G. A. Ellis, M. H. Moore, C. M. Soto, D. H. Leary, J. Fontana, S. F. Talebzadeh and D. A. Knight, Chemosphere, 2016, 144, 1916–1919 CrossRef CAS.
- V. K. Khanna, Def. Sci. J., 2008, 58, 608–616 CrossRef CAS.
- X. Liao, C. Zhang, Y. Liu, Y. Luo, S. Wu, S. Yuan and Z. Zhu, Chemosphere, 2016, 150, 90–96 CrossRef CAS PubMed.
- Y. Han and S. K. Obendorf, Text. Res. J., 2016, 86, 339–349 CrossRef CAS.
- P. Janos, P. Kuran, M. Kormunda, V. Stengl, T. M. Grygar, M. Dosek, M. Stastny, J. Ederer, V. Pilarova and L. Vrtoch, J. Rare Earths, 2014, 32, 360–370 CrossRef CAS.
- G. K. Prasad, T. H. Mahato, B. Singh, K. Ganesan, A. R. Srivastava, M. P. Kaushik and R. Vijayraghavan, AIChE J., 2008, 54, 2957–2963 CrossRef CAS.
- J. Wang, Z. Pan, Z. Zhang, X. Zhang, F. Wen, T. Ma, Y. Jiang, L. Wang, L. Xu and P. Kang, Ultrason. Sonochem., 2006, 13, 493–500 CrossRef CAS PubMed.
- R.-J. Wu, C.-C. Chen, M.-H. Chen and C.-S. Lu, J. Hazard. Mater., 2009, 162, 945–953 CrossRef CAS PubMed.
- D. Sud and P. Kaur, Crit. Rev. Environ. Sci. Technol., 2012, 42, 2365–2407 CrossRef CAS.
- K. Kim, O. G. Tsay, D. A. Atwood and D. G. Churchill, Chem. Rev., 2011, 111, 5345–5403 CrossRef CAS.
- P. V. R. K. Ramacharyulu, J. P. Kumar, G. K. Prasad and A. R. Srivastava, RSC Adv., 2015, 5, 1309–1314 RSC.
- J. M. Berg, A. Romoser, N. Banerjee, R. Zebda and C. M. Sayes, Nanotoxicology, 2009, 3, 276–283 CrossRef CAS.
- H. Sakai, T. Kanda, H. Shibata, T. Ohkubo and M. Abe, J. Am. Chem. Soc., 2006, 128, 4944–4945 CrossRef CAS PubMed.
- K. Kalishwaralal, S. BarathManiKanth, S. R. K. Pandian, V. Deepak and S. Gurunathan, Colloids Surf., B, 2010, 79, 340–344 CrossRef CAS PubMed.
- H.-Y. Chuang and D.-H. Chen, Nanotechnology, 2009, 20, 105704 CrossRef PubMed.
- S. Angkaew and P. Limsuwan, in ISEEC, ed. J. Kaewkhao, P. Limsuwan, P. P. Yupapin, S. J. J. JanJai and P. Yupapin, Elsevier Science Bv, Amsterdam, 2012, vol. 32, pp. 649–655.
- R. T. Tom, A. S. Nair, N. Singh, M. Aslam, C. L. Nagendra, R. Philip, K. Vijayamohanan and T. Pradeep, Langmuir, 2003, 19, 3439–3445 CrossRef CAS.
- C. Su, L. Liu, M. Zhang, Y. Zhang and C. Shao, CrystEngComm, 2012, 14, 3989–3999 RSC.
- K. Gupta, R. P. Singh, A. Pandey and A. Pandey, Beilstein J. Nanotechnol., 2013, 4, 345–351 CrossRef.
- M. Kumar, K. K. Parashar, S. K. Tandi, T. Kumar, D. C. Agarwal and A. Pathak, J. Spectrosc., 2013, 2013, e491716 Search PubMed.
- L. M. Zimmermann, G. I. Almerindo, J. R. Mora, I. H. Bechtold, H. D. Fiedler and F. Nome, J. Phys. Chem. C, 2013, 117, 26097–26105 CrossRef CAS.
- M. Li, M. Eugenia Noriega-Trevino, N. Nino-Martinez, C. Marambio-Jones, J. Wang, R. Damoiseaux, F. Ruiz and E. M. V. Hoek, Environ. Sci. Technol., 2011, 45, 8989–8995 CrossRef CAS.
- L. E. Lange and S. K. Obendorf, J. Environ. Chem. Eng., 2015, 3, 541–547 CrossRef CAS.
- M. R. Seger and G. E. Maciel, Environ. Sci. Technol., 2006, 40, 552–558 CrossRef CAS.
- N. Tarrat, J. Mol. Struct.: THEOCHEM, 2010, 941, 56–60 CrossRef CAS.
- G. I. Almerindo, P. Bueno, L. M. Nicolazi, E. H. Wanderlind, P. Sangaletti, S. M. Landi, L. A. Sena, B. S. Archanjo, C. A. Achete, H. D. Fiedler and F. Nome, J. Phys. Chem. C, 2016, 120, 22323–22329 CrossRef CAS.
- M. Fatahpour, F. N. Sadeh, N. Hazeri, M. T. Maghsoodlou, M. S. Hadavi and S. Mahnaei, J. Saudi Chem. Soc., 2017, 21, 998–1006 CrossRef CAS.
- L. Y. Kuo, A. K. Bentley, Y. A. Shari’ati and C. P. Smith, Organometallics, 2012, 31, 5294–5301 CrossRef CAS.
Footnote |
| † Electronic supplementary information (ESI) available: 31P NMR spectra of methyl parathion and methyl parathion + Ag@TiO2 after 24 hours, scheme showing non-photochemical breakdown products of methyl parathion, UV-Vis spectrum of diazinon + Ag@TiO2, LC-MS analysis of diazinon + Ag@TiO2 after 24 hours and 31P NMR spectrum of malathion + Ag@TiO2 after 24 hours. of diazinon + Ag@TiO2 after 24 hours, 31P NMR spectrum of malathion + Ag@TiO2 after 24 hours. See DOI: 10.1039/c8ra09553a |
| This journal is © The Royal Society of Chemistry 2018 |

