 Open Access Article
New insights into decomposition characteristics of nanoscale methane hydrate below the ice point
Lihua Wan,
Deqing Liang * and
Jinan Guan
Key Laboratory of Gas Hydrate, Guangzhou Institute of Energy Conversion, Chinese Academy of Sciences, Guangzhou 510640, People's Republic of China. E-mail: liangdq@ms.giec.ac.cn
First published on 12th December 2018
Abstract
In this paper, molecular dynamics simulation was used to study the decomposition process of nanoscale methane hydrate at 1 atm and 227 K. The results predict that methane hydrate decomposes into supercooled water (SCW) and methane gas and the resulting SCW turns into very high density amorphous ice (VHDA). The density of the VHDA is as high as 1.2–1.4 g cm−3. The X-ray diffraction phase analysis showed that VHDA has a broad peak at 2θ of around 30°. The VHDA encapsulates the methane hydrate crystal so that the crystal can survive for a long time. The dissolved gas from the hydrate melt cannot escape out of the VHDA in a short time. The simulation results reveal new molecular insights into the decomposition behaviour of nanoscale methane hydrate below the ice point.
1. Introduction
Natural gas hydrates are crystalline inclusion compounds that are formed by water and natural gas at low temperatures and high pressures. They are an important future energy source for the 21st century.1 The acquisition, storage and transportation of natural gas hydrates are based on natural gas hydrate characteristics and decomposition characteristics in the gas hydrate industry.After methane hydrate decomposes, ice and methane gas can form below the ice point. The ice formed encapsulates the methane hydrate crystal so that the crystal can survive for a long time. This is called the self-preservation effect. The effect and its mechanism have been studied by many researchers.2–6 Based on this effect, a method for the storage and transportation of natural gases whereby methane hydrate is frozen at low temperatures was proposed.7,8 In fact, water can exist in SCW and the glassy phase9,10 but not as ice below the ice point. There is also experimental evidence of intermediate supercooled water formation during methane hydrate dissociation below the ice point.11,12 Ice was followed by the formation of the supercooled liquid phase observed visually during the hydrate dissociation.13–16
Natural sediments bearing gas hydrates, including coarse-grained and fine-grained sediments such as sands, silts and clays have widely differing pore sizes and particle sizes. When water is confined to nanometre-sized pores, such as the interior of a carbon nanotube (CNT), unusual phase behaviour exhibits substantial sensitivity to the diameter due to confinement effects.17 At low temperatures, the simultaneous presence of cubic and amorphous ice in confined water was observed.18 Theoretical evidence of a hitherto unreported state, namely bilayer very low density amorphous ice (BL-VLDA), as well as evidence of a strong first-order transition between BL-VLDA and the BL amorphous ice (BL-A), and a weak first-order transition between BL-VLDA and the BL very low density liquid (BL-VLDL) water was reported.19 Many of the effects attributed to novel phases under confinement are determined by subtle electronic structure rearrangements occurring at the interface with the confining medium.20
Thin films composed of 400–500 monolayers (ML) of either amorphous solid water (ASW) or ASW/CO2 mixtures were found.21 They were grown atop a MgO(100) substrate under ultrahigh vacuum conditions. Some of the guest molecules can be trapped within porous ASW films. The trapping and release of CO2 by ASW films has been studied.22,23 Results showed that the amount of guest molecules trapped in the ASW film depends on the deposition method. The majority of the trapped guest molecules escape during the ASW-to-cubic ice phase transition at 165 K.23
In fact, a glassy phase is presumably formed from SCW during the subsequent dissociation of nanoscale gas hydrate.
In this paper, molecular dynamics (MD) was used to simulate the decomposition of nanoscale methane hydrate at a low temperature and ambient pressure. The results showed that the decomposing hydrate undergoes the evolution of the hydrate–SCW–VHDA. The evolution of dissolved gas from the hydrate decomposition is an important step in the extraction process, and it is affected by the physical nature of the decomposing hydrate.24–28 VHDA is not as the same as ice. It has no fixed shape and no crystal structure. Compared with the solid, it is more a state of extreme viscosity: a solid–liquid. The thermal conductivity of ASW is less than that of the hexagonal and cubic ices.29 Based on the slower heat transfer effect of the ASW, the methane hydrate crystal encapsulated by the ASW can survive for a longer time than that encapsulated by the ice. The results revealed new molecular insights into the decomposition process of methane hydrate. Based on this effect, new methods for the acquisition, storage and transportation of natural gas hydrate will be created.
2. Methods
In this paper, MD was used to simulate the decomposition process of methane hydrate at 1 atm and 227 K. The simulation system was a 4 × 4 × 4 SI hydrate unit cell with a size of 45.87 nm × 45.87 nm × 45.87 nm (x × y × z) containing 2944 water molecules and 512 methane molecules with a total of 11![[thin space (1/6-em)]](https://www.rsc.org/images/entities/char_2009.gif) 392 atoms. The initial position of each molecule was determined according to diffraction experiments.30,31 The initial configuration of methane hydrate is shown in Fig. 1(a). In the simulation, first the energy was minimized, then the canonical ensemble (NVT) process was simulated at 227 K and then the hydrate dissociation process in the isothermal–isobaric ensemble (NPT) at 1 atm and 227 K was simulated. In order to investigate the randomness of the decomposition of methane hydrate under different initial energies, the decomposition of methane hydrate was carried out for 2 runs in total. Run 1 in the NVT system was simulated for only 12.5 ps and Run 2 was simulated in the NVT system for 500 ps to ensure the system achieved energy balance. Both MD trajectories were performed within the NPT ensemble at a pressure of 1 atm.
392 atoms. The initial position of each molecule was determined according to diffraction experiments.30,31 The initial configuration of methane hydrate is shown in Fig. 1(a). In the simulation, first the energy was minimized, then the canonical ensemble (NVT) process was simulated at 227 K and then the hydrate dissociation process in the isothermal–isobaric ensemble (NPT) at 1 atm and 227 K was simulated. In order to investigate the randomness of the decomposition of methane hydrate under different initial energies, the decomposition of methane hydrate was carried out for 2 runs in total. Run 1 in the NVT system was simulated for only 12.5 ps and Run 2 was simulated in the NVT system for 500 ps to ensure the system achieved energy balance. Both MD trajectories were performed within the NPT ensemble at a pressure of 1 atm.
Forcite Module 6.0 from Material Studio Software was used for MD simulation with the use of a compatible valence force field (CVFF).32 Transformable intermolecular potential function for three points (TIP3P33) was used for water molecules. Water molecules of the ASW structure were described by the TIP3P force field.34–36 The O–H bond length of water molecules was set at 0.096 nm and the H–O–H bond angle was set at 104.52°. The non-bond effect of van der Waals between molecules was calculated using a Lennard-Jones potential energy function. The long-range electrostatic interaction was evaluated by the Ewald method.28 The steepest descent method and the conjugate gradient method were used to optimize the structures. The velocity Verlet37 algorithm was used to solve the Newtonian equations of motion based on the assumption that the periodic boundary conditions and the time average were equivalent to ensemble averages. The cut-off radius was set to 1.200 nm. Outside the truncated distance, the intermolecular interaction can be corrected by the average density approximation method. The temperature was controlled at 227.0 K by the Nose–Hoover method,38 and the step time was 0.5 fs. The microscopic process of low-temperature decomposition of methane hydrate was recognized at the molecular level.
3. Results and discussion
3.1 Potential energy and density
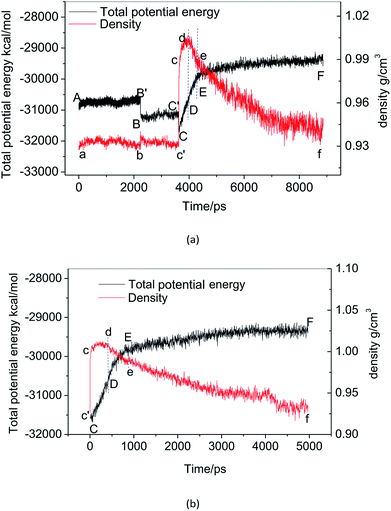
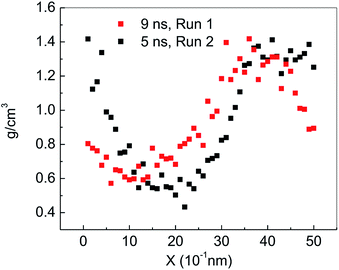
Fig. 2(a) shows the change of the total potential energy (as shown in A–B′–B–C′–C–D–E–F) and the system density (as shown in a–b–c′–c–d–e–f) of methane hydrate at 1 atm and 227 K in Run 1. The potential energy in phase A–B and the system density in the phase of a–b maintain a certain position in the vibration within 2.25 ns after simulation in the NPT system. It demonstrates that the methane hydrate itself remains in a stable crystal state under the simulated conditions given in this paper. Due to the higher initial energy of the NPT process, there is an energy step down at 2.25 ns (B′–B) and 3.61 ns (C′–C) of the NPT simulation. At this stage (a–b–c′), system density remained essentially unchanged, indicating that it is in the form of solid hydrate as shown in Fig. 1(b). The system showed potential energy increases after the simulating time from 3.61 ns to 4.83 ns, indicating that methane hydrate has decomposed. When the decomposition begins, the density of the system rises sharply to 1.0 g cm−3 (point c). The structure of the hydrate collapses rapidly. The SCW (judged by the radial distribution function (RDF) (g(rO–O)), see Section 3.2) is formed rapidly by the decomposition. Then, the overall density of the system gradually decreases in the subsequent 5 ns of simulation time. It indicates that methane gas is generated in the decomposition, which results in volume expansion. VHDA is followed by SCW. The VHDA is determined by the RDF (g(rO–O)) (see Section 3.2). The configuration of VHDA is shown in Fig. 1(c). Fig. 3 shows the X-axis density of the system at 9 ns in Run 1. It was shown that the system has a large bubble at X = 10 × 10−1 nm at this time, and the density of the surrounding VHDA is as high as 1.2–1.4 g cm−3. So, the hydrate decomposition undergoes the evolution of the hydrate–SCW–VHDA.Fig. 2(b) shows the change of the potential energy function (B–C–D) and the system density (b–c–d) of the decomposition system of Run 2. In Run 2, the decomposition of the methane hydrate occurs at the beginning of the NPT simulation. The subsequent process is identical to Run 1; that is, the hydrate decomposition process undergoes a hydrate–SCW–VHDA process. Fig. 3 also shows the X-axis density at 5 ns in Run 2. At the X-axis X = 20 × 10−1 nm, a bubble forms at this time. Surrounding the bubble, the density of the VHDA is as high as 1.2–1.4 g cm−3. Intentionally, it is inferred that the decomposition start time of methane hydrate has certain randomness. It makes the VHDA formed from the decomposition wrap the methane hydrate crystal which is too late to decompose. It hinders the heat transfer of the decomposition. So, the wrapped methane hydrate crystal can survive for a long time.
3.2 Radial distribution function (RDF)
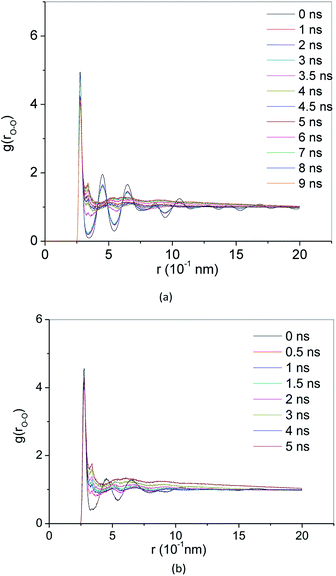
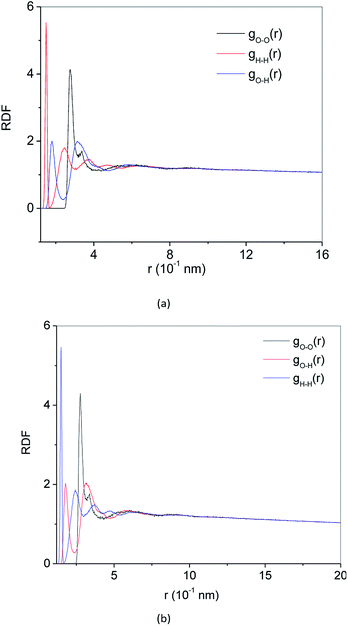
RDF g(r) is a method to describe the order of condensed system architectures, which shows the probability of the presence of the same kind of atoms from a central atom. RDF reflects the microstructure characteristics of the systems. Crystalline, amorphous and liquid forms have their RDF characteristic. Fig. 4(a) and 5(a) show the RDF of methane hydrate during decomposition in Run 1. During 3 ns after the start of NPT simulations in Run 1, RDF (g(rO–O)) curves form the same shapes. Only the height of the crest is reduced, and the height of the trough is raised. This demonstrates that during the simulation time, the methane hydrate remains in the hydrate state and only undergoes methane hydrate crystal deformation. At 3.61 ns after the start of NPT simulations, the RDF (g(rO–O)) is the same as the RDF (g(rO–O)) of SCW (see ref. 39 and 40). It means that the methane hydrate decomposes to form SCW at this time. At 4 ns and r = 0.337 nm, a peak occurs, and the entire RDF curve shape is the same as the RDF (g(rO–O)) of the VHDA reported in ref. 41. It indicates that the VHDA has formed at this time. After that, the peak at r = 0.337 nm and the trough at r = 0.565 nm of the curve rise, indicating that more and more VHDA is generated. Fig. 5(a) shows the RDF (g(r)) of O–O (O–H, H–H) atom pairs from water molecules after 9 ns of NPT simulation time in Run 1. Compared with ref. 41, it is confirmed that VHDA is formed. In the case when water is freezing in the conditions of confined geometry, there may be no room for expansion of ice formation, and an amorphous phase may be formed.42 In this paper, because the system is limited to the nanometre scale, the expansion of methane bubbles makes no space to form ice, resulting in VHDA.Fig. 4(b) and 5(b) show the RDF of methane hydrate in Run 2. Fig. 4(b) shows that the RDF (g(rO–O)) is the same as the RDF (g(rO–O)) of the SCW from ref. 39 and 40 at 0.5 ns. It indicates that the system has formed SCW. Then, similar to Run 1, the peak at r = 0.337 nm and trough at r = 0.565 nm of the curve rise, and VHDA is gradually formed. Fig. 5(b) shows RDF of O–O (O–H, H–H) atom pairs for Run 2 at 5 ns. Compared with ref. 41, a VHDA is formed.
3.3 X-ray diffraction phase analysis
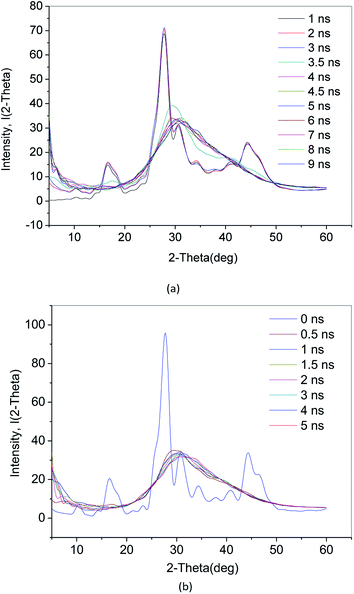
The crystalline material X-ray pattern is characterized by a number of very narrow “spikes” independent of each other. However, for liquid and amorphous solids, the X-ray diffraction pattern is characterized by only a gentle change in the intensity of the scattered X-ray pattern observed over the entire scanning angle 2θ range (from 1° to 2° to several tens of degrees). Therefore, the crystal has a fixed diffraction peak. Because an amorphous substance does not have a crystal structure, there is no significant diffraction peak and there are only bread peaks. When there is a short-range ordered structure inside the amorphous substance, diffuse diffraction peaks appear. The X-ray diffraction image of the crystal is essentially a physical transformation of a stereoscopic structure of the microstructure.In this paper, the incident wavelength is 0.154178 nm and the scanning angle 2θ is 5–60°. Fig. 6(a) shows the X-ray diffraction (XRD) of the methane hydrate decomposition process in Run 1. The characteristics of the X-ray pattern during 1–3 ns are several narrow “spike” diffraction peaks. Compared with ref. 30 and 31, this indicates diffraction peaks inherent to methane hydrate. After 3.5 ns, the diffraction peaks of the hydrate crystals disappear, and only the bread peak appears at 30°. There is no short-range ordered structure. It shows that the system is basically in the amorphous state at this time.
Fig. 6(b) shows the XRD diagram of the methane hydrate decomposition process in Run 2. After the hydrate decomposition, there is no diffuse diffraction peak of crystals. Only the bread peak appears at 2θ of around 30°. Combined with RDF (g(rO–O)) (see Section 3.2) data analysis, it can be concluded that VHDA has no crystal structure and no fixed shape, compared with ice. There is no short-range ordered structure in VHDA.
3.4 Mean square displacement (MSD)
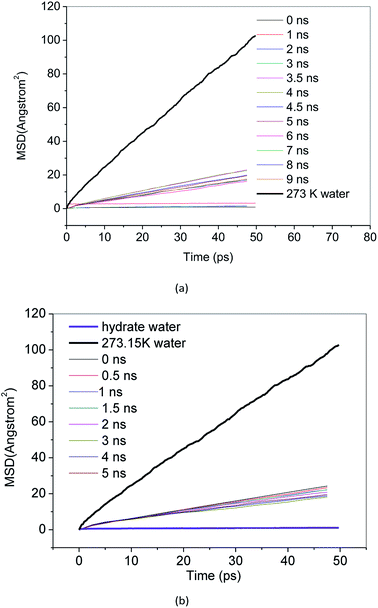
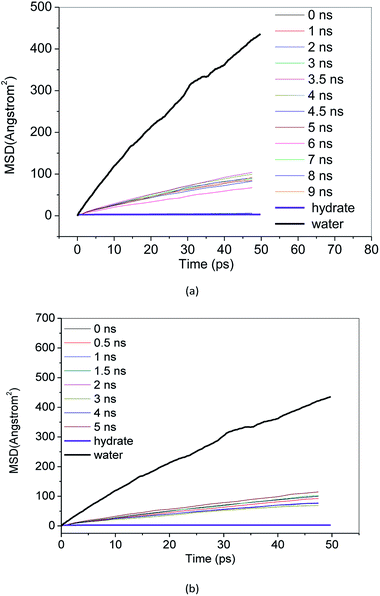
MSD reflects the degree of deviation of the spatial position of molecules in the simulation system from its initial position. For stable methane hydrate crystals, water molecules are in a relatively fixed lattice position where they vibrate and rotate in the lattice position. The MSD of methane hydrate fluctuates near a slightly greater than 0 value. For liquid water molecules, the position is not restricted, and the MSD increases with the simulation time. The diffusion coefficient can be calculated from the Einstein formula.43 From the slope of the MSD curve, we can judge the relative diffusion coefficient value of molecules in different periods.Fig. 7 and 8 show the MSD of water molecules and methane molecules, respectively, during the decomposition of methane hydrate. This paper also simulated the decomposition of methane hydrate at 1 atm and 273 K until gas–liquid phase separation. The MSD of water molecules and methane molecules after phase separation is shown in Fig. 7 and 8. As shown in Fig. 7, it can be determined that water molecules from methane hydrate are in the crystalline state before decomposition. At the beginning of the decomposition, and after the decomposition, water molecules have a certain mobility. This mobility is much weaker than ordinary liquid water molecules with free diffusion, but much faster than solid water molecules without free diffusion. Similarly, it can be judged that the methane molecules from methane hydrate are in the crystalline state before decomposition. As shown in Fig. 8, at the beginning of the decomposition and after the decomposition, methane molecules have a certain degree of diffusion. This diffusion is not as good as methane molecules after gas–liquid phase separation, which has faster diffusivity, but faster than methane molecules in hydrate crystal. Compared with the solid, the VHDA generated from the decomposition does not have a fixed shape. It has a state of extreme viscosity: a solid–liquid.
4. Conclusion
In this paper, MD was used to simulate the decomposition process of nanoscale methane hydrate at 1 atm and 227 K. The results predict that the methane hydrate decomposes into SCW and methane gas, and the resulting SCW forms into VHDA. The VHDA is present for a long time. In this paper, the system is limited to the nanoscale. This effect is presumably caused by the expansion of methane bubbles. There may be no room for further expansion of ice formation and a VHDA may result.The density of the VHDA is as high as 1.2–1.4 g cm−3. The XRD phase analysis showed that VHDA has a bread peak at 2θ of around 30°. There is no crystal structure and no short-range ordered structure in VHDA. This shows that the system is basically in an amorphous state.
MSD analysis shows that the VHDA from decomposition has more a state of extreme viscosity: a solid–liquid, meaning that methane molecules cannot be spilled within a short time. The simulation also shows that this decomposition of methane hydrate is random, which makes the VHDA encapsulate methane hydrate crystal, hindering the heat transfer of the decomposition process so that methane hydrate crystal can survive for a long time.
The simulation results reveal new molecular insights into the decomposition behaviour of nanoscale methane hydrate below the ice point. It will help to create new methods for the acquisition, storage and transportation of natural gas hydrate.
The decomposition process of nanoscale methane hydrate grains was investigated by MD simulation. The formation of a VHDA-methane phase was predicts. However, studies have not been carried out on experiments of the decomposition of methane hydrate grains confined in nanoscale pores of porous medium at lower temperatures. The simulation results in this work are of significance for guiding the experimental research.
Conflicts of interest
There are no conflicts to declare.Acknowledgements
The authors gratefully acknowledge the financial support provided by the National Natural Science Foundation of China (51576197, 51106163, 51676197), the National Key Research and Development Plan of China (No. 2016YFC0304002). We acknowledge National Supercomputing Center in the Shenzhen for providing the computational resources and Material Studio (6.0, Forcite Module).References
- Y. F. Makogon, S. A. Holditch and T. Y. J. Makogon, J. Pet. Sci. Eng., 2007, 56, 14–31 CrossRef CAS.
- S. Circone, L. A. Stern and S. H. Kirby, Am. Mineral., 2004, 89, 1192–1201 CrossRef CAS.
- W. F. Kuhs, G. Genov, D. K. Staykova and T. Hansen, Phys. Chem. Chem. Phys., 2004, 6, 4917–4920 RSC.
- W. Shimada, S. Takeya, Y. Kamata, T. Uchida, J. Nagao, T. Ebinuma and H. Narita, J. Phys. Chem. B, 2005, 109, 5802–5807 CrossRef CAS PubMed.
- S. Takeya and J. Ripmeester, ChemPhysChem, 2010, 11, 70–73 CrossRef CAS PubMed.
- S. Takeya, T. Uchida, J. Nagao, R. Ohmura, W. Shimada, Y. Kamata, T. Ebinuma and H. Narita, Chem. Eng. Sci., 2005, 60(5), 1383–1387 CrossRef CAS.
- J. C. Gudmundsson and A. Børrehaug, Second International Symposium on Gas Hydrates, Toulouse, France, 1996, pp. 415–422 Search PubMed.
- J. C. Gudmundsson, M. Parlaktuna and A. A. Khokhar, SPE Prod. Facil., 1994, 69–73 CrossRef CAS.
- O. Mishima and H. E. Stanley, Nature, 1998, 396, 329–335 CrossRef CAS.
- D. Rosenfeld and W. L. Woodley, Nature, 2000, 405, 440–442 CrossRef CAS PubMed.
- V. P. Melnikov, A. N. Nesterov, L. S. Podenko, A. M. Reshetnikov and V. V. Shalamov, Chem. Eng. Sci., 2012, 71, 573–577 CrossRef CAS.
- V. P. Melnikov, A. N. Nesterov, A. M. Reshetnikov and A. G. Zavodovsky, Chem. Eng. Sci., 2009, 64, 1160–1166 CrossRef CAS.
- V. P. Melnikov, A. N. Nesterov and A. M. Reshetnikov, Dokl. Phys. Chem., 2007, 417, 304–307 CrossRef CAS.
- V. P. Melnikov, A. N. Nesterov, A. M. Reshetnikov and A. G. Zavodovsky, Chem. Eng. Sci., 2009, 64, 1160–1166 CrossRef CAS.
- V. P. Melnikov, A. N. Nesterov, A. M. Reshetnikov, V. A. Istomin and V. G. Kwon, Chem. Eng. Sci., 2010, 65, 906–914 CrossRef CAS.
- V. P. Melnikov, A. N. Nesterov, A. M. Reshetnikov and V. A. Istomin, Chem. Eng. Sci., 2011, 66, 73–77 CrossRef CAS.
- K. V. Agrawal, S. Shimizu, L. W. Drahushuk, D. Kilcoyne and M. S. Strano, Nat. Nanotechnol., 2017, 12, 267–273 CrossRef CAS PubMed.
- A. Fouzri, R. Dorbez-Sridi, S. Nasr and M. Oumezzine, Biomol. Eng., 2002, 19, 207–210 CrossRef CAS.
- T. Kaneko, J. Bai, T. Akimoto, J. S. Francisco, K. Yasuoka and X. C. Zeng, Proc. Natl. Acad. Sci. U. S. A., 2018, 115(19), 4839–4844 CrossRef CAS PubMed.
- G. Cicero, J. C. Grossman, E. Schwegler, F. Gygi and G. Galli, J. Am. Chem. Soc., 2008, 130, 1871–1878 CrossRef CAS PubMed.
- O. Rebolledo-Mayoral, J. Stomberg, S. McKean, H. Reisler and C. Wittig, J. Phys. Chem., 2012, 116(1), 563–569 CAS.
- G. Kumi, S. Malyk, S. Hawkins, H. Reisler and C. Wittig, J. Phys. Chem. A, 2006, 110(6), 2097–2105 CrossRef CAS PubMed.
- S. Malyk, G. Kumi, H. Reisler and C. Wittig, J. Phys. Chem. A, 2007, 111(51), 13365–13370 CrossRef CAS PubMed.
- S. Alavi and J. A. Ripmeester, J. Chem. Phys., 2010, 132, 144703 CrossRef PubMed.
- S. A. Bagherzadeh, S. Alavi, J. A. Ripmeester and P. Englezos, Fluid Phase Equilib., 2013, 358, 114–120 CrossRef CAS.
- M. Uddin and D. Coombe, J. Phys. Chem. A, 2014, 118, 1971–1988 CrossRef CAS PubMed.
- S. A. Bagherzadeh, S. Alavi, J. Ripmeester and P. Englezos, J. Chem. Phys., 2015, 142, 214701 CrossRef PubMed.
- K. S. Sujith and C. N. Ramachandran, J. Phys. Chem. B, 2017, 121, 153–163 CrossRef CAS PubMed.
- G. P. Johari and O. Andersson, Thermochim. Acta, 2007, 461, 14–43 CrossRef CAS.
- M. T. Kirchner, R. Boese, W. E. Billups and L. R. Norman, J. Am. Chem. Soc., 2004, 126, 9407–9412 CrossRef CAS PubMed.
- F. Hollander and G. A. Jeffrey, J. Chem. Phys., 1977, 66, 4699 CrossRef CAS.
- O. P. Dauber, V. A. Roberts, D. J. Osguthorpe, J. Wolff, M. Genest and A. T. Hagler, Proteins: Struct., Funct., Genet., 1988, 4, 31–47 CrossRef.
- W. L. Jorgensen, J. Chandrasekhar, J. D. Madura, R. W. Impey and M. L. Klein, J. Chem. Phys., 1983, 79, 926–935 CrossRef CAS.
- L. Song and J. Kästner, Phys. Chem. Chem. Phys., 2016, 18, 29278–29285 RSC.
- M. Pezzella, O. T. Unke and M. Meuwly, J. Phys. Chem. Lett., 2018, 9, 1822–1826 CrossRef CAS PubMed.
- T. Shimonishi, N. Nakatani, K. Furuya and T. Hama, Astrophys. J., 2018, 855, 27 CrossRef.
- M. P. Allen and D. J. Tildeslay, Computer simulation of liquids, Clarendon Press, Oxford, 1987, pp. 156–162 Search PubMed.
- S. A. Nose, Mol. Phys., 1984, 52, 255–268 CrossRef CAS.
- S. H. Chen, P. Gallo, F. Sciortino and P. Tartaglia, Phys. Rev. E: Stat. Phys., Plasmas, Fluids, Relat. Interdiscip. Top., 1997, 56, 4231–4243 CrossRef CAS.
- I. M. Svishchev and P. G. Kusalik, Phys. Rev. Lett., 1995, 75, 3289–3292 CrossRef CAS PubMed.
- J. L. Finney, D. T. Bowron, A. K. Soper, T. Loerting, E. Mayer and A. Hallbrucker, Phys. Rev. Lett., 2002, 89, 205503 CrossRef CAS.
- N. V. Churaev, M. J. Setzer, O. A. Kiseleva and V. D. Sobolev, Colloids Surf., A, 2007, 300, 327–334 CrossRef CAS.
- A. Einstein, Ann. Phys., 1905, 17, 549–560 CrossRef CAS.
| This journal is © The Royal Society of Chemistry 2018 |


