 Open Access Article
Exchange dynamics between amphiphilic block copolymers and lipidic membranes through hydrophobic pyrene probe transfer†
Lourdes Mónica Bravo-Anaya *abc,
Gabriel Landazuri Gómezc,
Edgar Figueroa-Ochoad,
Francisco Carvajal Ramose,
J. Félix Armando Soltero Martínezc and
Yahya Rharbi*ab
aUniv. Grenoble Alpes, LRP, F-38000 Grenoble, France. E-mail: monik_ayanami@hotmail.com; yahya.rharbi@univ-grenoble-alpes.fr
bCNRS, LRP, F-38000 Grenoble, France
cUniversidad de Guadalajara, Departamento de Ingeniería Química, Blvd. M. García Barragán #1451, C.P. 44430, Guadalajara, Jalisco, Mexico
dUniversidad de Guadalajara, Departamento de Química, Blvd. M. García Barragán #1451, C.P. 44430, Guadalajara, Jalisco, Mexico
eUniversidad de Guadalajara, CUTonalá, Departamento de Ingenierías, Nuevo Periférico #555 Ejido San José Tatepozco, C.P. 45425, Tonalá, Jalisco, Mexico
First published on 26th November 2018
Abstract
Vectorization has experienced significant development over the last few years and has been used to control the distribution of active ingredients to a target by their association with a vector. However, controlled drug delivery suffers from “burst release” as the drugs are released before the targeted site. Very few studies have examined the collective mechanisms of fission–fusion on micelles in the transport and expulsion of active ingredients. Endocytosis and exocytosis of cells are examples of fusion and fission in biological matter. Understanding these dynamics becomes crucial for the design and the control of new materials and new processes effective in controlled drug delivery. In this work, a study of the exchange dynamics between amphiphilic block copolymers and lipid membranes for vectorization of hydrophobic molecules using a fluorescence technique is presented. A highly hydrophobic alkylated pyrene, PyC18, is used as a fluorescent probe that can be exchanged between amphiphilic block copolymer micelles and liposomes via different mechanisms. It is demonstrated that the exchange dynamics evaluated for different liposome concentrations is a collective mechanism characterized by having two rate constants.
1. Introduction
Nowadays, the specific delivery of active ingredients, known as vectorization, represents a great challenge in therapeutic research.1–3 This process has been used to control the distribution of active ingredients such as proteins, genes (for gene therapy) and drugs to a target by association with a vector.4–6 It allows increasing the therapeutic effects of the drug and may reduce the side effects.4–6 Vectorization may be achieved by chemical, physical or biological methods, and is considered an important process in cases where the drug is chemically unstable or presents weak characteristics pharmacokinetics.7,8 Vectorization proposes several benefits such as increasing the therapeutic effect, decreasing toxicity caused by the active principle, increasing half-life of the active ingredient and releasing the active ingredient in time among others.9,10Three main types of physical vectors are known: liposomes, microparticles and nanoparticles.11,12 The main difference between microparticles and nanoparticles is the size of both structures, i.e. greater or less than 1 μm, respectively.13,14 Nanoparticles formed with copolymers have been widely studied and used in the preparation of drug and gene delivery systems.15,16 Several kinds of copolymers such as amphiphilic block copolymers, graft copolymers and crosslinked copolymers, among others, are of great interest for controlled drug delivery applications.17–25 Amphiphilic block copolymers are known by their efficiency during drug delivery processes with multiple effects.26,27 The incorporation of drugs into the micelles core formed by these copolymers may lead to an increment of solubility, metabolic stability and circulation time for the drug.28 In this manner, the core–shell design of the micelles is crucial for their effectiveness in drug delivery.29 It is worth to mention that the core is a water-incompatible compartment able to receive the incorporation of several therapeutic reagents, that is segregated from the aqueous exterior by the hydrophilic chains of the shell.30 Lipophilic drugs solubilization by copolymers can be done by hydrophobic and/or covalent interactions between a part of the polymer structure and the drug.15 Recently, the interactions of the triblock copolymer unimers with multidrug-resistant cancer cells have been studied, resulting in the sensitization of these cells with respect to various anticancer agents.31–33
On the other side, liposomes are different from the microparticles and nanoparticles due to their nature and composition. It is noteworthy that the liposomes are vesicles consisting of concentric membranes with single or multiple phospholipid bilayers used as the simplest models of cells.34,35 They are formed spontaneously as a result of lipid–water interactions. Various techniques exist for preparing liposomes, which can allow obtaining vesicles with different sizes, internal volumes and encapsulation capacities.36,37 The three principal kinds of liposomes are the following: small unilamellar vesicles (SUVs) with sizes from 20 to 100 nm, large unilamellar vesicles (LUVs) with sizes from 100 to 500 nm and giant unilamellar vesicles (GUVs) with sizes from 0.5 to 100 μm, which are generally studied as over-simplified models of biological cells and can be directly observed by optical microscopy.38 A giant unilamellar vesicle (GUV) has a similar basic structure of all biological cells, since a vesicle membrane imitates the self-closed lipid matrix of the plasma membrane.
Vectorization has undergone significant development in the last few years.39,40 Currently, molecules used in chemotherapy are generally hydrophobic and require a vectorization process to be transported to the targeted cell.41,42 However, this controlled release of drugs suffers from a phenomenon known as “burst release”, in which the active ingredient is released before reaching its target.43–45 Micelles made of amphiphilic block copolymers with a nanoscale size between 5 and 100 nm, have an inner core formed by the hydrophobic blocks creating a space for the solubilization, storage, controlled delivery and protection of hydrophobic drugs.15 Many studies have been performed in order to develop a variety of nanostructures, including micelles, polymersomes and hydrogels for an efficient drug delivery.15,31,46,47 However, very few studies have examined the collective mechanisms as fission–fusion on micelles in the transport and expulsion of active ingredients. Understanding these dynamics during specific stimuli for the release of the active ingredient becomes crucial for the design and the control of new materials and new processes effectives in controlled drug delivery.
The focus of this paper is related to the study of the dynamics between amphiphilic triblock copolymers micelles and liposomes for the vectorization of hydrophobic molecules using a fluorescence technique that has been previously used to characterize, analyze and quantify collective dynamics between amphiphilic copolymers micelles.48 The studied system in this work is composed by liposomes representing cells (GUVs), amphiphilic block copolymer micelles of P104 Pluronic modeling the transporting vehicles including highly hydrophobic alkylated pyrene, PyC18, representing the active ingredient introduced into the micelles. The role of liposomes concentration and amphiphilic triblock copolymer concentration is investigated in order to control the vectorization dynamics between micelles to liposomes. The exchange dynamics of the fluorescent probe between amphiphilic block copolymer micelles and liposomes is discussed in terms of the kinetic constant kdecay, obtained from the reciprocal of the exchange time constant, as a function of liposomes concentration.
2. Experimental section
2.1 Materials
Triblock copolymer Pluronic® P104, [(PEO)27–(PPO)61–(PEO)27] (Scheme 1a), with a molecular weight of 5900 g mol−1, was provided by the BASF Company.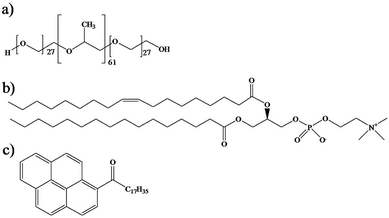 | ||
| Scheme 1 Chemical structures of (a) triblock copolymer Pluronic® P104, (b) L-α-phosphatidylcholine and (c) hydrophobic fluorescent probe PyC18. | ||
P104/H2O solutions were prepared with water obtained through a Millipore Milli-Q purification system. L-α-Phosphatidylcholine (PC) from egg yolk (1,2-diacyl-sn-glycero-3-phosphocholine C42H82NO8P), with a molecular weight of 776 g mol−1 was provided by Sigma Aldrich and was used as received (Scheme 1b). Organic solvents chloroform (Sigma Aldrich, ≥99%) and methanol (Sigma Aldrich, 99.8%) were used as received. Pyrene probes (Sigma Aldrich) were used as received and pyrenyl-octadecanone C34H44O (PyC18) (Scheme 1c) was prepared using a Friedel–Crafts acylation of pyrene with stearoyl chloride in dichloroethane in the presence of aluminum chloride (AlCl3).50
2.2 Solutions preparation
Micellar solutions of triblock copolymer P104 were prepared by mixing P104 with water under gentle stirring at room temperature for 24 h, then, the solution was stored for more than 24 h at 37 °C to form spherical micelles at equilibrium. The solubilization of the probe PyC18 in the copolymer micelles was carried out following the procedure described by Rharbi et al.48 For that purpose, PyC18 probe was solubilized in P104 micelles by mixing the aqueous copolymer solution (10 mg mL−1) with PyC18 at 75 °C. The solutions were stirred vigorously for 10 min in a Vortex Genie 2 model G 650 at its maximum frequency (>10 Hz). The solution was then cooled back to 37 °C to form micelles including the fluorescent probe. This procedure was repeated several times. The undissolved probe was removed by filtering the solution at 37 °C when needed. In complementary experiments, pyrene was solubilized in the P104 micelles by mixing P104 solutions in the presence of small amounts of pyrene under gentle stirring for more than 24 h at 37 °C. The undissolved pyrene was removed by filtration using a Millex® GS 0.22 μm filter by Millipore.The liposomes suspensions were prepared following the procedure reported elsewhere.38 The phospholipid was first dissolved in chloroform and methanol with a ratio of 2![[thin space (1/6-em)]](https://www.rsc.org/images/entities/char_2009.gif) :
:![[thin space (1/6-em)]](https://www.rsc.org/images/entities/char_2009.gif) 1, respectively, and the water was added drop wise to the solution under gentle stirring. The organic solvent was removed through evaporation during 5 days at 37 °C. The total volume of the solution was kept constant throughout the solvent evaporation process by adding water progressively using self-controlled mechanism to compensate the evaporated water. The evaporation was stopped when no solvent was present. This procedure allowed obtaining a suspension containing giant unilamellar vesicles (GUVs), with a concentration of 25 mg mL−1 (information available in ESI, Fig. S1†). The liposomes suspensions were stored at 4 °C. Large unilamellar vesicles (LUVs) were obtained by extrusion of a suspension of GUVs, using a 0.22 μm filter (Millex® GS by Millipore). LUVs suspensions were prepared from the initial GUVs suspension in order to preserve the lipid composition and to be able to perform dynamic light scattering measurements in convenient conditions.49
1, respectively, and the water was added drop wise to the solution under gentle stirring. The organic solvent was removed through evaporation during 5 days at 37 °C. The total volume of the solution was kept constant throughout the solvent evaporation process by adding water progressively using self-controlled mechanism to compensate the evaporated water. The evaporation was stopped when no solvent was present. This procedure allowed obtaining a suspension containing giant unilamellar vesicles (GUVs), with a concentration of 25 mg mL−1 (information available in ESI, Fig. S1†). The liposomes suspensions were stored at 4 °C. Large unilamellar vesicles (LUVs) were obtained by extrusion of a suspension of GUVs, using a 0.22 μm filter (Millex® GS by Millipore). LUVs suspensions were prepared from the initial GUVs suspension in order to preserve the lipid composition and to be able to perform dynamic light scattering measurements in convenient conditions.49
2.3 Characterization methods
Dynamic light scattering (DLS) measurements were performed using a Malvern Zetasizer 5000 apparatus equipped with a 7132 multibit correlator and a multiangle goniometer. The light source was a He–Ne 5 mW laser with a wavelength of 632.8 nm. The light scattering intensity was measured through a 400 μm pinhole. DLS measurements were carried out at several scattering angles between 35° and 135°. The corresponding hydrodynamic radius was calculated using the Stokes–Einstein equation for spherical particles. ζ-Potential measurements were performed in a Malvern Zetasizer NanoZS at a temperature of 37 °C. The results are the average of 5 runs. The instrument measured the electrophoretic mobility of the particles and converted it to the ζ-potential using the classical Smoluchowski expression. Microscopy images of GUVs were acquired with a confocal microscope Leica S440. UV-Vis measurements were performed in a HP 8452 UV-Vis Spectrophotometer at room temperature in order to calculate PyC18 concentration in the P104 triblock copolymer solutions (with the A380 value and ε = 7.454 × 10⁴). ζ-Potential and DLS data is analyzed in terms of the P104 micelles concentration and the lipids concentration, i.e. [P104]/[lipid].2.4 Kinetic experiments
Fluorescence kinetic measurements were carried out in a Jobin Yvon Spectrometer Fluorolog III (2-2) in the S/R mode. P104/H2O solutions were used at concentrations and at a temperature above the critical conditions at which spherical micelles are formed. The experimental conditions were selected close to the physiological conditions, i.e. controlled pH of 6.5 and a temperature of 37 °C, in order to facilitate the understanding of micellar drug delivery vehicles interactions with phospholipid membranes. These experiments were performed by mixing P104 micelles containing PyC18 with a suspension of GUVs free of probe in a cylindrical pyrex cell (1 cm of diameter). The measurement cell was placed in a temperature controlled cell holder at 37 ± 0.1 °C.Measurements were performed with liposomes suspensions at 25 mg mL−1 and P104 micelles solutions with PyC18 at 10 mg mL−1, at different ratios, to obtain a final concentrations of 3 mg mL−1 for the P104 solution and 6, 8, 10 and 15 mg mL−1 for the liposomes suspensions. The measurements were performed in the emission mode by fixing the excitation wavelength at 344 nm and scanning the emission wavelength between 360 nm and 600 nm. This scan was repeated each 3 min in the early kinetic time and then each few hours at the end of the kinetic procedure, which lasted one week. The fluorescence spectrum shows two signals, identified as monomer species (366 nm < IMON < 425 nm) and excimer species (440 nm < IEX < 550 nm). The excimer IEX was calculated by integrating the intensity peak between 440 nm and 550 nm and the monomer one between 366 nm and 425 nm. The existence of this excimer emission band supposes that P104 micelles are bearing two or more PyC18 molecules.48 Before analysis of the spectrum, possible contribution of liposomes was taken into consideration. For that purpose, liposomes solutions at different concentrations were studied in order to remove any liposomes signal contribution to the emission spectra. A special program using OriginPro software was developed in order to subtract the intensity signal of liposomes suspensions from each emission spectra and to integrate the excimer and monomer intensity peaks. The evolution of the acquired spectra as a function of time was quantified by calculating the ratio of the excimer to monomer intensity signals.
Other kinetic experiments were performed by measuring the lifetime evolution of PyC18 by using a homemade single photon counting spectrometer. The excitation wavelength was 344 nm and the emission 380 nm. Spectrums were taken each 30 min. These measurements were performed by mixing a P104 solution containing small amounts of PyC18 with liposomes solutions. The excimer of this solution was chosen to be small enough to be able to quantify the pyrene lifetime from the decay of the signal. The lifetime was calculated by fitting the decays with a single exponential expression removing the first excimer contribution at the beginning of the spectrum.
3. Results and discussion
3.1 Characterization of P104 micelles, liposomes and their mixtures
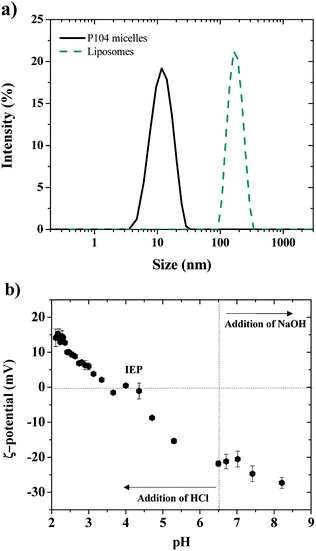
Shape information about the obtained P104 micelles in water was obtained from the combination of the light scattering intensity and the hydrodynamic radius by performing dynamic light scattering (DLS) measurements at equilibrium in a temperature range from 10 to 64 °C.51,52 The variation of the total scattering intensity with temperature was used to estimate the critical micellar temperature (CMT), which was found to decrease with increasing P104 copolymer concentration.53 The CMT of these micelles was estimated from the increase of the scattering intensity as micelles form. It was found to be 26 °C at 10 mg mL−1, which is in good agreement with the reported values in the literature.54 Between 26 and 54 °C, the average hydrodynamic radius of the formed micelles is 11.4 nm (Fig. 1a).53,54 Further analysis of the light scattering suggest that the obtained P104 micelles are spherical, as shown in the literature.53,54The net charge of P104 micelles was then evaluated through ζ-potential measurements at a temperature of 37 °C and a pH of 6.5, obtaining a value of around −6 ± 2 mV, which reveals a slight negative charge due mostly to traces of sodium or potassium hydroxide used as catalysts during the oxyalkylation step of P104 triblock copolymer synthesis.53
Dimensions of LUVs having a concentration of 25 mg mL−1 and a pH = 6.5 were determined, as a first approximation, through dynamic light scattering measurements at 37 °C (Fig. 1a). For this, a polydisperse suspension of liposomes having an average hydrodynamic diameter of 450 ± 100 nm was firstly identified, corresponding to a giant unilamellar vesicles (GUVs) suspension.38 Then, after extrusion of GUVs suspensions, LUVs having diameters of 170 nm were obtained (Fig. 1a, PDI: 0.150). The evolution of liposomes size (GUVs and LUVs) with time was monitored by performing DLS measurements during at least one week, showing that the obtained dimensions were stable at these experimental conditions (concentration, pH and temperature).
The electric charge of LUVs and GUVs was then studied through ζ-potential measurements, which reveal that their structure is sensitive to pH and ionic strength, as previously reported.55–58 This is considered an important parameter since charge affects both the particle stability and liposomal pharmacology.55 Fig. 1b shows the ζ-potential dependence with pH of LUVs suspension. The ζ-potential increases with the addition of HCl, which decreases the pH of the suspension. The isoelectric point (IEP) is found when ζ-potential = 0 mV around a pH of 4.0, in good agreement with the literature.57 Then, the ζ-potential becomes positive and reaches a constant value of +14 mV at a pH around 2.0. When pH decreases, the dissociation of the phosphate acid and carboxyl groups is reduced and the relative positive contribution of the quaternary amino group increases.58 On the other side, the ζ-potential decreases with the addition of NaOH until reaching a constant value of around −30 mV at a pH of 8, which was attributed to the complete dissociation of the phosphate and carboxyl groups of the lipids.58 At a pH of 6.5, corresponding to the pH of the liposomes preparation (LUVs), ζ-potential is negative and has a value around to −22 mV, in good agreement with the values previously reported by several authors.55,56 In this study, the pH value of GUVs suspensions is maintained at pH = 6.5, where the membrane is negatively charged and stable.55
3.2 Structure and interactions of P104 micelles and liposomes mixtures
Since P104 micelles are weakly negatively charged due to catalysts residues and liposomes are stable and highly negatively charged, the electrostatic interactions between both particles were studied through ζ-potential measurements.53 Fig. 2 shows the ζ-potential dependence with the ratio given by P104 and lipids concentration, i.e. [P104]/[lipid], assuming that about half of the lipid heads are outside the liposome and contribute to the interactions with the external medium. Different amounts of P104 micelles with a concentration interval from 0 up to 10 mg mL−1 were mixed with a liposomes suspension with an initial concentration of 25 mg mL−1, resulting on different [P104]/[lipid] ratios.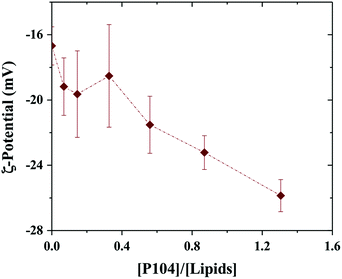 | ||
| Fig. 2 ζ-Potential variation with the [P104]/[lipid] ratio. Measurements were performed at a constant temperature of 37 °C and a pH = 6.5. | ||
It is possible to observe that the ζ-potential slightly decreases with the increase of the amount of P104 micelles in the mixture, suggesting the presence of weak electrostatic interactions between micelles and the lipidic membrane. These measurements show clearly that part of the P104 micelles interact with the liposome membrane, leading to reduction of the total net charges.
The obtained structures from the mixtures between P104 micelles and liposomes were studied through DLS measurements by following the evolution of the hydrodynamic diameter of LUVs (selected to perform this study due to their size, suitable for DLS measurements) suspensions having different concentrations with the addition of various amounts of P104 micelles. The average hydrodynamic diameter for all the mixtures was found to be 160 ± 40 nm, remaining almost constant to the initial diameter of the liposome (information available in ESI, Fig. S2†). Then, the presence of P104 micelles does not induce any significant modification of the hydrodynamic diameter of liposomes, which remain almost constant.
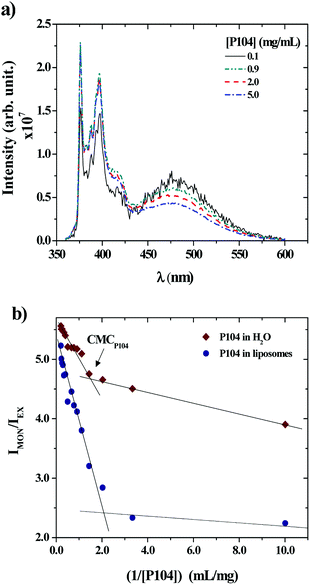
P104 micelles may undergo partitioning into unimers in water and liposomes suspensions. Hence, the fraction of P104 micelles in water is taken as the critical micellar concentration (CMC). The partition of P104 micelles in the liposome suspension can be estimated from the excimer and the monomer formation of PyC18 through fluorescence measurements. When a P104 solution containing micelles is mixed with a liposomes suspension, the total concentration of P104 is diluted. Some P104 micelles will interact with liposomes in different ways and another part of the copolymer will go into water, since the CMC gets closer. The mechanism of interaction was studied using P104 micelles including a fluorescent probe. The evolution of the PyC18 emission spectra contained in P104 solutions having different concentrations mixed with a liposome suspension having a fixed concentration of 25 mg mL−1 was studied and is illustrated in Fig. 3a. Here, it is possible to observe a decrease in the excimer band, located at λEX = 480 nm and an increase in the monomer band, located at λMON = 376 nm, decreasing the P104 micelles concentration in the final solution. The existence of the excimer emission band at 480 nm supposes that P104 micelles are bearing two or more PyC18 molecules.48 Then, when P104 micelles with PyC18 are mixed with PyC18 free liposomes suspension, the evolution of the spectrum infers an exchange of PyC18 between micelles and liposomes, leading to P104 micelles bearing only one PyC18 probe48 before reaching the CMC.
The evolution of the PyC18 emission spectra contained in a P104 solution in water at different concentrations was also studied to compare the variation on the excimer and monomer bands to the results obtained for the PyC18 contained in P104 micelles and mixed with a liposomes suspension. This variation was quantified by using the ratio between the monitored intensities, IMON/IEX, for P104 micelles and liposomes mixtures and for the dilution of P104 micelles in water. Fig. 3b shows the obtained results in terms of the reciprocal of P104 triblock copolymer concentration. In both cases it is possible to identify a change localized around the P104 concentration of 0.67 mg mL−1 in water and around the P104 concentration of 0.53 mg mL−1 in liposome suspensions, related to the CMC of the amphiphilic block copolymer at the temperature of 37 °C, in good agreement with previous results. It is then possible to say that the value of P104 CMC at 37 °C remains almost constant in the liposomes environment.
3.3 Vectorization dynamics between liposomes and P104
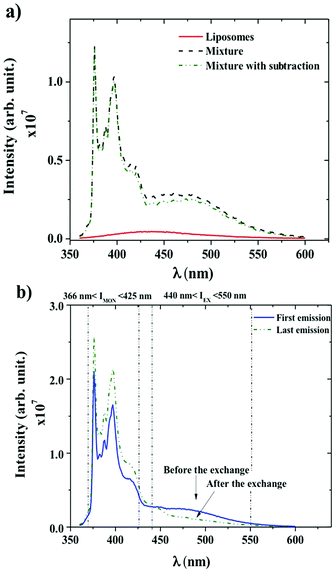
Dynamics between P104 amphiphilic triblock copolymer, selected as vectors, and liposomes were studied through fluorescence measurements. Fig. 4a shows the spectra of liposomes suspension having a concentration of 25 mg mL−1 and the emission spectra of PyC18 in an aqueous solution of P104 with a concentration of 10 mg mL−1 mixed with the liposomes suspension with and without the subtraction of the emission spectrum of liposomes (initial value without fluorescent probe inclusion). In this study, an excitation wavelength of 344 nm was applied. The fluorescence spectra of P104 micelles containing more than one molecule of PyC18 exhibit an emission excimer band at 480 nm and an emission monomer band at 376 nm. L-α-Phosphatidylcholine liposomes present a fluorescence spectrum in the wavelength range between 350 and 600 nm with a characteristic peak around 425 nm. This response is related to impurities of liposomes suspensions. The intensity signal obtained for liposomes suspension is considerably lower than the intensity signal obtained for P104 micelles containing PyC18, however, it is important to remove the emission spectra of liposomes. In this way, in further analysis, the emission spectrum of liposomes will be subtracted from PyC18 in P104 micelles emission spectra in order to remove any other contribution to the fluorescence intensity that gives us the information about the exchange dynamics following PyC18 bands evolution.48,59–61 The contribution of the liposome intensity signal depends on its concentration, while increasing liposomes suspension concentration the intensity increases, however, nevertheless, at low concentrations, the signal remains negligible.Fig. 4b shows the emission spectra of PyC18 in an aqueous solution of P104 with a concentration of 3 mg mL−1 before and after the exchange with a liposomes suspension at concentration of 17.5 mg mL−1 and a constant pH of 6.5. The emission spectrum presents a broad excimer emission with a fluorescence signal between 440 and 550 nm, and monomer fluorescence at 376–400 nm, as for the case of PyC18 spectrum in amphiphilic block copolymer micelles.48 The presence of the excimer emission at 480 nm infers the presence of micelles containing two or more PyC18 molecules. The response of the monitored emission 4 days after the mixture of P104 micelles and liposomes shows a decrease in the value of the excimer and an increase of the monomer intensity. This spectrum evolution infers an exchange of PyC18 between P104 micelles and liposomes, which mechanism will be detailed in the following.
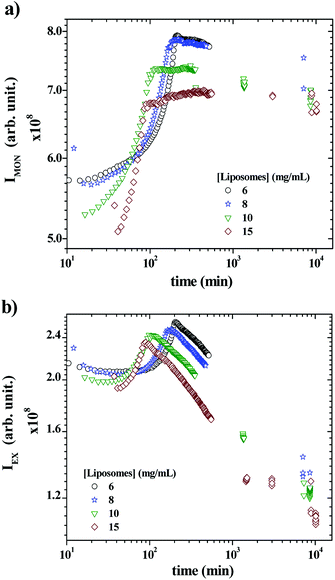
Fig. 5a and b show the time-scan analysis for the evolution of the monomer and the excimer intensities, respectively, after mixing P104 containing PyC18 with liposomes suspension. Both IEX and IMON increase during the early kinetic time and reached a maximum. Then, IEX decreases for all liposomes concentrations, showing the efficient exchange of PyC18 between P104 micelles and liposomes, which infers the transfer of PyC18 transported by P104 onto liposomes membrane. The IMON, instead, decreases very slightly for 6 and 8 mg mL−1 after reaching the maximum, then for 10 mg mL−1, it remains nearly constant and finally, for 15 mg mL−1, it continues increasing very slowly until reaching a constant behavior.
In fact, during the exchange kinetic, the decrease of IEX should be accompanied with an increase in IMON. Yet the magnitude of growth of the monomer intensity is usually much lower than that of the decrease of the excimer particularly for low average number of pyrene per micelles (〈n〉), which is the case here. Since the exchange kinetic is very slow in the present experiment, the growth of IMON is most likely counterbalanced with the slight photobleaching that leads to stabilization of IMON particularly for long time. Because the ratio IEX/IMON varies linearly with 〈n〉62 the exchange kinetic is exclusively quantified using IEX/IMON.
The early increase of the intensities (IEX and IMON) until reaching a maximum is most likely due to a change on the PyC18 environment within the P104 micelles rather than a change in the excimer quenching process. One possible explanation of this increase is the reduction of the oxygen concentration in P104 micelles, leading to an increase of the total fluorescence intensity. Because of the relatively long life time of pyrene (from 200 to 500 ns) oxygen is an efficient quencher for pyrene fluorescence. In this case, the growth of fluorescence can be quantified using the Stern–Volmer equation (I0f/If = 1 + kqτ0[Q], where I0f is the intensity without quencher, If is the intensity with quencher, kq is the quencher rate coefficient, [Q] is the quencher concentration and τ0 is the lifetime of the emissive excited state of the chemical species). According to this equation, the fluorescence intensity growth with time corresponds to the reduction of partial oxygen pressure or its solubility within the P104 micelles. One possible explanation of the origin of this phenomenon will be discussed later. When increasing liposomes concentration, the overall growth decays shift to lower times, as well as the position of the maximum for both IEX and IMON. This means that the kinetic of this phenomenon is activated by the increase of the presence of liposomes in the mixture. The time (τmax) corresponding to the maximum of IEX and IMON can be used to quantify this decay.
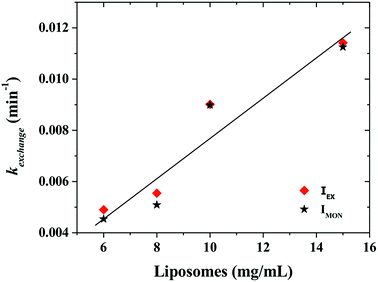
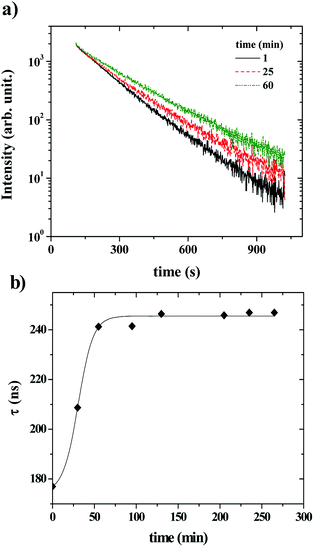
Fig. 6 shows that the variation of the kinetic constant kexchange = 1/τmax for both the maximum of both IEX and IMON increases with increasing liposomes concentration. This means that this process is a second order kinetics, which is most likely due to a bimolecular phenomenon resulting from the cooperative interactions between P104 micelles bearing the PyC18 and liposomes. Since the overall intensity could also be influenced by some optical artifacts, an extra confirmation was obtained from the variation of the PyC18 lifetime throughout a kinetics experiment performed by using a homemade single photon counting spectrometer. A P104 solution containing small amounts of PyC18 was mixed with a liposomes suspension. The excimer of this solution was chosen to be small enough to be able to quantify the pyrene lifetime from the decay of the signal (Fig. 7a).
After mixing P104 micelles with PyC18 and liposomes, the lifetime (τPyC18) increases with time reaching a maximum around 80 min for liposomes suspension with a concentration of 15 mg mL−1 (Fig. 7b). The increase of τPyC18 during the growth period of this kinetics is similar to the one observed using the IEX and IMON intensities. The kinetic constant (klifetime) calculated from the maximum of the τPyC18 is similar to that calculated also from IEX and IMON intensities. All of this confirms that the observed phenomenon is due to a slow change of the environment of the PyC18 within the P104 micelles, as proposed previously. One possible explanation for this slow change of the environment within the micelles is the slow migration of some of the additives of the liposomes that could reduce the oxygen solubility within the micelles. Therefore, the increase of the growth rates of kexchange (1/τmax) could mean that this phenomena results after a collision between P104 micelles bearing PyC18 with liposomes and the transfer of the additives from liposomes to P104 micelles during the collision. This process can be assimilated with an adhesion–collision process, in which exchange could occur.
However, during the growth process, the concentration of PyC18 within the micelles does not change significantly, otherwise one would observe a significant decrease of IEX and a growth of IMON. Even if the monomer and the excimer intensities increase in the first part of the kinetics (Fig. 5a and b), their ratio (IEX/IMON) contain the information about the fraction of micelles bearing more than two PyC18 molecules. For a low average number of pyrene micelles 〈n〉 < 0.5, IEX/IMON can be considered proportional to 〈n〉.48 The IEX/IMON ratio is then used to estimate the kinetic constants of PyC18 migration from micelles to liposomes.
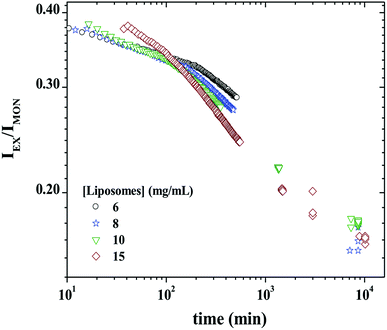
Fig. 8 shows IEX/IMON decays as a function of time for a mixture of 3 mg mL−1 P104 micelles containing PyC18 with GUVs suspension at different concentrations. The observed peaks from the evolution of the monomer and the excimer intensities disappear in this representation. This ratio will then depend mainly on the average number of PyC18 per micelles, resulting in the best way to quantify the exchange dynamics between P104 micelles containing PyC18 and liposomes. From the time-scan analysis of IEX/IMON it is possible to obtain the main relaxation time (τdynamics) of the global exchange dynamics between micelles and liposomes. The kinetic decays can be simulated by a mono-exponential function with an apparent relaxation time.
The kinetic constant, kdynamics, of P104 micelles–liposome exchange can be then quantified from the reciprocal of the apparent relaxation time obtained from the following expression:
| IEX/IMON = Ae−t/τdynamics + B | (1) |
It is worth to mention that the apparent relaxation time (τdynamics) obtained from the mono-exponential function is similar to the average value 〈τ〉 calculated from the fit to two exponentials. This was also valid for the case of the exchange dynamics at equilibrium in triblock copolymer micelles.48
3.4 Liposomes concentration dependence on the PyC18 vectorization dynamics
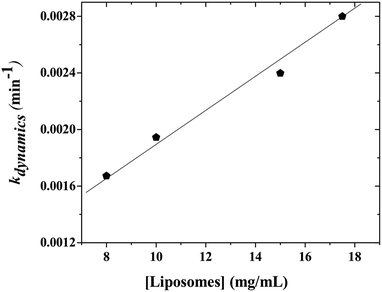
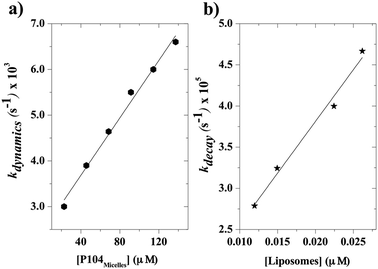
When the kinetics are repeated for different mixtures containing P104 micelles with a constant concentration and liposomes suspensions having different concentrations, a linear dependence of the exchange rate kdynamics = 1/τdynamics with liposomes concentration is obtained. Fig. 9 shows the kinetic constant (kdynamics) dependence with the liposomes concentration in a mixture containing P104 micelles filled with PyC18 at a concentration of 3 mg mL−1. It is possible to observe an increment on kdynamics values with the increase of liposomes concentration in the mixture. The linear behavior obtained within the concentration range from 8 to 17.5 mg mL−1 is explained with the following equation:| kdynamics = k1 + k2 [liposomes] | (2) |
Firstly, a linear dependence of kdynamics as a function of the liposomes concentration with a kinetic constant called k2, or fusion–adhesion kinetic constant, is considered as a second order mechanism. Therefore, the exchange dynamics between P104 amphiphilic block copolymers and liposomes consists in a collective mechanism involving fusion–adhesion, exchange and separation. This second order mechanism depends on the variation of the amount of liposomes in the suspension.
The kinetic constants, kdynamics, obtained from the exchange dynamics between P104 micelles (unpublished results) and those obtained from the exchange dynamics between P104 micelles and liposomes are compared in terms of their dependence with the number of empty micelles and the number of empty liposomes (Fig. 10a and b). The rate of collision–adhesion exchange, k2, calculated from the slope of the kdynamics as a function of the molar concentration of liposomes is k2 = 1256 M−1 s−1. This value is 50 times the fusion rate of P104 micelles–micelles, which is equal to 25 M−1 s−1.
The exchange rate via collision–adhesion-exchange process is the product of a diffusion controlled rate kdiff and the probability of adhesion-exchange (Preac) (eqn (3)).
| k2 = kfus = kdiffPreac | (3) |
The diffusion controlled rate kdiff can be written as:
| kdiff = 4πNA(Rh1 + Rh2)(D1 + D2) × 1000 | (4) |
| Rh = kBT/6πηD | (5) |
For the liposome–micelles case, kdiff = 5 × 10¹⁰ M−1 s−1 while for micelle–micelle case kdiff = 7 × 10⁹ M−1 s−1. The collision rate of micelle–liposome is higher than that of micelle–micelles due to the liposome size. Therefore, the probability of adhesion-exchange (Preac) is 1.25 × 10⁻⁸, which is in the same order of magnitude of P104 micelle–micelle Preac (2.4 × 10⁻⁸). This suggests that P104 micelles control the adhesion-exchange process of P104-liposome system.
On the other hand, a first order mechanism with a rate independent of the liposomes concentration and with a kinetic constant called k1 is related to the exit–entry process of the probe (dominated by water solubility, which is very low), to the exchange-assisted by the unimer (almost negligible) of the probe or to fission–fusion exchange. A moderately water soluble molecule as pyrene (10−7 mol L−1) can be mainly exchanged through an exit–entry process having a rate one magnitude greater than the rate observed in this dynamic. In addition, the C18 chain present in the pyrene derivative, PyC18, reduces its solubility in water and causes the exit ratio to be negligible during the experiment. To confirm this statement, complementary experiments were performed, as the limitation for the exit–entry process of the PyC18 is the insolubility in water (Cw) or the diffusion through the core/corona of micelles. A dialysis tubing cellulose membrane (which is supposed to be permeable for free pyrene) with P104 micelles containing PyC18 was left in a GUVs suspension during one week. The emission spectra of this GUVs suspension showed a very low signal allowing concluding that exit–entry of PyC18 into GUVs suspension (25 mg mL−1) has to be experimentally discarded. Some results are also obtained for PyC18 in water. Then, the emission spectra of the liposomes suspensions in contact with the bag containing P104 micelles with PyC18 and water with PyC18 do not present any appearance of a specific fluorescent peak. It is then shown that the exchange of the PyC18 probe by exit–entry of the micelles to the liposomes is not crucial in the exchange dynamics between micelles and liposomes.
Furthermore, a variation on the chain-length of the pyrene derivative would affect the first order mechanism that presents a linear velocity rate independent of the liposomes. This first order process has been previously shown to be sensitive to the structure of the probe in Triton X-100 micelles.59 Various pyrene derivatives, i.e. 1-octylpyrene PyC8, 1-dodecylpyrene PyC12 and PyC18, were tested and caused an increase on the first-order process rate with the decrease of the size of the probe, directly related with the decrease on the hydrophobicity of the molecule.59,63 So one would also expect an interesting variation of, mainly, the first order mechanism as a function of pyrene derivative chain-length in our study system.
Finally, the results allow proposing an interaction mechanism between P104 triblock copolymer micelles and liposomes suspensions dominated by collective dynamics that could involve the following steps: collision of a micelle and a liposome, adhesion of micelles on the lipidic membrane, transfer of solute inside the lipidic membrane of the liposome followed by a possible separation (Fig. 11). The vectorization dynamics of hydrophobic drugs through vectors such as amphiphilic block copolymers can be followed, studied and quantified by using this fluorescence technique.
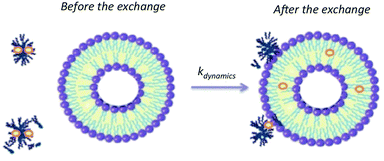 | ||
| Fig. 11 Schematic representation of the exchange mechanism between P104 micelles containing a fluorescent probe (PyC18) and liposomes. | ||
4. Conclusions
P104 triblock copolymer micellization was firstly studied in water and in a liposomes suspension in order to determine P104 critical micellar concentration at 37 °C. The exchange dynamics between amphiphilic block copolymers and liposomes suspensions were successfully monitored by using a hydrophobic fluorescent probe that can be exchanged via different mechanisms. The evolution of the emission spectra as a function of time was treated in terms of the ratio given by the values obtained from the integration of the excimer intensity peak (440 nm < IEX < 550 nm) and the integration of the monomer intensity peak (366 nm < IMON < 425 nm). It was found that the decrease of the ratio IEX/IMON with time follows a single-exponential decay after mixing liposomes suspension with P104 micelles containing PyC18, from which it is possible to quantify the exchange time constant.Finally, it was demonstrated that the exchange dynamics between amphiphilic block copolymer micelles and liposomes is a collective mechanism that follows a first order mechanism with linear velocity rate independent of the liposomes concentration and a second order mechanism with linear dependence of kdynamics as a function of the liposome concentration. It presumably involves the collision of a micelle and a liposome, the adhesion of micelles on the lipidic membrane and the transfer of solute inside this lipidic membrane followed by a possible separation.
Conflicts of interest
There are no conflicts to declare.Acknowledgements
Dr J. F. A. Soltero acknowledges to CONACYT for financial support through project No. 223549. L. M. Bravo-Anaya acknowledges the scholarship granted by CONACYT, the Bourse Eiffel scholarship granted by French Government, financial support granted by G. Bravo-Galván and Dr Marguerite Rinaudo for helpful scientific discussions. We acknowledge Raoul Zana from Institut Charles Sadron for the single photon counting spectrometer donation. We acknowledge Dr Hélène Galliard for her valuable help with conducting the experiments and Mohamed Karrouch, Eric Faivre, Frédéric Hugenell and Didier Bleses for their technical support. We acknowledge Ana Medeiros for her help with performing Confocal Microscopy observations. The Laboratoire Rhéologie et Procédés is part of the LabEx Tec 21 (Investissements d'Avenir – grant agreement no. ANR-11-LABX-0030) and of the PolyNat Carnot Institut (Investissements d'Avenir – grant agreement no. ANR-11-CARN-030-01).Notes and references
- E. Soussan, S. Cassel, M. Blanzat and I. Rico-Lattes, Angew. Chem., Int. Ed., 2009, 48, 274–288 CrossRef CAS PubMed.
- Y. Liu, T.-S. Niu, L. Zhang and J.-S. Yang, Natural Science, 2010, 2, 41–48 CrossRef CAS.
- P. Ramos-Cabrer and F. Campos, Int. J. Nanomed., 2013, 8, 951–960 CrossRef PubMed.
- R. Waehler, S. J. Russell and D. T. Curiel, Nat. Rev. Genet., 2007, 8, 573–587 CrossRef CAS PubMed.
- M. Morille, C. Passirani, A. Vonarbourg, A. Clavreul and J.-P. Benoit, Biomaterials, 2008, 29, 3477–3496 CrossRef CAS PubMed.
- S. Ganta, H. Devalapally, A. Shahiwala and M. Amiji, J. Controlled Release, 2008, 126, 187–204 CrossRef CAS PubMed.
- D. E. Owens and N. A. Peppas, Int. J. Pharm., 2006, 307, 93–102 CrossRef CAS PubMed.
- H. Laroui, D. S. Wilson, G. Dalmasso, K. Salait, N. Murthy, S. V. Sitaraman and D. Merlin, Am. J. Physiol.: Gastrointest. Liver Physiol., 2011, 300(3), G371–G383 CrossRef CAS PubMed.
- M. Murillo, S. Espuelas, S. Prior, A. I. Vitas, M. J. Renedo, M. M. Goñi, J. M. Irache and C. Gamazo, Rev. Med. Univ. Navarra, 2001, 45, 19–34 CAS.
- C. Capasso, M. Hirvinen and V. Cerullo, Biomedicines, 2013, 1, 3–16 CrossRef PubMed.
- M. Malmsten, Surfactants and Polymers in Drug Delivery, Marcel Dekker, New York, 2002, vol. 122, pp. 10–49 Search PubMed.
- K. K. Jain Drug Delivery Systems-An Overview, Drug Delivery Systems, vol. 437 of the Series Methods in Molecular Biology, pp. 1–50, 2008 Search PubMed.
- C. M. Pitsillides, E. K. Joe, X. Wei, R. R. Anderson and C.-P. Lin, Biophys. J., 2003, 84, 4023–4032 CrossRef CAS PubMed.
- D. S. Kohane, Biotechnol. Bioeng., 2007, 96, 203–209 CrossRef CAS PubMed.
- M. Hamidi, M.-A. Shahbazi and K. Rostamizadeh, Macromol. Biosci., 2012, 12, 144–164 CrossRef CAS PubMed.
- L. He, L. Yang, Z. R. Zhang, T. Gong, L. Deng, Z. Gu and X. Sun, Nanotechnology, 2009, 20, 455102 CrossRef PubMed.
- G. Gaucher, M.-H. Dufresne, V. P. Sant, N. Kang, D. Maysinger and J. C. Leroux, J. Controlled Release, 2005, 109, 169–188 CrossRef CAS PubMed.
- G. Pembouong, N. Morellet, T. Kral, M. Hof, D. Scherman, M.-F. Bureau and N. Mignet, J. Controlled Release, 2011, 151, 57–64 CrossRef CAS PubMed.
- C. Allen, D. Maysinger and A. Eisenberg, Colloids Surf., B, 1999, 16, 3–27 CrossRef CAS.
- K. Letchford and H. Burt, Eur. J. Pharm. Biopharm., 2007, 65, 259–269 CrossRef CAS PubMed.
- S. Sakuma, M. Hayashi and M. Akashi, Adv. Drug Delivery Rev., 2001, 47, 21–37 CrossRef CAS PubMed.
- S. Geresh, G. Y. Gdalevsky, I. Gilboa, J. Voorspoels, J. P. Remon and J. Kost, J. Controlled Release, 2004, 94, 391–399 CrossRef CAS PubMed.
- S. V. Vinogradov, T. K. Bronich and A. V. Kabanov, Adv. Drug Delivery Rev., 2002, 54, 135–147 CrossRef CAS PubMed.
- J.-H. Ryu, R. T. Chacko, S. Jiwpanich, S. Bickerton, R. P. Babu and S. Thayumanavan, J. Am. Chem. Soc., 2010, 132(48), 17227–17235 CrossRef CAS PubMed.
- N. A. Peppas, Curr. Opin. Colloid Interface Sci., 1997, 2, 531–537 CrossRef CAS.
- M. L. Adams, A. Lavasanifar and G. S. Kwo, J. Pharm. Sci., 2003, 92, 1343–1355 CrossRef CAS PubMed.
- S. Zamani and S. Khoee, Polymer, 2012, 53, 5723–5736 CrossRef CAS.
- K. Y. Oh, T. K. Bronich and A. V. Kabanov, J. Controlled Release, 2004, 94(2–3), 411–422 CrossRef CAS PubMed.
- X. Zhao and P. Liu, ACS Appl. Mater. Interfaces, 2015, 7(1), 166–174 CrossRef CAS PubMed.
- M. Morell and J. Puiggalí, Polymers, 2013, 5(1), 188–224 CrossRef.
- A. V. Kabanov, E. V. Batrakova and V. Y. Alakhov, J. Controlled Release, 2002, 82(2–3), 189–212 CrossRef CAS PubMed.
- T.-I. Kim, H. J. Seo, J. S. Choi, H.-S. Jang, J. U. Baek, K. Kim and J.-S. Park, Biomacromolecules, 2004, 5(6), 2487–2492 CrossRef CAS PubMed.
- V. Kabanov, E. V. Batrakova and V. Y. Alakhov, Adv. Drug Delivery Rev., 2002, 54(5), 759–779 CrossRef PubMed.
- A. Akbarzadeh, R. Rezaei-Sadabady, S. Davaran, S. W. Joo, N. Zarghami, Y. Hanifehpour, M. Samiei, M. Kouhi and K. Nejati-Koshki, Nanoscale Res. Lett., 2013, 8, 102 CrossRef PubMed.
- D. Papahadjopoulos and H. K. Kimelberg, Prog. Surf. Sci., 1973, 4, 141–232 CrossRef.
- T. Pereira de Souza, P. Stano and P. L. Luisi, ChemBioChem, 2009, 10, 1056–1063 CrossRef CAS PubMed.
- F. Szoka and D. Papahadjopoulus, Proc. Natl. Acad. Sci. U. S. A., 1978, 75, 4194–4198 CrossRef CAS.
- P. Walde, K. Cosentino, H. Engel and P. Stanod, ChemBioChem, 2010, 11(7), 848–865 CrossRef CAS PubMed.
- P. Couvreur, Ann. Pharm. Fr., 2001, 59(4), 232–238 CAS.
- S. Laurent, D. Forge, M. Port, A. Roch, C. Robic, L. V. Elst and R. N. Muller, Chem. Rev., 2008, 108, 2064–2110 CrossRef CAS PubMed.
- A. Llevot and D. Astruc, Chem. Soc. Rev., 2012, 41, 242–257 RSC.
- M. Mohs and J. M. Provenzale, Neuroimaging Clin. N. Am., 2010, 20, 283–292 CrossRef PubMed.
- X. Huang and C. S. Brazel, J. Controlled Release, 2001, 73, 121–136 CrossRef CAS PubMed.
- D. Han, X. Tong and Y. Zhao, Macromolecules, 2011, 44(3), 437–439 CrossRef CAS.
- Z. Peg, H.-W. Chen, H. J. Paholak and Du-X. Sun, J. Tumor, 2013, 1(2), 7–15 Search PubMed.
- E. V. Batrakova and A. V. Kabanov, J. Controlled Release, 2008, 130(2), 98–106 CrossRef CAS PubMed.
- F. Meng, Z. Zhong and J. Feijen, Biomacromolecules, 2009, 10, 197–208 CrossRef CAS PubMed.
- Y. Rharbi, Macromolecules, 2012, 45, 9823–9826 CrossRef CAS.
- R. Koynova and M. Caffrey, Biochim. Biophys. Acta, 1998, 1376, 91–145 CrossRef CAS.
- E. Lessner, M. Teubner and M. Kahlweit, J. Phys. Chem., 1981, 85, 3167–3175 CrossRef CAS.
- G. Fritz, G. Scherf and O. Glatter, J. Phys. Chem., 2000, 104, 3463 CrossRef CAS.
- G. G. Warr and F. Grieser, J. Chem. Soc., Faraday Trans., 1986, 1, 1813–1828 RSC.
- P. Alexandridis and T. A. Hatton, Colloids Surf., A, 1995, 96, 1–46 CrossRef CAS.
- T. Sakai and P. Alexandridis, Nanotechnology, 2005, 16, S344–S353 CrossRef PubMed.
- S. T. Crooke, Antisense Drug Technology: Principles, Strategies, and Applications, CRC Press, 2nd edn, 2007 Search PubMed.
- P. L. Luisi and P. Walde, Giant Vesicles in Perspective in Supramolecular Chemistry, John Wiley & Sons, Chichester, U.K., 2000, vol. 6 Search PubMed.
- A. Petelska and Z. Figaszewski, Biophys. J., 2000, 78, 812–817 CrossRef CAS PubMed.
- F. Quemeneur, Relationship between mechanical parameters and behaviour under external stresses in lipid vesicles with modified membranes. Data analysis, statistics and probability, PhD thesis, Université de Grenoble, 2010.
- Y. Rharbi, M. Li, M. A. Winnik and K. G. Hahn, J. Am. Chem. Soc., 2000, 122, 6242–6251 CrossRef CAS.
- Y. Rharbi, N. Bechthold, K. Landfester, A. Salzman and M. A. Winnik, Langmuir, 2003, 19, 10–17 CrossRef CAS.
- Y. Rharbi and M. A. Winnik, Langmuir, 1999, 15, 4697–4700 CrossRef CAS.
- Y. Rharbi, V. Kitaev and M. A. Winnik, Langmuir, 1999, 15, 2259–2266 CrossRef CAS.
- Y. Rharbi and M. A. Winnik, J. Phys. Chem. B, 2003, 107, 1491–1501 CrossRef CAS.
Footnote |
| † Electronic supplementary information (ESI) available. See DOI: 10.1039/c8ra08903e |
| This journal is © The Royal Society of Chemistry 2018 |

