 Open Access Article
Chemo-photothermal effects of doxorubicin/silica–carbon hollow spheres on liver cancer†
Ying-Chi Chen a,
Wen-Tai Chiu*ab,
Chin Changc,
Ping-Ching Wuabe,
Ting-Yuan Tuabd,
Hong-Ping Lin
 *cd and
Hsien-Chang Chang
 *abd
*abd
aDepartment of Biomedical Engineering, National Cheng Kung University, Tainan, Taiwan. E-mail: wtchiu@mail.ncku.edu.tw; hcchang@mail.ncku.edu.tw
bMedical Device Innovation Center, National Cheng Kung University, Tainan, Taiwan
cDepartment of Chemistry, National Cheng Kung University, Tainan, Taiwan. E-mail: hplin@mail.ncku.edu.tw
dCenter for Micro/Nano Science and Technology Research, National Cheng Kung University, Tainan, Taiwan
eInstitute of Oral Medicine, National Cheng Kung University, Tainan, Taiwan
First published on 31st October 2018
Abstract
Chemo-photothermal therapy, which exhibits synergistic effects, is more effective than either of the treatments administered alone because of its superior ability to target and destroy cancer cells. An anti-cancer compound (doxorubicin, DOX) was embedded in silica–carbon hollow spheres (SCHSs) using heat and vacuum to integrate multi-therapeutic effects onto one platform and subsequently improve the anti-cancer efficacy. SCHSs were synthesized via a surface activation method and its highly porous surface enhanced the loading content of the desired drug. SCHSs are an infrared photothermal material that can destroy targeted cells by heating under near-infrared (NIR) laser illumination at 808 nm. NIR laser illumination also enhances DOX release from SCHSs to increase the anti-cancer efficiency of DOX–loaded SCHSs (DOX–SCHSs) in both two-dimensional and three-dimensional multicellular tumor spheroid cultures. SCHSs exhibited high heat-generating ability and pH-responsive drug delivery. In conclusion, this study demonstrated that DOX–SCHSs represent a potential tool for chemo-photothermal therapy due to its photothermal effects. Thus, our findings imply that the high cancer cell killing efficiency of DOX–SCHSs induced by NIR illumination can be used for the treatment of tumors.
Introduction
Hepatocellular carcinoma (HCC) is the fifth-most common type of cancer and second leading cause of cancer death in both sexes worldwide.1–3 Notable progress has been made in the development of liver cancer therapies, including advances in surgery, chemotherapy, thermal therapy, liver transplantation, and biotherapy. However, HCC-related mortality remains high because of the high rate of tumor recurrence and metastasis.4,5 Chemotherapy, which is the most common type of cancer treatment,6 involves the application of anticancer drugs to destroy cancer cells. The disadvantages of chemotherapeutic drugs are nonspecific damage of normal cells, poor drug delivery, and the development of drug resistance, which results in systemic side effects and failed treatments.7–9Photothermal therapy (PTT) has recently emerged as a feasible alternative approach to treat cancer.9–12 PTT can destroy tumor cells by inducing hyperthermia via near-infrared (NIR, 700–2500 nm) light illumination. There are two biological windows of wavelengths in the NIR region. The first NIR optical tissue window is 650–900 nm and the second window is 1000–1350 nm.13,14 NIR light-induced PTT has gained attention recently because of the biological safety of the NIR light that is used to deliver heat directly into the tumor; this makes it a non-invasive and low-risk approach to treat cancer.15,16
Previous studies have illustrated the mechanism of chemo-resistance in liver cancer.17,18 Doxorubicin (DOX) is widely used in systemic chemotherapy for liver cancer.19,20 However, this chemotherapeutic agent is only capable to reduce the size of a tumor following short-term treatment. Nano-scaled drug delivery systems have been reported to improve DOX-dependent targeting and binding efficacy to cancer cells and decrease non-specific toxicity. Notably, recent developments have yielded nanostructured materials that exhibit extraordinary biological properties, such as high surface area, thermal effects, and stable hollow construction. Examples include carbon,21–23 gold,10,24,25 and silica nanomaterials.26–29 Mesoporous silica nanoparticles have been extensively used as drug delivery agents because they exhibit several advantages, including a homogeneous structure, uniform pore size, high surface area, large loading capacity, biocompatibility, and easy chemical surface modification.30–32 Mesoporous silica nanoparticles can be taken up into cells by endocytosis or fluid phase pinocytosis because silica materials have a high affinity with lipid bilayers.33
It may be possible to maximize the synergistic effects and minimize the side effects by simultaneously delivering the chemotherapeutic drugs and heat to the tumor site. To achieve this goal, the efficacy of anti-cancer treatment can be improved by combining chemotherapy and photothermal therapy.34
Previously, we demonstrated that stable and highly concentrated aqueous dispersions of SCHSs can be an ideal NIR-light absorbing agent for cancer therapy.35 Therefore, producing heat by absorbing light can simultaneously improve tumor ablation and enhance chemotherapeutic effects. Moreover, we also used concanavalin A (ConA), a lectin isolated from the seed of Canavalia ensiformis, to enhance the binding capacity of SCHSs to glycoprotein receptors, which are aberrantly overexpressed in hepatoma cells. Our results indicated a higher binding capacity of ConA–SCHSs on hepatoma cells compared to normal cells.35
Herein, we selected SCHSs, which present many different negatively charged silica species that can attract positively charged anti-cancer drugs via electrostatic interactions.36 Multifunctional SCHSs were designed to obtain high drug loading capacity, pH-responsive properties, and superior photothermal effects. Our study reports the development of an efficient agent, DOX–SCHSs, which combine NIR photothermal therapy and DOX-mediated chemotherapy to treat liver cancer cells in vitro.
Materials and methods
Chemicals
High-glucose Dulbecco's Modified Eagle's Medium (DMEM), phosphate buffered saline (PBS), penicillin–streptomycin, and trypsin were purchased from Caisson (Smithfield, VA, USA). Hoechst 33342, calcein AM, ethidium homodimer-1 (EthD-1), and paraformaldehyde were purchased from Invitrogen (Carlsbad, CA, USA). Paraformaldehyde was purchased from Alfa Aesar (Haverhill, MA, USA).Synthesis of silica–carbon hollow spheres
A gel solution of silica–gelatin–PMMA beads was formed by dissolving 0.15 g gelatin in 25 mL of a PMMA bead solution (∼300 nm in diameter) under stirring for 1 h and then adding acidified silicate solution (pH 4.0). The acidified silicate solution was prepared by mixing 20 g of a 3 wt% sodium silicate solution and 20 g of 0.15 M H2SO4, adjusting the pH value to around 4.0, and aging for 5 min. The gel solution of the silica–gelatin–PMMA beads was further stirred for a few hours, and then hydrothermally treated at 100 °C for 1 day. The PMMA beads@silica were obtained via filtration and drying of the gel solution. Next, carbon–silica hollow spheres were obtained after pyrolysis of the dried PMMA beads@silica at 800 °C for 1 h under a helium atmosphere (Fig. S1F†).Characterization of SCHSs
The morphology of the SCHSs was analyzed by scanning electron microscopy (SEM; JSM-6700F, JEOL) at an acceleration voltage of 10 kV. Transmission electron microscopy (TEM; JEM-2100F, JEOF) images were taken at an acceleration voltage of 80 kV. The carbon content and thermal stability of the SCHSs were characterized via thermogravimetric analysis (TGA, TA Q50) at a heating rate of 30°C min−1 from 100 °C to 800 °C under an air atmosphere. The size distribution and zeta potential of SCHSs in aqueous solutions were measured based on dynamic light scattering (DLS; Delsa™Nano, Beckman Coulter). The UV-Vis-NIR absorption spectra were performed on HITACHI U-0080D spectrophotometer.Infrared photothermal behavior of SCHSs in solution
The rise in temperature induced by illumination with an 808 nm NIR laser (0.75 W cm−2) for 10 min was measured by monitoring the temperature of SCHSs at different concentrations (100–1500 μg mL−1) that were dispersed in DMEM containing 10% of fetal bovine serum (FBS; GIBCO). Changes in temperature were recorded at 1 min intervals using a thermocouple immersed in the solution. The temperature of DMEM solutions that contained 10% FBS without SCHSs and subjected to the same laser illumination was taken as a control.Preparation of DOX–SCHSs
As shown in Fig. S7,† DOX–loaded SCHSs was constructed by a modified vacuum nano-casting route based on previously reports.37,38 Sonication was performed to avoid aggregation of SCHSs before each experiment. SCHSs solutions were mixed with different concentrations of DOX, and then heat and vacuum were applied to load the DOX into the SCHSs. The resulting DOX–SCHSs were vacuum-dried at 55 °C for 24 h and stored at −20 °C before further use.DOX encapsulation efficiency (EE) was calculated as follows: encapsulation efficiency (%) = (mass of drug in SCHSs/total mass of drug used for formation) × 100%
Preparation of DOX–SCHSs–ConA
A fresh preparation of the 10![[thin space (1/6-em)]](https://www.rsc.org/images/entities/char_2009.gif) :
:![[thin space (1/6-em)]](https://www.rsc.org/images/entities/char_2009.gif) 100 μg mL−1 DOX–SCHSs solution was mixed with 250 μg mL−1 ConA at room temperature for 12 h with rotation. The DOX–SCHSs–ConA (10
100 μg mL−1 DOX–SCHSs solution was mixed with 250 μg mL−1 ConA at room temperature for 12 h with rotation. The DOX–SCHSs–ConA (10![[thin space (1/6-em)]](https://www.rsc.org/images/entities/char_2009.gif) :
:![[thin space (1/6-em)]](https://www.rsc.org/images/entities/char_2009.gif) 100
100![[thin space (1/6-em)]](https://www.rsc.org/images/entities/char_2009.gif) :
:![[thin space (1/6-em)]](https://www.rsc.org/images/entities/char_2009.gif) 250 μg mL−1) complexes were obtained after centrifugation and washing for three times with PBS.
250 μg mL−1) complexes were obtained after centrifugation and washing for three times with PBS.
Drug release of DOX–SCHSs
Stored DOX–SCHSs were subjected to centrifugation and washing for three times with distilled water before the release process. The DOX–SCHSs were dispersed in a 1 mL PBS solution and rotated at 6 rpm for 24 h, and then were centrifuged at 18![[thin space (1/6-em)]](https://www.rsc.org/images/entities/char_2009.gif) 000 rpm for 5 min. The supernatant was collected to quantify the released DOX and the pellet was re-suspended in PBS. The drug-releasing process was monitored at different time intervals. To determine the pH-sensitive release of DOX–SCHSs, drug release experiments were carried out in PBS with various pH values of 5.5, 6.5, 7.4, and 8.5. The encapsulation efficiency and concentration of DOX in the solution was measured using a SpectraMax M5 plate reader (Molecular Devices, Sunnyvale, CA) with excitation and emission wavelengths of 480 nm and 580 nm, respectively. The fluorescence intensity was converted to a concentration using a calibration curve.
000 rpm for 5 min. The supernatant was collected to quantify the released DOX and the pellet was re-suspended in PBS. The drug-releasing process was monitored at different time intervals. To determine the pH-sensitive release of DOX–SCHSs, drug release experiments were carried out in PBS with various pH values of 5.5, 6.5, 7.4, and 8.5. The encapsulation efficiency and concentration of DOX in the solution was measured using a SpectraMax M5 plate reader (Molecular Devices, Sunnyvale, CA) with excitation and emission wavelengths of 480 nm and 580 nm, respectively. The fluorescence intensity was converted to a concentration using a calibration curve.
Cell culture
HCC cell lines, human liver cancer (Huh-7) cells and mouse liver cancer (ML-1) cells were purchased from the JCRB cell bank (JCRB0403) and kind providing from Dr Huan-Yao Lei (National Cheng Kung University, Taiwan),39 respectively. ML-1 and Huh-7 cell lines were maintained in DMEM (GIBCO, Big Cabin, OK, USA) which contained high glucose and was supplemented with 10% FBS, penicillin (100 IU mL−1), and streptomycin (100 μg mL−1). Cell lines were grown in the presence of 5% CO2 at 37 °C in a humidified incubator.Generation of MCTSs
Multicellular tumor spheroids (MCTSs) of Huh-7 liver cancer cells were generated using microwells that were fabricated via direct CO2 laser ablation (GCC LaserPro, Mercury II), as previously described.40 In short, microwells were patterned on a 12-well plate and sterilized by incubating them in 99% ethanol for at least 8 h and followed by two PBS washes prior to use. Surfactant was passivated on microwells for 30 min at room temperature to prevent cell adhesion. Three-dimensional (3D) MCTSs can be generated by forced aggregation of cells (around 100 cells) in each microwell for 5 days, grown in the presence of 5% CO2 at 37 °C in a humidified incubator.Cellular uptake of DOX–SCHSs
ML-1 and Huh-7 cells were seeded into 24-well plates at a density of 5 × 10⁴ and incubated with a control medium and DOX–SCHSs (10![[thin space (1/6-em)]](https://www.rsc.org/images/entities/char_2009.gif) :
:![[thin space (1/6-em)]](https://www.rsc.org/images/entities/char_2009.gif) 100 μg mL−1) after overnight culturing. The medium was removed and the cells were washed three times using the DMEM medium after 6, 12, 18, and 24 h of incubation. Fluorescence images were captured on an inverted fluorescence microscope (IX71, Olympus, Tokyo, Japan) under a blue light excitation.
100 μg mL−1) after overnight culturing. The medium was removed and the cells were washed three times using the DMEM medium after 6, 12, 18, and 24 h of incubation. Fluorescence images were captured on an inverted fluorescence microscope (IX71, Olympus, Tokyo, Japan) under a blue light excitation.
Cell cytotoxicity assay
ML-1 and Huh-7 cells were seeded into 24-well plates overnight at 5 × 10⁴ and 7 × 10⁴ cells per well, respectively. Cells were treated with different concentrations of DOX (0.01–1 μg mL−1), SCHSs (100–500 μg mL−1), or DOX–SCHSs (10![[thin space (1/6-em)]](https://www.rsc.org/images/entities/char_2009.gif) :
:![[thin space (1/6-em)]](https://www.rsc.org/images/entities/char_2009.gif) 100–50
100–50![[thin space (1/6-em)]](https://www.rsc.org/images/entities/char_2009.gif) :
:![[thin space (1/6-em)]](https://www.rsc.org/images/entities/char_2009.gif) 500 μg mL−1) for 24 h. Hoechst 33342 was used to determine the relative cell number of treated and untreated cells.41
500 μg mL−1) for 24 h. Hoechst 33342 was used to determine the relative cell number of treated and untreated cells.41
Cell viability assay for chemo-photothermal therapy
For cell viability analysis, ML-1 and Huh-7 cells were seeded in 24-well plates and grown overnight as a monolayer. Similarly, Huh-7 MCTSs were formed in a 12-well plate for 5 days prior to the application of chemo-photothermal therapy. Then, both the cells and MCTSs were incubated with different contents of the SCHSs, free DOX, DOX–SCHSs (10![[thin space (1/6-em)]](https://www.rsc.org/images/entities/char_2009.gif) :
:![[thin space (1/6-em)]](https://www.rsc.org/images/entities/char_2009.gif) 100 μg mL−1), SCHSs–ConA (100
100 μg mL−1), SCHSs–ConA (100![[thin space (1/6-em)]](https://www.rsc.org/images/entities/char_2009.gif) :
:![[thin space (1/6-em)]](https://www.rsc.org/images/entities/char_2009.gif) 250 μg mL−1), and DOX–SCHSs–ConA (10
250 μg mL−1), and DOX–SCHSs–ConA (10![[thin space (1/6-em)]](https://www.rsc.org/images/entities/char_2009.gif) :
:![[thin space (1/6-em)]](https://www.rsc.org/images/entities/char_2009.gif) 100
100![[thin space (1/6-em)]](https://www.rsc.org/images/entities/char_2009.gif) :
:![[thin space (1/6-em)]](https://www.rsc.org/images/entities/char_2009.gif) 250 μg mL−1) with or without 808 nm NIR illumination (0.75 W cm−2, 3 min). At 24 h post illumination, each group of cells was washed with the DMEM medium and stained with 2 μg mL−1 Hoechst 33342 (nucleus), 1 μM calcein AM (live cells), and 1 μM EthD-1 (dead cells). The cell viability in the laser spot area was calculated using fluorescence microscopy.
250 μg mL−1) with or without 808 nm NIR illumination (0.75 W cm−2, 3 min). At 24 h post illumination, each group of cells was washed with the DMEM medium and stained with 2 μg mL−1 Hoechst 33342 (nucleus), 1 μM calcein AM (live cells), and 1 μM EthD-1 (dead cells). The cell viability in the laser spot area was calculated using fluorescence microscopy.
Statistical analysis
All experimental values are expressed as mean ± SEM (standard error of the mean) in each experiment. Student's t-test was used for statistical analyses. A p-value < 0.05 was considered to denote a significant difference (*: p < 0.05; **: p < 0.01; ***: p < 0.001).Results
Physical properties of silica–carbon hollow spheres
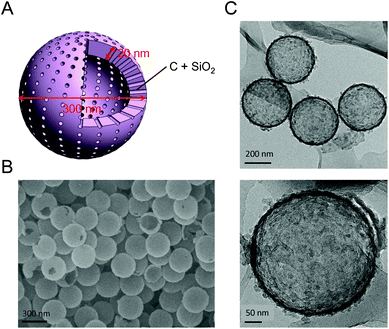
The morphology, structure, and dispersion of SCHSs were analyzed via SEM, TEM, DLS, and N2 adsorption–desorption isotherm assessments. Fig. 1A shows a schematic diagram of the SCHSs with a hollow structure interior. SEM and TEM images show the uniformity of the SCHSs, and the rare broken spheres demonstrate the hollow interiors (Fig. 1B and C). The mean hydrodynamic size of the SCHSs was ∼300 nm, as measured by DLS, and the polydispersity index (PDI) of the SCHSs is 0.216, which indicates a narrow size distribution (Fig. S2A†). The zeta potential of the SCHSs' surface was approximately −88.94 mV, which indicates a strong negative charge on the surface (Fig. S2B†). The UV-Vis NIR spectra of SCHSs in distilled water was shown in Fig. S2C.† To examine the composition on the surface of SCHSs, the energy dispersive X-ray spectra of the spheres were determined by generating chemical maps. The corresponding EDX elemental maps of carbon (C), silicon (Si), and oxygen (O) elements clearly show that the distribution of the elements matches the position of the SCHSs on TEM images (Fig. S1A and S1B†). The N2 adsorption–desorption isotherm indicates that the SCHSs are porous (Fig. S1C†), and the average surface area of the SCHSs is 150 m2 g−1. Barrett–Joyner–Halenda (BJH) analyses indicate that the average pore size of the SCHSs is around 11.48 nm (Fig. S1D†). Moreover, the carbon black characteristic was further analyzed by X-ray diffraction (XRD). The XRD pattern of such hollow spheres is shown in Fig. S1E.† The (002) and (101) peaks can be obviously seen, corroborating the TEM data. Thus, XRD and TEM both confirmed that the PMMA beads were transformed into carbon black during the formation of silica carbon hollow spheres.Characterization of DOX–silica–carbon hollow spheres
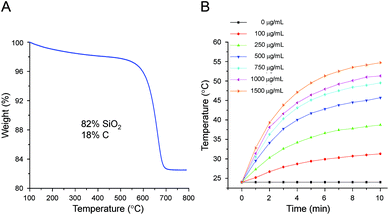
The carbon content in the SCHSs was determined using thermogravimetric analysis (TGA), as shown in Fig. 2A. The black line shows a weight loss of around 18% between 450 °C and 700 °C, which resulted from carbon decomposition, whereas the blue line is the corresponding derivative curve showing the variation in weight with temperature. The high-temperature carbon combustion indicates that the SCHSs are thermally stable. Accordingly, the SiO2 content in the SCHSs is estimated to be about 82 wt% and the C/SiO2 weight ratio in the SCHSs is ∼0.22.A concentration-dependent increase in temperature was determined using an 808 nm NIR laser at a power density of 0.75 W cm−2. As shown in Fig. 2B, 150 μL of a SCHSs solution at a series of concentrations (100, 250, 500, 750, 1000, 1500 μg mL−1) were assessed. There was no temperature change in the SCHSs-free medium, whereas the increase in temperature of the SCHSs solution depends on time and concentration. Specifically, the temperature reached 42 °C within 3 min and increased from 24.0 °C to 54.7 °C within 10 min for the 1500 μg mL−1 SCHSs solution. This result indicates that the SCHSs exhibited high photothermal capability, confirming that SCHSs could be used as photothermal ablation agents.
DOX encapsulation and release in vitro
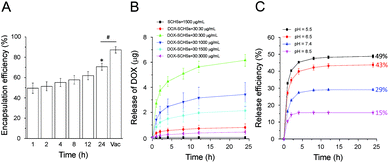
As shown in Fig. 3A, the DOX encapsulation efficiency (EE) of SCHSs was measured at a fixed concentration of DOX–SCHSs (30![[thin space (1/6-em)]](https://www.rsc.org/images/entities/char_2009.gif) :
:![[thin space (1/6-em)]](https://www.rsc.org/images/entities/char_2009.gif) 1500 μg mL−1). The EE values are dependent on the mixing time (1–24 h) and ranged from 49% to 70%. The DOX encapsulation rate reached a maximum value when mixed for 24 h. To improve the EE of DOX in SCHSs, a vacuum drying process was used. The results show that the DOX EE was further elevated to 87%. Therefore, we chose a combination of heat and vacuum treatment as the optimal encapsulation method for the physical conjugation of SCHSs and DOX in subsequent experiments.
1500 μg mL−1). The EE values are dependent on the mixing time (1–24 h) and ranged from 49% to 70%. The DOX encapsulation rate reached a maximum value when mixed for 24 h. To improve the EE of DOX in SCHSs, a vacuum drying process was used. The results show that the DOX EE was further elevated to 87%. Therefore, we chose a combination of heat and vacuum treatment as the optimal encapsulation method for the physical conjugation of SCHSs and DOX in subsequent experiments.
The ratio of DOX-to-SCHSs affected the EE and release of DOX from SCHSs. The EE of DOX loaded into SCHSs is shown in Fig. S3A and S3B.† The ratio of DOX-to-SCHSs and concentration of DOX significantly influences the EE, which increased with both the amount of DOX and SCHSs. The SCHSs that contained DOX at a ratio of 30![[thin space (1/6-em)]](https://www.rsc.org/images/entities/char_2009.gif) :
:![[thin space (1/6-em)]](https://www.rsc.org/images/entities/char_2009.gif) 3000 (DOX–SCHSs) showed the highest EE of about 99%. We determined that for a maximal encapsulation of DOX, the optimal ratio of DOX-to-SCHSs was 30
3000 (DOX–SCHSs) showed the highest EE of about 99%. We determined that for a maximal encapsulation of DOX, the optimal ratio of DOX-to-SCHSs was 30![[thin space (1/6-em)]](https://www.rsc.org/images/entities/char_2009.gif) :
:![[thin space (1/6-em)]](https://www.rsc.org/images/entities/char_2009.gif) 1500.
1500.
As shown in Fig. 3B, the DOX release profiles of DOX–SCHSs in vitro were measured at a fixed concentration of DOX (30 μg mL−1) and concentrations of SCHSs that ranged from 30–3000 μg mL−1 in physiological PBS (pH 7.4) after incubation for 24 h in the dark. The results indicate that the cumulative drug release of DOX–SCHSs did not depend on the dose, as the 30![[thin space (1/6-em)]](https://www.rsc.org/images/entities/char_2009.gif) :
:![[thin space (1/6-em)]](https://www.rsc.org/images/entities/char_2009.gif) 300 μg mL−1 DOX–SCHSs concentration showed the highest drug release efficiency (∼6.2 μg). Therefore, we chose 30
300 μg mL−1 DOX–SCHSs concentration showed the highest drug release efficiency (∼6.2 μg). Therefore, we chose 30![[thin space (1/6-em)]](https://www.rsc.org/images/entities/char_2009.gif) :
:![[thin space (1/6-em)]](https://www.rsc.org/images/entities/char_2009.gif) 300 μg mL−1 as the optimal ratio of DOX–SCHSs to further characterize the pH-dependent release profiles of DOX. DOX–loaded SCHSs (at a ratio of 30
300 μg mL−1 as the optimal ratio of DOX–SCHSs to further characterize the pH-dependent release profiles of DOX. DOX–loaded SCHSs (at a ratio of 30![[thin space (1/6-em)]](https://www.rsc.org/images/entities/char_2009.gif) :
:![[thin space (1/6-em)]](https://www.rsc.org/images/entities/char_2009.gif) 300 μg mL−1) were incubated using solutions with different pH values (pH = 5.5, 6.5, 7.4, and 8.5; Fig. 3C). We found that a rapid and near maximal release of DOX was observed for all pH conditions within 4 h. The cumulative percentage of DOX released within 24 h only reached 15% at a pH of ∼8.5, which is much lower than that of DOX–SCHSs under more acidic conditions. By contrast, the cumulative percentage of released DOX could reach a value as high as 49% at a pH value of ∼5.5, which indicates that DOX–SCHSs have pH-responsive characteristics.
300 μg mL−1) were incubated using solutions with different pH values (pH = 5.5, 6.5, 7.4, and 8.5; Fig. 3C). We found that a rapid and near maximal release of DOX was observed for all pH conditions within 4 h. The cumulative percentage of DOX released within 24 h only reached 15% at a pH of ∼8.5, which is much lower than that of DOX–SCHSs under more acidic conditions. By contrast, the cumulative percentage of released DOX could reach a value as high as 49% at a pH value of ∼5.5, which indicates that DOX–SCHSs have pH-responsive characteristics.
In vitro cytotoxicity effects on hepatoma cells
The cytotoxicity of DOX–SCHSs is an important issue for biological applications, as ideal photothermal agents should be biocompatible and either non- or low-toxic. After incubating hepatoma cells with SCHSs, DOX, and DOX–SCHSs for 24 h, the Hoechst 33342 staining assay, which quantifies cell numbers, was applied to determine the cytotoxic effects. The results in Fig. S4 and S5† indicate that the hepatoma cell number gradually decreases as the concentrations of SCHSs, DOX, and DOX–SCHSs increase. The IC50 concentration of free DOX, which represents the concentration that kills 50% of cells, was 0.05 μg mL−1 and 0.1 μg mL−1 in ML-1 and Huh-7 cell lines, respectively. The cytotoxicity of SCHSs that were incubated with both hepatoma cell lines was found to be dose-dependent.On the other hand, the cytotoxic sensitivity of hepatoma cells to DOX was obviously lower with a higher cell density. Our data indicated that cancer cells cultured in confluent monolayers (Fig. S6†) exhibited higher resistance to DOX compared to cancer cells cultured in sparse monolayers (Fig. S4 and S5†). This phenomenon is also called confluence-dependent resistance (CDR), which is due to decreased intracellular drug accumulation.42
10![[thin space (1/6-em)]](https://www.rsc.org/images/entities/char_2009.gif) :
:![[thin space (1/6-em)]](https://www.rsc.org/images/entities/char_2009.gif) 100 μg mL−1 DOX–SCHSs was chosen as the optimal ratio in subsequent experiments based on the fact that SCHSs did not show in vitro cytotoxic effects on both hepatoma cell lines at a concentration of 100 μg mL−1. The DOX encapsulation and release in vitro were measured at different concentrations of DOX–SCHSs (10
100 μg mL−1 DOX–SCHSs was chosen as the optimal ratio in subsequent experiments based on the fact that SCHSs did not show in vitro cytotoxic effects on both hepatoma cell lines at a concentration of 100 μg mL−1. The DOX encapsulation and release in vitro were measured at different concentrations of DOX–SCHSs (10![[thin space (1/6-em)]](https://www.rsc.org/images/entities/char_2009.gif) :
:![[thin space (1/6-em)]](https://www.rsc.org/images/entities/char_2009.gif) 100–50
100–50![[thin space (1/6-em)]](https://www.rsc.org/images/entities/char_2009.gif) :
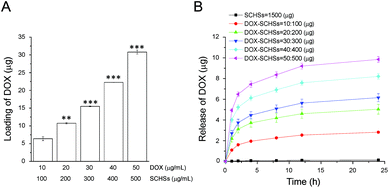
:![[thin space (1/6-em)]](https://www.rsc.org/images/entities/char_2009.gif) 500 μg mL−1) based on the optimal ratio of DOX-to-SCHSs. As shown in Fig. 4, both the DOX encapsulation efficiency of SCHSs and the cumulative drug release of DOX–SCHSs are dose-dependent. The DOX encapsulation rate ranges from 51–64% at a fixed ratio of DOX–SCHSs (10
500 μg mL−1) based on the optimal ratio of DOX-to-SCHSs. As shown in Fig. 4, both the DOX encapsulation efficiency of SCHSs and the cumulative drug release of DOX–SCHSs are dose-dependent. The DOX encapsulation rate ranges from 51–64% at a fixed ratio of DOX–SCHSs (10![[thin space (1/6-em)]](https://www.rsc.org/images/entities/char_2009.gif) :
:![[thin space (1/6-em)]](https://www.rsc.org/images/entities/char_2009.gif) 100 μg mL−1) (Fig. 4A), but the 10
100 μg mL−1) (Fig. 4A), but the 10![[thin space (1/6-em)]](https://www.rsc.org/images/entities/char_2009.gif) :
:![[thin space (1/6-em)]](https://www.rsc.org/images/entities/char_2009.gif) 100 μg mL−1 DOX–SCHSs concentration showed the highest efficiency of drug release (∼2.8 μg) (Fig. 4B).
100 μg mL−1 DOX–SCHSs concentration showed the highest efficiency of drug release (∼2.8 μg) (Fig. 4B).
The cellular uptake of DOX–SCHSs
In vitro assays were performed to further study the capacity of DOX–SCHSs for cancer ablation by focusing on the in vitro cellular uptake of DOX–SCHSs in hepatoma cells. The DOX–SCHSs (10![[thin space (1/6-em)]](https://www.rsc.org/images/entities/char_2009.gif) :
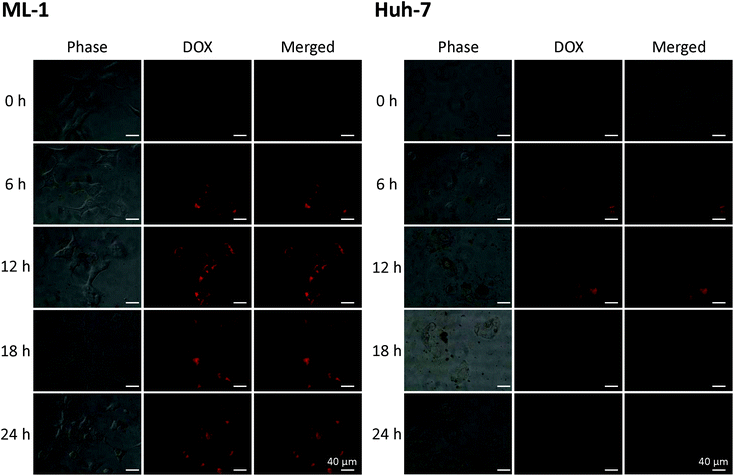
:![[thin space (1/6-em)]](https://www.rsc.org/images/entities/char_2009.gif) 100 μg mL−1) were incubated with hepatoma cells for various periods (0–24 h). The hepatoma cells are permeable to DOX, which also acts as a self-fluorescent probe. As shown in Fig. 5, the intracellular fluorescence becomes brighter with different incubation times, which indicates that the DOX is released from DOX–SCHSs. These fluorescent images show a considerable increase in fluorescence intensity as the incubation time increases, compared to the control group (0 h), but the optimal incubation time, with maximal fluorescence intensity in the hepatoma cells, is 12 h. The following experiments thus use DOX–SCHSs at a ratio of 10
100 μg mL−1) were incubated with hepatoma cells for various periods (0–24 h). The hepatoma cells are permeable to DOX, which also acts as a self-fluorescent probe. As shown in Fig. 5, the intracellular fluorescence becomes brighter with different incubation times, which indicates that the DOX is released from DOX–SCHSs. These fluorescent images show a considerable increase in fluorescence intensity as the incubation time increases, compared to the control group (0 h), but the optimal incubation time, with maximal fluorescence intensity in the hepatoma cells, is 12 h. The following experiments thus use DOX–SCHSs at a ratio of 10![[thin space (1/6-em)]](https://www.rsc.org/images/entities/char_2009.gif) :
:![[thin space (1/6-em)]](https://www.rsc.org/images/entities/char_2009.gif) 100 μg mL−1 with an incubation time of 12 h.
100 μg mL−1 with an incubation time of 12 h.
In vitro cancer cell killing by DOX–SCHSs–ConA
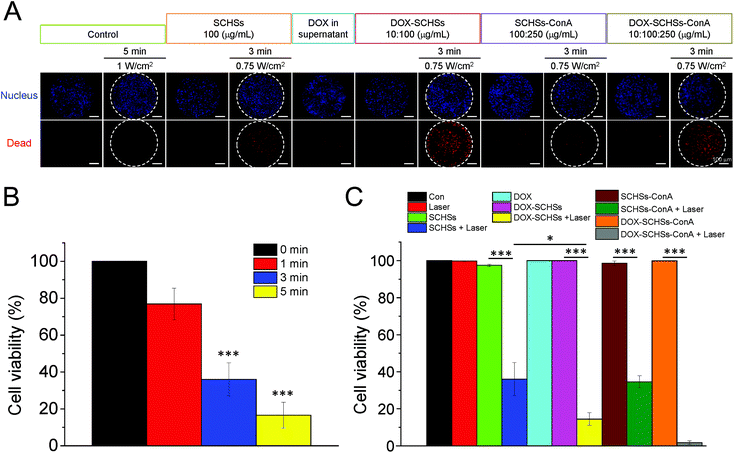
Hoechst 33342 and EthD-1 dyes were used to calculate the relative cell viability under different treatment conditions. The cell viability was determined using fluorescence microscopy. ML-1 and Huh-7 cells were illuminated with an 808 nm NIR laser at a power density of 0.75 W cm−2 for 0, 1, 3, and 5 min after the addition of SCHSs (100 μg mL−1) to study the photothermal effects. As shown in Fig. 6B, compared to the non-illuminated group, the viability of ML-1 cells revealed a time-dependent cytotoxic effect of the treatment. After a 3 min laser illumination, the cell viability was significantly reduced to 36%, while only 17% of cells remained alive after a 5 min laser illumination. These findings suggested that a combination of SCHSs and NIR laser illumination has a significant photothermal effect on tumor cells. Therefore, we chose 3 min as an optimal illumination time.Then, we examined the tumor ablation efficacy of DOX–SCHSs under an 808 nm laser illumination (0.75 W cm−2) for 3 min to evaluate the synergistic effect of the chemo-photothermal treatment. As shown in Fig. 6A, DOX–SCHSs or DOX–SCHSs–ConA that were exposed to NIR illumination (chemo-photothermal therapy) for 3 min resulted in an almost complete killing of ML-1 cells. These assessments revealed that there was a higher red fluorescence (dead cells) after chemo-photothermal therapy than after either photothermal therapy or chemotherapy alone. By contrast, no cell cytotoxicity could be detected in the groups of control cells treated with laser illumination or SCHSs alone. Moreover, there was no appreciable cell death when cells were treated with 1.00 W cm−2 NIR illumination for 5 min.
Fig. 6C shows that certain ML-1 cell groups (control group and the group treated with laser illumination) showed no significant change in cell death, indicating that the cell viability was not affected by laser illumination. Moreover, our data also showed that there was no significant difference in cell death when ML-1 cells were treated with SCHSs, DOX in supernatant, DOX–SCHSs, SCHSs–ConA, or DOX–SCHSs–ConA, when compared to control cells. By contrast, the group of ML-1 cells that was incubated with SCHSs and subjected to laser illumination showed a moderate level of cell death (64%). Compared with all other groups, the ML-1 cells that were incubated with DOX–SCHSs and subjected to 3 min NIR illumination showed a much higher level of cell death (86%). Nevertheless, the administration of DOX–SCHSs–ConA induced almost 100% cell death when exposed to a 3 min NIR illumination. The high cytotoxicity resulted from both the local heat generated via NIR illumination and the release of DOX. We note that previous studies demonstrated that PTT could also be used to increase membrane permeability, which could enhance drug penetration and accumulation in tumor cells.43–45
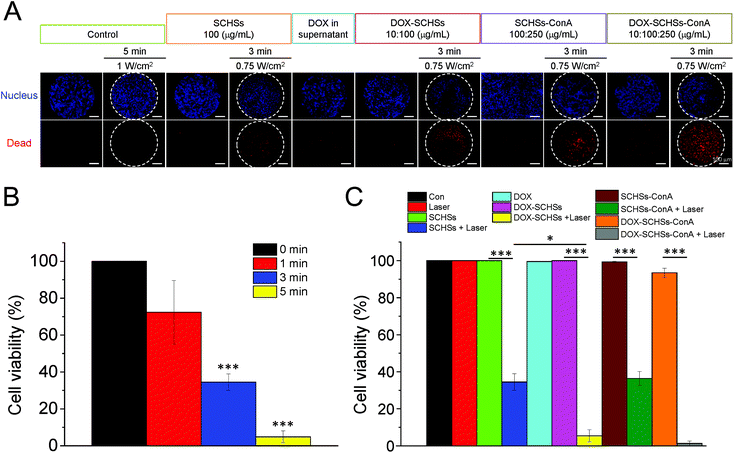
Moreover, we also confirmed the chemo-photothermal ablation capacity of DOX–SCHSs on the Huh-7 cell line (Fig. 7). Similar results were found; the DOX–SCHSs showed a much higher level of death (95%) compared to SCHSs (66%) after being subjected to a 3 min NIR illumination. Furthermore, the use of DOX–SCHSs–ConA combined with a 3 min NIR illumination induced nearly 100% cell death.
In vitro MCTS killing by DOX–SCHSs–ConA
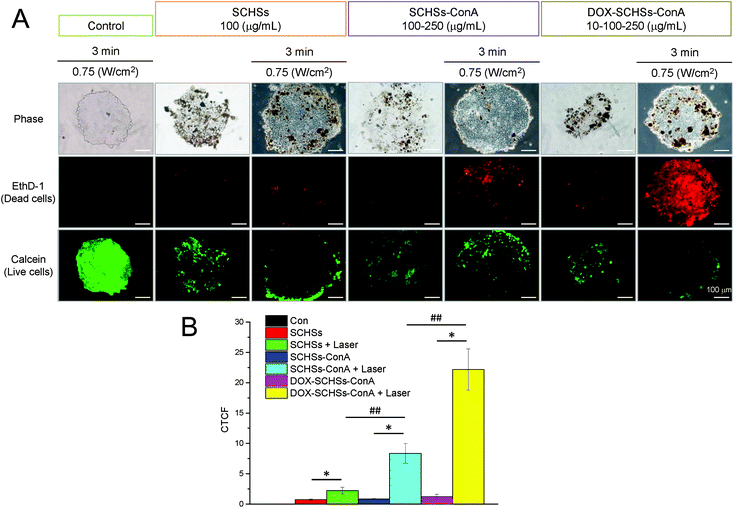
To access that DOX–SCHSs–ConA can be readily implemented to a different in vitro culture system for the similar chemo-photothermal effect, MCTS-based in vitro 3D tumor model was utilized for further investigation. Calcein and EthD-1 dyes were used to calculate the relative cell viability under different treatment conditions. The cell viability was determined using fluorescence microscopy. MCTSs of Huh-7 cells were illuminated with an 808 nm NIR laser at a power density of 0.75 W cm−2 for 3 min after incubation of DOX–SCHSs–ConA to study the synergistic effect of the chemo-photothermal treatment. As shown in Fig. 8A, these assessments revealed that there was a higher red fluorescence (dead cells) after chemo-photothermal therapy compared to photothermal therapy alone. In contrast, there was no cell cytotoxicity could be detected in the groups of control cells which was treated with laser illumination or SCHSs, respectively. Fig. 8B shows that the laser-treated group (control) showed no significant change in cell death, indicating that the cell viability was not affected by laser illumination. Moreover, our data also showed that there was no significant difference in cell death when MCTSs were treated with SCHSs, SCHSs–ConA, or DOX–SCHSs–ConA in compared to control cells. In contrast, MCTSs incubated with SCHSs and subjected to laser illumination showed dead cells that was increased by 3.1-fold in MCTSs. In comparison with all other groups, MCTSs incubated with SCHSs–ConA and subjected to 3 min NIR illumination showed a much higher level of cell death (9.9-fold). Nevertheless, the application of DOX–SCHSs–ConA induced most cell death (18.5-fold) after exposed to a 3 min NIR illumination. The high cytotoxicity resulted from both the local heat generation and the release of DOX was induced by NIR illumination.Discussion
XRD patterns of SCHSs were recorded for a 2θ range of 10–60° with CuKα radiation, as shown in Fig. S1E.† The XRD pattern of SCHSs indicated two broad peaks, assigned (002) and (101) based on the turbostratic carbon structure (carbon black); the strong diffraction peak around 2θ = 25° corresponds to the (002) planes of carbon and the weak peak at 44° is attributed to the (101) graphite plane.46DOX is a hydrophobic chemotherapeutic drug with fluorescent properties. Moreover, DOX is usually selected for investigations of drug EE of SCHSs because of the subsequent release of DOX upon application of external stimuli. After vacuum treatment at 55 °C, DOX was successfully loaded into SCHSs by electrostatic interactions to form DOX–SCHSs complexes.
Electrostatic interactions between the positively charged DOX and negatively charged SCHSs were greatly reduced in a low pH environment. This phenomenon occurs because the silica species are negatively charged and the charge density decreases as the pH is lower.47,48 Additionally, the amine group on DOX could be protonated, and thus the hydrophobic DOX could become more hydrophilic and water-soluble when the pH is lower (i.e., acidic conditions, pH = 5.5 and 6.5).19,28 The tumor microenvironment is acidic because of increased acid production resulting from high concentrations of metabolites, such as lactic acid and carbon dioxide (CO2).49 It can be proposed that attenuated interactions between DOX and SCHSs, because of the lower pH, result in a marked release of DOX in tumor tissues. Alternatively, the release of DOX also could increase when it enters the endocytic pathway to gain entry into cells, as the pH of early endosomes ranges from 6.0 to 6.5 and that of late endosomes and lysosomes ranges from 4.5 to 5.5.50
SCHSs showed less, or even no cytotoxic effect on both hepatoma cell lines at lower concentrations (100 μg mL−1).36 However, our data indicated that DOX–SCHSs could greatly enhance the therapeutic effect of DOX against cancer cells when compared to the same concentration of SCHSs (100 μg mL−1). This finding indicates that DOX was enclosed in the SCHSs and that its release inside the cells was delayed. Notably, we found that 10![[thin space (1/6-em)]](https://www.rsc.org/images/entities/char_2009.gif) :
:![[thin space (1/6-em)]](https://www.rsc.org/images/entities/char_2009.gif) 100 μg mL−1 DOX–SCHSs combined with NIR illumination effectively kills cancer cells. However, there was no significant cytotoxic effect of DOX in DOX–SCHSs supernatant (Fig. 6C and 7C) due to the low concentration of released DOX.
100 μg mL−1 DOX–SCHSs combined with NIR illumination effectively kills cancer cells. However, there was no significant cytotoxic effect of DOX in DOX–SCHSs supernatant (Fig. 6C and 7C) due to the low concentration of released DOX.
Given that assessing the chemo-photothermal effect in an in vivo-like environment may improve understanding of the use of our newly synthesized nano material, we further applied the DOX–SCHSs–ConA to an in vitro 3D tumor model as an intermediate assay between conventional two-dimensional cell culture and animal studies. MCTS is one of the novel models for recapitulating the tumor microenvironment, which are aggregates of cancer cells grown in suspension or embedded in gels using 3D culture methods.40,51 MCTS has a highly complex 3D arrangement of cells that can mimic early-stage avascular tumors, providing researchers with a more physiologically relevant environment to study biological functions compared to the traditional 2D monolayer culture.40 Our results suggested that the DOX–SCHSs–ConA could be readily implemented to MCTS for chemo-photothermal effect in a 3D culture environment. The results further indicated that the illumination of NIR laser could pose increased detrimental effect towards MCTS over different conditions of SCHSs, DOX–SCHSs–ConA showed the highest killing effect among all the conditions investigated. Despite most of the preliminary trends of chemo-photothermal effect on 3D MCTS are in agreement with that of 2D culture, it was noticed that the percentage of live cells remained in 3D was slightly higher than that of 2D. This outcome might be explained that the MCTS has a much greater structural integrity through enhanced cell–cell adhesion during the formation of spheroids, thus preventing the penetration of SCHSs.52 Based on the present study, further research on the penetration of DOX–SCHSs–ConA may improve the applicability of this MCTS based chemo-photothermal treatment.
Conclusion
In summary, we have synthesized DOX–loaded silica–carbon hollow spheres with a uniform and narrow size distribution, high surface area, and high DOX payload. The resulting DOX–loaded SCHSs possessed both superior heat-generating ability and enhanced drug therapeutic efficacy under NIR illumination. They also showed both thermal- and pH-responsiveness. The in vitro experiments showed greater tumor ablation capability of DOX–SCHSs and DOX–SCHSs–ConA under NIR treatment compared with either PTT or chemotherapy alone in both 2D and 3D MCTS cultures. Our results confirmed that ConA increases the tumor ablation capacity of DOX–SCHSs due to the higher binding capacity of DOX–SCHSs–ConA with hepatoma cells. Thus, our work demonstrated that DOX–loaded SCHSs conjugated with ConA could be a potential nanocarrier for an efficient combination of photothermal treatment and chemotherapy in tumor treatment.Conflicts of interest
There are no conflicts to declare.Acknowledgements
We thank the “Bio-image Core Facility of the National Core Facilities Program for Biopharmaceuticals, Ministry of Science and Technology, Taiwan” and “Micro/Nano Science and Technology Center” for their technical services. We acknowledge the financial support provided by the Ministry of Science and Technology of Taiwan under Grant No. MOST 105-2221-E-006-025-MY3 and MOST 105-2628-B-006-003-MY3.Notes and references
- J. Ferlay, I. Soerjomataram, R. Dikshit, S. Eser, C. Mathers, M. Rebelo, D. M. Parkin, D. Forman and F. Bray, Int. J. Cancer, 2015, 136, E359–E386 CrossRef CAS PubMed.
- A. Jemal, F. Bray, M. M. Center, J. Ferlay, E. Ward and D. Forman, Ca-Cancer J. Clin., 2011, 61, 69–90 CrossRef PubMed.
- L. A. Torre, F. Bray, R. L. Siegel, J. Ferlay, J. Lortet-Tieulent and A. Jemal, Ca-Cancer J. Clin., 2015, 65, 87–108 CrossRef PubMed.
- J. Bruix, G. J. Gores and V. Mazzaferro, Gut, 2014, 63, 844–855 CrossRef CAS PubMed.
- M. B. Thomas and A. X. Zhu, J. Clin. Oncol., 2005, 23, 2892–2899 CrossRef PubMed.
- V. T. DeVita Jr, R. C. Young and G. P. Canellos, Cancer, 1975, 35, 98–110 CrossRef CAS.
- M. M. Gottesman, Annu. Rev. Med., 2002, 53, 615–627 CrossRef CAS PubMed.
- V. W. Lam, C. Spiro, J. M. Laurence, E. Johnston, M. J. Hollands, H. C. Pleass and A. J. Richardson, Ann. Surg. Oncol., 2012, 19, 1292–1301 CrossRef PubMed.
- Z. Zhang, J. Wang and C. Chen, Adv. Mater., 2013, 25, 3869–3880 CrossRef CAS PubMed.
- X. Huang, I. H. El-Sayed, W. Qian and M. A. El-Sayed, J. Am. Chem. Soc., 2006, 128, 2115–2120 CrossRef CAS PubMed.
- S. Lal, S. E. Clare and N. J. Halas, Acc. Chem. Res., 2008, 41, 1842–1851 CrossRef CAS PubMed.
- M. Nikfarjam, V. Muralidharan and C. Christophi, J. Surg. Res., 2005, 127, 208–223 CrossRef PubMed.
- A. M. Smith, M. C. Mancini and S. Nie, Nat. Nanotechnol., 2009, 4, 710–711 CrossRef CAS PubMed.
- R. Weissleder, Nat. Biotechnol., 2001, 19, 316–317 CrossRef CAS PubMed.
- W. C. Dewey, Int. J. Hyperthermia, 2009, 25, 3–20 CrossRef CAS PubMed.
- J. P. May and S. D. Li, Expert Opin. Drug Delivery, 2013, 10, 511–527 CrossRef CAS PubMed.
- J. Cox and S. Weinman, Hepatic Oncology, 2016, 3, 57–59 CrossRef PubMed.
- B. Zhai and X. Y. Sun, World J. Hepatol., 2013, 5, 345–352 CrossRef PubMed.
- Z. Fülöp, R. Gref and T. Loftsson, Int. J. Pharm., 2013, 454, 559–561 CrossRef PubMed.
- H. J. Prajapati, R. Dhanasekaran, B. F. El-Rayes, J. S. Kauh, S. K. Maithel, Z. Chen and H. S. Kim, J. Vasc. Interv. Radiol., 2013, 24, 307–315 CrossRef PubMed.
- C. Iancu and L. Mocan, Int. J. Nanomed., 2011, 6, 1675–1684 CrossRef CAS PubMed.
- Z. M. Markovic, L. M. Harhaji-Trajkovic, B. M. Todorovic-Markovic, D. P. Kepić, K. M. Arsikin, S. P. Jovanović, A. C. Pantovic, M. D. Dramićanin and V. S. Trajkovic, Biomaterials, 2011, 32, 1121–1129 CrossRef CAS PubMed.
- J. K. Young, E. R. Figueroa and R. A. Drezek, Ann. Biomed. Eng., 2012, 40, 438–459 CrossRef PubMed.
- X. Huang, P. K. Jain, I. H. El-Sayed and M. A. El-Sayed, Lasers Med. Sci., 2008, 23, 217–228 CrossRef PubMed.
- B. Van de Broek, N. Devoogdt, A. D'Hollander, H. L. Gijs, K. Jans, L. Lagae, S. Muyldermans, G. Maes and G. Borghs, ACS Nano, 2011, 5, 4319–4328 CrossRef CAS PubMed.
- T. W. Kim, P. W. Chung, I. I. Slowing, M. Tsunoda, E. S. Yeung and V. S. Lin, Nano Lett., 2008, 8, 3724–3727 CrossRef CAS PubMed.
- R. Lv, P. Yang, F. He, S. Gai, G. Yang, Y. Dai, Z. Hou and J. Lin, Biomaterials, 2015, 63, 115–127 CrossRef CAS PubMed.
- Z. Wang, Y. Wang, M. Lu, L. Li, Y. Zhang, X. Zheng, D. Shao, J. Li and W. F. Dong, RSC Adv., 2016, 6, 44498–44505 RSC.
- Z. Zhang, J. Wang, X. Nie, T. Wen, Y. Ji, X. Wu, Y. Zhao and C. Chen, J. Am. Chem. Soc., 2014, 136, 7317–7326 CrossRef CAS PubMed.
- C. Coll, A. Bernardos, R. Martínez-Máñez and F. Sancenón, Acc. Chem. Res., 2013, 46, 339–349 CrossRef CAS PubMed.
- S. Kwon, R. K. Singh, R. A. Perez, E. A. Abou Neel, H. W. Kim and W. Chrzanowski, J. Tissue Eng., 2013, 4, 2041731413503357 Search PubMed.
- M. Vallet-Regí, F. Balas and D. Arcos, Angew. Chem., 2007, 46, 7548–7558 CrossRef PubMed.
- S. Mornet, O. Lambert, E. Duguet and A. Brisson, Nano Lett., 2005, 5, 281–285 CrossRef CAS PubMed.
- C. Xu, D. Yang, L. Mei, Q. Li, H. Zhu and T. Wang, ACS Appl. Mater. Interfaces, 2013, 5, 12911–12920 CrossRef CAS PubMed.
- Y. C. Chen, W. T. Chiu, J. C. Chen, C. S. Chang, L. H. Wang, H. P. Lin and H. C. Chang, J. Mater. Chem. B, 2015, 3, 2447–2454 RSC.
- I. I. Slowing, J. L. Vivero-Escoto, C. W. Wu and V. S. Lin, Adv. Drug Delivery Rev., 2008, 60, 1278–1288 CrossRef CAS PubMed.
- Q. He, J. Zhang, F. Chen, L. Guo, Z. Zhu and J. Shi, Biomaterials, 2010, 31, 7785–7796 CrossRef CAS PubMed.
- K. Qiu, C. He, W. Feng, W. Wang, X. Zhou, Z. Yin, L. Chen, H. Wang and X. Mo, J. Mater. Chem. B, 2013, 1, 4601–4611 RSC.
- S. H. Chen, C. P. Hu and C. M. Chang, Cancer Res., 1992, 52, 1329–1335 CAS.
- T. Y. Tu, Z. Wang, J. Bai, W. Sun, W. K. Peng, R. Y. Huang, J. P. Thiery and R. D. Kamm, Adv. Healthcare Mater., 2014, 3, 609–616 CrossRef CAS PubMed.
- D. F. Gilbert, G. Erdmann, X. Zhang, A. Fritzsche, K. Demir, A. Jaedicke, K. Muehlenberg, E. E. Wanker and M. Boutros, PLoS One, 2011, 6, e28338 CrossRef CAS PubMed.
- Y. Fang, R. Sullivan and C. H. Graham, Exp. Cell Res., 2007, 313, 867–877 CrossRef CAS PubMed.
- B. L. Fay, J. R. Melamed and E. S. Day, Int. J. Nanomed., 2015, 10, 6931–6941 CAS.
- L. Feng, X. Yang, X. Shi, X. Tan, R. Peng, J. Wang and Z. Liu, Small, 2013, 9, 1989–1997 CrossRef CAS PubMed.
- B. Tian, C. Wang, S. Zhang, L. Feng and Z. Liu, ACS Nano, 2011, 5, 7000–7009 CrossRef CAS PubMed.
- G. Wu, Z. Chen, K. Artyushkova, F. H. Garzon and P. Zelenay, ECS Trans., 2008, 16, 159–170 CAS.
- S. H. Wu, C. Y. Mou and H. P. Lin, Chem. Soc. Rev., 2013, 42, 3862–3875 RSC.
- L. Yuan, Q. Tang, D. Yang, J. Z. Zhang, F. Zhang and J. Hu, J. Phys. Chem. C, 2011, 115, 9926–9932 CrossRef CAS.
- Y. Tang, Z. Teng, Y. Liu, Y. Tian, J. Sun, S. Wang, C. Wang, J. Wang and G. Lu, J. Mater. Chem. B, 2014, 2, 4356–4362 RSC.
- A. Sorkin and M. Von Zastrow, Nat. Rev. Mol. Cell Biol., 2002, 3, 600–614 CrossRef CAS PubMed.
- J. Bai, T. Y. Tu, C. Kim, J. P. Thiery and R. D. Kamm, Oncotarget, 2015, 6, 36603–36614 Search PubMed.
- B. N. Eldridge, B. W. Bernish, C. D. Fahrenholtz and R. Singh, ACS Biomater. Sci. Eng., 2016, 2, 963–976 CrossRef CAS PubMed.
Footnote |
| † Electronic supplementary information (ESI) available. See DOI: 10.1039/c8ra08538b |
| This journal is © The Royal Society of Chemistry 2018 |

