 Open Access Article
At room temperature in water: efficient hydrogenation of furfural to furfuryl alcohol with a Pt/SiC–C catalyst
Guimei Wang,
Ruihua Yao,
Huiyue Xin,
Yejun Guan ,
Peng Wu
 and
Xiaohong Li
 *
*
Shanghai Key Laboratory of Green Chemistry and Chemical Processes, School of Chemistry and Molecular Engineering, East China Normal University, 3663 North Zhongshan Rd., Shanghai 200062, China. E-mail: xhli@chem.ecnu.edu.cn; Fax: +86-21-62238590; Tel: +86-21-62238590
First published on 6th November 2018
Abstract
Selective hydrogenation of furfural (FAL) to furfuryl alcohol (FOL) is challenging because of many side reactions. The highly selective hydrogenation of FAL to FOL can be achieved over a Pt catalyst supported on nanoporous SiC–C composites even at room temperature in water. A Pt/SiC–C-200-H2 catalyst, which had a Pt loading of 3 wt% and was reduced in flowing hydrogen at 500 °C after calcination in air at 200 °C for 2 h, furnished complete FAL conversion and over 99% selectivity to FOL at 25 °C under 1 MPa of hydrogen in water. The kinetic behaviour of the selective hydrogenation of FAL to FOL with the 3 wt% Pt/SiC–C-200-H2 catalyst was also investigated and the turnover frequency (TOF) reached 1148 h−1. Moreover, the Pt/SiC–C catalyst is more active than other Pt catalysts supported on ordered mesoporous carbon CMK-3, activated carbon, periodic mesoporous silica SBA-15 or Al2O3. Detailed characterization using XRD, N2-sorption, SEM, TEM and XPS techniques reveals that the striking performance of the Pt/SiC–C catalyst can be attributed to the optimal metal-support interaction and the interfacial effect.
1. Introduction
Over the last few decades, the conversion of biomass-derived molecules to fuels or chemicals has attracted much attention because of the major concerns related to global warming from anthropogenic emissions of green-house gases, climate change, and depletion of fossil fuels.1–4 Furfural (FAL), derived from hemicellulose, is a key platform compound which can be widely converted to a variety of chemicals and biofuels.5,6 Hydrogenation is one of the potential routes for FAL conversion. However, due to complicated reaction networks, many products including furfuryl alcohol (FOL), tetrahydrofuran (THF) and tetrahydro-furfuryl alcohol (THFOL) can be achieved via hydrogenation of FAL (Scheme 1).6 FOL is an important chemical intermediate because it has been widely applied in the synthesis of fine chemicals and polymers. For instance, FOL has been intensively utilized for the production of thermostatic resins, acid-proof bricks, corrosion-resistant fiber glass, lysine, vitamin C and lubricants.7,8 According to the statistics, 62% of global FAL was converted to FOL.9 | ||
| Scheme 1 Liquid-phase selective hydrogenation of furfural (FAL) to furfuryl alcohol (FOL) with a Pt catalyst supported on SiC–C composites at room temperature in neat water. | ||
However, during the hydrogenation of FAL, dehydrogenation or decarbonylation can simultaneously take place, thus the selective formation of FOL is very challenging and highly selective catalysts are needed. It is well known that copper chromite (Cu-Cr) catalysts are the most successful commercial catalysts in FAL hydrogenation processes for over five decades. Up to 98% of selectivity to FOL in either liquid or gas phase can be achieved on the Cu-Cr catalysts in various industrial processes.1 Nonetheless, stringent reaction conditions such as high temperature (up to 180 °C) and high hydrogen pressure (70–100 bar) are required in order to obtain medium FAL conversion and high selectivity to FOL.10 Moreover, the catalytic process using Cu-Cr catalysts suffer from a drawback of high toxicity that causes severe environmental pollution after catalyst final disposal. To overcome this, chromium-free catalysts and noble metal promoted Cu-based catalysts have been developed.11–18 For instance, Fulajtarova et al. prepared a Pd–Cu/MgO catalyst for hydrogenation of FAL and a high FOL selectivity of 99% was obtained at 40 °C.13 A Cu/MgO catalyst also behaved well in the hydroconversion of FAL to FOL in vapor phase under the optimal conditions.14,15 Besides, noble-metal catalysts also aroused intensive interests in this field.19–21
Among the various noble metal catalysts, Pt-based catalysts have been widely applied in various hydrogenation reactions due to their unique properties.22–25 Particularly, Pt-based catalysts were also employed in the selective hydrogenation of FAL to FOL.26–29,31 For example, Vaidya et al. used a Pt/C catalyst for FAL hydrogenation in a slurry reactor although the reaction rate was slow and the FOL selectivity was 96%.26 Kyriakou et al. also prepared various Pt catalysts supported on SiO2, ZnO, γ-Al2O3, CeO2 and MgO and they found that the Pt/γ-Al2O3 catalyst showed relatively good performance at 50 °C (an FAL conversion of 80% and an FOL selectivity of 99% after 7 h reaction), with atmospheric hydrogen and methanol as solvent. However, the substrate/catalyst ratio is very limited.27 Recently, Srinivas et al. prepared a Pt/γ-Al2O3 catalyst for the selective hydrogenation of FAL and an FOL selectivity of 98.1% was obtained.28 Nevertheless, the reaction conditions were not mild and the activity was low.
As mentioned above, it is still a great challenge to design environmentally friendly, active and selective catalysts for the liquid-phase FAL hydrogenation to FOL under mild conditions such as at room temperature under relatively lower hydrogen pressure. Herein, we report our efforts in the selective hydrogenation of FAL to FOL in a greener manner, which is, conducting the selective hydrogenation of FAL in water at room temperature with a Pt catalyst supported on nanoporous SiC–C composites. Silicon carbide SiC, as one of the most important semiconductors, has attracted much more attention in optical and electrical fields recently, due to its wide bandgap, high strength, high thermal conductivity, good thermal shock resistance, low thermal expansion and good chemical inertness.32 However, SiC alone has a relatively low specific surface area (usually below 100 m2 g−1). Therefore, nanoporous SiC–C composites were synthesized in order to obtain high surface area and combine the properties of activated carbon and SiC. More importantly, the Pt/SiC–C catalysts were proved highly active and selective for the liquid-phase hydrogenation of cinnamaldehyde under the milder conditions.33 When subjected to the selective hydrogenation of FAL, the Pt/SiC–C catalyst also afforded FOL with extremely high selectivity. Under the tested reaction conditions such as in water at 25 °C under 1 MPa of hydrogen pressure, both the FAL conversion and the FOL selectivity can reach over 99%.
2. Experimental section
2.1. Chemicals
H2PtCl6·6H2O (Pt ≥ 37%), FAL and other reagents were purchased from Sinopharm Group Co. Ltd and used as received. FOL, 5 wt% Pt/Al2O3 and 5 wt% Pt/C catalysts were purchased from Alfa Aesar. SiC–C composites were provided by Suzhou Yuhao Nanomaterial Inc. (Suzhou, China) and used as received.2.2. Catalyst preparation
The Pt/SiC–C–H2 catalyst was prepared using an ultrasound-promoted impregnation method which was described elsewhere.33 In this case, the catalyst precursor was reduced in flowing hydrogen (99.999%, 40 ml min−1) at 500 °C for 3 h. The resulting catalyst was designated as x wt% Pt/SiC–C–H2, where x refers to the Pt weight percentage in the catalyst. In some cases, the catalyst precursor was calcined in static air at 200 °C for 2 h before the reduction treatment and the resulting catalyst was denoted as x wt% Pt/SiC–C-200-H2. For comparison, x wt% Pt/SiC–C–SF catalyst was prepared in a similar manner as that for the x wt% Pt/SiC–C–H2 catalyst, except that the catalyst was reduced by sodium formate in water at 95 °C. In addition, 5 wt% Pt/SBA-15, 5 wt% Pt/CMK-3 were also prepared using the same method. The 5 wt% Pt/C and Pt/Al2O3 catalysts bought from Alfa Aesar were also used for comparison.2.3. Catalyst characterization
The structure and crystalline phase of the samples was characterized with a Bruker D8 Advance X-ray diffractometer (XRD) using Cu-Kα radiation. The specific surface area and pore volume of the samples were calculated using the adsorption branch from the nitrogen sorption isotherms at liquid nitrogen temperature (77 K) on a Quantachrome Autosorb-3B system, after the samples were outgassed at 200 °C for 10 h. The morphology of the samples were characterized with a Hitachi S4800 scanning electron microscope (SEM) operated at 20 kV. The Pt particle size and distribution was characterized with an FEI Tecnai G2-TF30 transmission electron microscope operated at 300 kV. X-ray photoelectronic spectroscopy (XPS) measurements were performed on a Thermo Fisher Scientific ESCALAB 250Xi spectrometer with Al Kα radiation (1486.6 eV) as an incident beam with a monochromator. Before the measurement, the sample was in situ pre-treated in flowing hydrogen at 400 °C for 2 h in a reactor attached to the XPS spectrometer. The binding energy (BE) was calibrated using C–C binding energy at 284.9 eV. The spectra have been calibrated by subtraction of a Shirley background. The XPSPEAK software was applied for spectral fitting and peak integration.2.4. Catalytic evaluation
For a standard reaction, 20 mg of the catalyst was firstly pretreated in flowing hydrogen (99.999%, 40 ml min−1) at 400 °C for 2 h. The catalyst was then transferred to an autoclave (100 ml) after mixing with 10 ml of water to avoid contact with air. Then, 300 μl of FAL was added to the autoclave. The hydrogenation started with electronically stirred at 1200 rpm after hydrogen (1.0 MPa) was introduced. The temperature was controlled at 25 °C. The reaction was terminated after 3–5 h and the products were analyzed using GC-FID (GC-2014, Shimadzu) equipped with a capillary column (DM-WAX, 30 m × 0.25 mm × 0.25 μm). For recycling experiments, the catalyst was recovered by centrifugation and washed with water for three times after each run. Then, water and FAL were re-charged to the autoclave together with the recovered catalyst to perform the next run reaction.3. Results and discussion
3.1. Characterizations of the Pt/SiC–C catalysts
The structures of the SiC–C composites and the Pt/SiC–C catalysts were characterized using XRD. As shown in Fig. 1, the SiC–C composites give typical diffraction patterns associated to (111), (220) and (311) planes of β-SiC, along with weak stacking faults at the 2 theta of 35°.32 In addition, the diffraction peak assigned to amorphous carbon is also observed at around 2 theta of 25°, verifying that besides β-SiC, there is also amorphous carbon. The β-SiC crystalline phase is well retained in the final Pt/SiC–C catalysts, which is confirmed by the patterns of the Pt/SiC–C catalysts. Moreover, the Pt/SiC–C catalysts also give typical but weak diffractions assigned to Pt(111), Pt(200) and Pt(220) planes, indicating that the Pt particles are well dispersed on the SiC–C surface without the formation of large aggregations.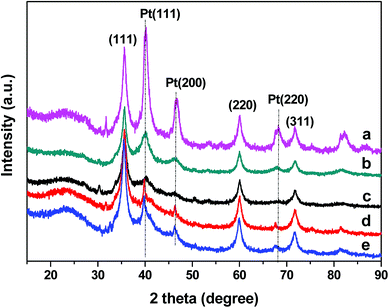 | ||
| Fig. 1 XRD patterns of (a) 5 wt% Pt/SiC–C–H2, (b) 5 wt% Pt/SiC–C–SF, (c) 3 wt% Pt/SiC–C–SF, (d) 3 wt% Pt/SiC–C–H2, and (e) 3 wt% Pt/SiC–C-200-H2. | ||
The porous structure and specific surface area of the typical Pt/SiC–C catalysts was determined by nitrogen sorption. The BET specific surface area of Pt/SiC–C is comparable with that of the SiC–C composites, with a surface area of about 330–340 m2 g−1. The pore volume of the Pt/SiC–C catalyst retains 0.5 cm3 g−1, demonstrating that the deposition of Pt nanoparticles does not block the pore entrance of the SiC–C composites. The pore size of Pt/SiC–C and SiC–C centres at 3.6 nm. The detailed physico-chemical parameters of the relevant catalysts are listed in Table 1 for clarity.
| Entry | Catalyst | SBET (m2 g−1) | Average Pt particle sizea (nm) | Pt dispersion (%) |
|---|---|---|---|---|
| a Revealed by the TEM image.b Calculated using the Scherrer equation from XRD pattern. | ||||
| 1 | SiC–C | 345 | — | — |
| 2 | 3 wt% Pt/SiC–C-200-H2 | 336 | 1.8 | 63.1 |
| 3 | 5 wt% Pt/SiC–C–SF | 340 | 2.2 | 51.4 |
| 4 | 5 wt% Pt/Al2O3 | 272 | 2.5 | 45.2 |
| 5 | 5 wt% Pt/C | 892 | 3.5b | 32.1 |
| 6 | 5 wt% Pt/SBA-15 | 320 | 11.7 | 9.6 |
| 7 | 5 wt% Pt/CMK-3 | 1290 | 3.2 | 35.3 |
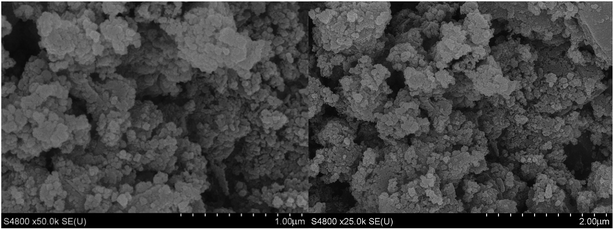
The morphology of the SiC–C composites was characterized using SEM (Fig. 2). The SiC–C composites exhibited irregular shapes with broccoli-like aggregations. The Pt particle size distribution of the typical Pt/SiC–C catalyst was characterized using TEM (Fig. 3). For the 3 wt% Pt/SiC–C-200-H2 catalyst, the Pt nanoparticles are uniformly dispersed on the SiC–C surface with an average Pt particle size of 1.8 nm and 63% dispersion (Fig. 3a).
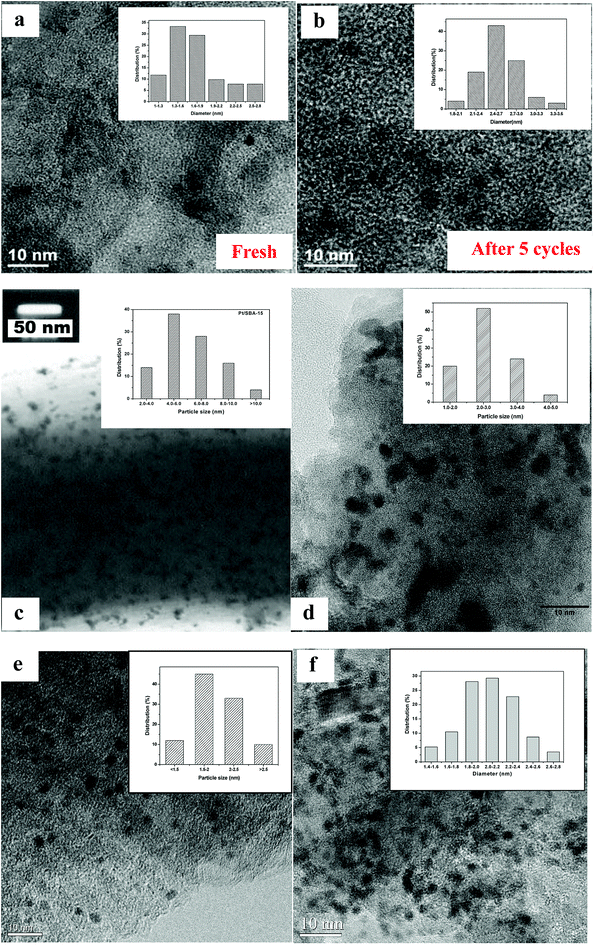 | ||
| Fig. 3 TEM images of (a) the fresh and (b) used 3 wt% Pt/SiC–C-200-H2 catalyst; (c) 5 wt% Pt/SBA-15; (d) 5 wt% Pt/Al2O3; (e) 5 wt% Pt/CMK-3 and (f) 5 wt% Pt/C. | ||
3.2. Selective hydrogenation of FAL to FOL over the Pt/SiC–C catalysts
In our previous studies, a 5 wt% Pt/SiC–C–SF catalyst, which had a Pt loading of 5 wt% and was reduced in an aqueous solution of sodium formate, was proved active and selective for the liquid-phase hydrogenation of cinnamaldehyde at room temperature.33 Thus, we firstly submitted the 5 wt% Pt/SiC–C–SF catalyst to the liquid-phase hydrogenation of FAL in water at room temperature. As listed in Table 2, the 5 wt% Pt/SiC–C–SF catalyst gives 99.4% FAL conversion with 91.7% FOL selectivity within 5 h. Although the FAL conversion is excellent, the FOL selectivity still needs to be improved. Then, we reduced the 5 wt% Pt/SiC–C catalyst precursor in flowing hydrogen at 500 °C. Unfortunately, the resultant 5 wt% Pt/SiC–C–H2 catalyst shows an FAL conversion of about 80% with an FOL selectivity of about 99% under the same reaction conditions. This indicates that the reduction method for the catalyst precursor will affect the catalytic performance obviously.| Entry | Catalyst | Conv. (%) | Sel. (%) | |
|---|---|---|---|---|
| FOL | Others | |||
| a Reaction conditions: 20 mg catalyst, 0.3 ml FAL, 10 ml water, 25 °C, 1.0 MPa H2, 1200 rpm, 5 h. Others: THF and THFOL. | ||||
| 1 | 5 wt% Pt/SiC–C–SF | 99.4 | 91.7 | 8.3 |
| 2 | 5 wt% Pt/SiC–C–H2 | 79.9 | 99.2 | 0.8 |
| 3 | 3 wt% Pt/SiC–C–SF | 99.5 | 97.8 | 2.2 |
| 4 | 3 wt% Pt/SiC–C–H2 | 73.7 | 99.7 | 0.3 |
| 5 | 3 wt% Pt/SiC–C-200-H2 | 99.5 | 99.4 | 0.6 |
Meanwhile, owing to the high cost of noble-metal Pt catalyst, the Pt/SiC–C catalyst with lower Pt loading such as 3 wt% was also prepared using the same method and then applied for the selective hydrogenation of FAL. Similarly, the 3 wt% Pt/SiC–C catalyst was also reduced using two methods just like the 5 wt% Pt/SiC–C catalysts. As a result, the similar phenomenon is also observed on the 3 wt% Pt/SiC–C catalysts. The 3 wt% Pt/SiC–C–H2 catalyst shows relatively lower FAL conversion but higher FOL selectivity than the 3 wt% Pt/SiC–C–SF catalyst. When the Pt/SiC–C catalysts were characterized by XRD (Fig. 1), it is found that the Pt/SiC–C–H2 catalysts have relatively stronger Pt(111) diffractions than the ones reduced in an aqueous solution of sodium formate, indicating that Pt nanoparticles would aggregate to form relatively larger particles when reduced at an elevated temperature.
Considering that the Pt/SiC–C–H2 catalyst has a comparatively lower activity but higher FOL selectivity, the catalytic activity of the Pt/SiC–C–H2 catalyst is required to further improve. Calcining the catalyst precursor in static air at 200 °C before reduction in flowing hydrogen indeed improves its catalytic ability remarkably. Consequently, the 3 wt% Pt/SiC–C-200-H2 catalyst furnishes almost complete FAL conversion with the excellent 99.4% FOL selectivity. On recalling the XRD patterns of Pt catalysts (Fig. 1), the larger Pt nanoparticles tend to give lower activity but higher selectivity to FOL. The 3 wt% Pt/SiC–C-200-H2 catalyst also shows similar Pt(111) diffraction as the 3 wt% Pt/SiC–C–H2 catalyst, suggesting that the Pt nanoparticle diffraction or Pt nanoparticle size hardly changes after calcination in air before reduction using the same method. However, calcination of the catalyst precursor in air might modulate the surface electronic property, so that the 3 wt% Pt/SiC–C-200-H2 catalyst can afford superior results. Another possible reason may be that calcination of the catalyst precursor in static air at 200 °C probably removes some residues on the SiC–C composite surface, because the SiC–C composite is used as received and there contains a large amount of carbon.33 Therefore, the 3 wt% Pt/SiC–C-200-H2 catalyst is selected as the standard catalyst in the subsequent studies.
Besides the catalyst preparation, reaction parameters such as solvent would also influence the catalytic performance. There are many solvents used for the tested reaction in literature, including polar solvents (isopropyl alcohol,28–30,34 methanol or ethanol27) and non-polar solvents (octane,29 toluene27,29). In this study, we also compared the catalytic performance with the 3 wt% Pt/SiC–C-200-H2 catalyst for the selective hydrogenation of FAL in different solvents within 3 h. As listed in Table 3, when the selective hydrogenation of FAL is conducted in a non-polar solvent such as octane, only 27.2% conversion is obtained with mediocre selectivity to FOL. When a polar solvent such as isopropanol is used as solvent, about 70% FAL conversion is afforded with over 90% selectivity to FOL. As already mentioned above, the selective hydrogenation of FAL in water within 3 h furnishes about 80% FAL conversion with nearly 99% selectivity to FOL. It seems that the FAL hydrogenation performance increases as a sequence of in octane < in isopropyl alcohol < in water. It agrees well with that the higher polarity of the solvent, the higher performance is obtained. The similar observation that the highest performance for the selective hydrogenation of FAL was achieved in water was also found in the literature.29,35
| Entry | Solvent | Conv. (%) | Sel. (%) | |
|---|---|---|---|---|
| FOL | Others | |||
| a Reaction conditions: 20 mg catalyst, 0.3 ml FAL, 10 ml water, 25 °C, 1.0 MPa H2, 1200 rpm, 3 h. Others: THF and THFOL. | ||||
| 1 | Octane | 27.2 | 68.4 | 31.6 |
| 2 | Isopropanol | 67.8 | 92.3 | 7.7 |
| 3 | Water | 80.2 | 98.4 | 1.6 |
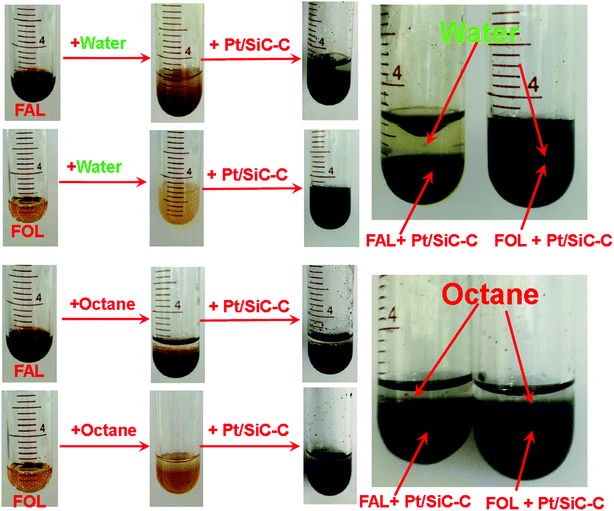
This can be interpreted by the solubility of FAL and FOL and by the soaking property of the Pt/SiC–C catalyst in different media. As clearly shown in the photographs in Fig. 4, FAL is slightly soluble in water and there is an opaque interface between water layer and FAL layer. When the Pt/SiC–C catalyst is submitted to the mixture of FAL/water, it is soaked well with the FAL layer. After overnight sedimentation, a clear interface between the water layer and the FAL layer is observed. With regards of FOL, it is relatively more soluble in water and the Pt/SiC–C catalyst is also soaked well with the aqueous solution of FOL. Even after overnight sedimentation, no obvious stratification is observed. Therefore, when the hydrogenation of FAL with the Pt/SiC–C catalyst is conducted in water, there would have an equilibrium move effect because once FOL is formed, it will be soluble in water and desorb from the catalyst surface, while the reactant FAL has an enriched concentration on the catalyst surface, resulting in an accelerated reaction. However, when the reaction is performed in octane, both FAL and FOL are insoluble in octane, so that the hydrogenation rate cannot be enhanced. The observations in this study are in good agreement with the literature.29,36
The kinetic behaviour of the selective hydrogenation of FAL was also studied with the 3 wt% Pt/SiC–C-200-H2 catalyst. As clearly displayed in Fig. 5, as the reaction progresses at room temperature in water, the FAL conversion increases quickly with reaction time. Consequently, more than 30% FAL conversion is obtained after 0.5 h. Accordingly, the TOF (in terms of the number of moles of converted FAL per mole of Pt active sites per hour) reaches 1148 h−1. About 63% and 80% FAL conversions are achieved within 1.5 h and 3 h, respectively. Finally, FAL is almost fully converted within 4 h. As for the FOL selectivity, it remains almost constant (>97%) during the whole process. This indicates that the hydrogenation of FAL under the tested conditions is not a sequential reaction and without further hydrogenation or hydrolysis.
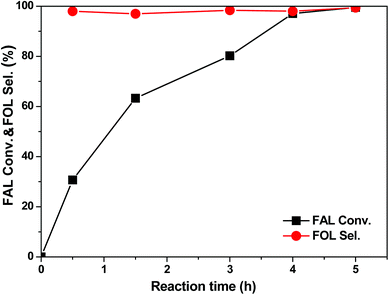 | ||
| Fig. 5 Kinetic profile of the selective hydrogenation of FAL with the 3 wt% Pt/SiC–C-200-H2 catalyst. Reaction conditions: 20 mg catalyst, 0.3 ml FAL, 10 ml water, 25 °C, 1.0 MPa H2, 1200 rpm. | ||
Besides, the effect of FAL concentration on the catalytic performance was also addressed. We change the FAL concentration in two ways, one way is using different solvent volumes with the constant FAL amount and the other is addition of different FAL amount in a designated solvent volume. Table 4 gives the detailed results. Under the standard conditions, 300 μl of FAL in 10 ml of water gave 80.2% conversion within 3 h. If the solvent volume was increased to 15 ml, lower FAL conversion of 67.7% was obtained. However, if the reaction with the same FAL amount was performed in 5 ml of water, higher conversion of 91.4% was obtained. That is, when we decreased the solvent volume with the same FAL amount, the FAL conversion increased obviously. On the other hand, when we added double amount of FAL in 10 ml of water, the TOF value increased significantly although the conversion decreased.
| Entry | FAL (μl) | Water (ml) | Conv. (%) | Sel. (%) | |
|---|---|---|---|---|---|
| FOL | Others | ||||
| a Reaction conditions: 20 mg catalyst, 25 °C, 1.0 MPa H2, 1200 rpm, 3 h. Others: THF and THFOL. | |||||
| 1 | 300 | 15 | 67.7 | 97.8 | 2.2 |
| 2 | 300 | 10 | 79.2 | 99.4 | 0.6 |
| 3 | 300 | 5 | 91.4 | 98.5 | 1.5 |
| 4 | 600 | 10 | 49.6 | 98.4 | 1.6 |
This observation can be interpreted by the concept of interfacial catalysis. The reactant FAL is slightly soluble in water, while the product FOL is soluble in water, therefore, the hydrogenation of FAL occurs at the interface of water-organic layer. Moreover, the Pt/SiC–C catalyst is more likely soaked well in FAL and FOL. Thus, the reactant FAL can be easily adsorbed on the catalyst surface. When the solvent volume was increased, the interface area between organic reactant and water becomes large so that the FAL concentration on the catalyst surface is lowered. As a result, the reaction rate in more volume solvent is lower than that in smaller one. Additionally, although the solvent and reactant are proportionally increased to double amount, the catalyst amount was kept unchanged so that the concentration of FAL on the catalyst surface was accordingly increased. Finally, the reaction rate was increased instead (Table 4, entry 4).
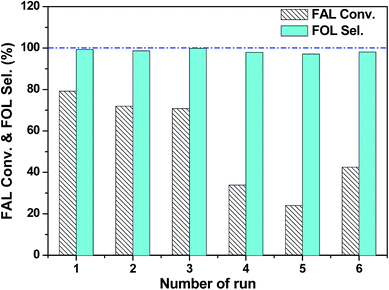
The recyclability of the 3 wt% Pt/SiC–C-200-H2 catalyst for the selective hydrogenation of FAL was also investigated, because the stability and reusability of a catalyst is still one of the important concerns. As can be seen in the Fig. 6, the 3 wt% Pt/SiC–C-200-H2 catalyst can be well recycled during the initial three cycles. However, the activity of the 3 wt% Pt/SiC–C-200-H2 catalyst declined gradually from the fourth run. Compared to the fresh catalyst, only one third of the FAL conversion is achieved on the used catalyst for the fifth cycle.
To interpret the reason of catalyst deactivation, the filtrate after the fifth run was detected using ICP-OES to check the Pt leaching amount. The results show that the leached Pt amount is below the detection limit of ICP-OES, demonstrating that Pt nanoparticles supported on the SiC–C surface are stable enough during the recycling processes. In addition, we also characterized the used Pt/SiC–C-200-H2 catalyst after five cycles using TEM to check whether Pt nanoparticles are aggregated. As already displayed in Fig. 3b, the Pt nanoparticles are still uniformly dispersed on the SiC–C surface except that the Pt particle size is slightly increased after 5 reaction cycles in comparison to the fresh one. According to the Pt particle size distribution in Fig. 3b, the Pt particle size of the used 3 wt% Pt/SiC–C-200-H2 catalyst after five cycles is centered in 2.2–2.6 nm, with an average Pt particle size of 2.4 nm. Therefore, we can exclude that Pt leaching or Pt particle aggregation is the main cause of the catalyst deactivation.
Thus, we speculate that there are too many FAL or FOL molecules adsorbed on the catalyst surface and cannot desorb from the catalyst surface only through washing with water due to the limited solubility of FAL or FOL in water. Subsequently, we used ethanol to wash the recycled 3 wt% Pt/SiC–C-200-H2 catalyst and detected the filtrate using GC-FID. As a result, there are indeed FAL and FOL with high concentration in the filtrate, confirming that a lot of FAL and FOL molecules were adsorbed on the catalyst surface. Therefore, we continued to wash the recycled catalyst using ethanol till no FAL or FOL can be detected by GC in the filtrate.
Then, we submitted the washed 3 wt% Pt/SiC–C-200-H2 catalyst to the sixth run again. It is worthy of note that due to weight wastage during washing and characterization by ICP-OES and TEM, only a half weight of the recycled catalyst (10 mg) was submitted to the sixth run. Accordingly, the solvent volume (5 ml of water) and FAL amount (0.15 ml) was reduced to a half. To our surprise, the activity of the used 3 wt% Pt/SiC–C-200-H2 catalyst was partly recovered. Compared with the results obtained for the fifth cycle, twice of FAL conversion was obtained for the sixth run. As for the slight decline in FAL conversion for the sixth run in comparison with the first run, different dosages and volumes of two cycles might be a key reason. Nevertheless, the 3 wt% Pt/SiC–C-200-H2 catalyst exhibited excellent recyclability if proper solvent was applied to wash the used catalyst. Undoubtedly, the strong interaction between Pt nanoparticles and Si–C composites would benefit the excellent stability of Pt/SiC–C catalyst.
3.3. Comparison of the Pt/SiC–C catalysts with other Pt-based catalysts
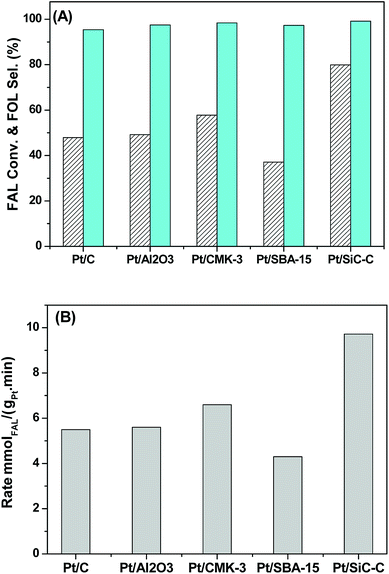
Based on the above discussion, we found that the Pt nanocatalyst supported on the Si–C composites exhibited high catalytic performance towards the liquid-phase hydrogenation of FAL to FOL in water at room temperature. In order to understand the Pt/SiC–C catalyst deeply, the catalytic performance of the Pt/SiC–C catalyst towards the liquid-phase hydrogenation of FAL to FOL was compared with Pt catalysts supported on other materials, such as 5 wt% Pt/SBA-15 and Pt/CMK-3 catalysts prepared using the similar methods, in water at 25 °C under 1 MPa of hydrogen within 5 h. Moreover, the commercial 5 wt% Pt/C and Pt/Al2O3 were also applied as reference catalysts.As shown in Fig. 7A, the Pt catalysts supported on carbon, Al2O3, ordered mesoporous carbon CMK-3 or periodic mesoporous silica SBA-15 only afford medium FAL conversion (less than 60%), although the selectivity to FOL was higher than 95%. As already mentioned above, the 5 wt% Pt/SiC–C–H2 catalyst shows higher FAL conversion than the other Pt catalysts. About 80% FAL conversion is obtained on the 5 wt% Pt/SiC–C–H2 catalyst under the same conditions. Moreover, the selectivity to FOL with the 5 wt% Pt/SiC–C–H2 catalyst was also higher than those on the other Pt catalysts. Nevertheless, as already discussed above, the 3 wt% Pt/SiC–C-200-H2 catalyst is more active than its analogue, the 5 wt% Pt/SiC–C–H2 catalyst. This demonstrates that the 3 wt% Pt/SiC–C-200-H2 catalyst is the most active and selective one among the Pt catalysts employed in the current work.
Furthermore, we compared the reaction rates (in terms of the converted moles of FAL per gram of Pt per minute) obtained on different Pt catalysts. As displayed in Fig. 7B, the Pt/C, Pt/Al2O3, Pt/CMK-3 and Pt/SBA-15 only afford the reaction rate of about 5 mmolFAL gPt−1 min−1, while the 5 wt% Pt/SiC–C–H2 catalyst gives the reaction rate of more than 9.7 mmolFAL gPt−1 min−1, which is about 2 times of those on the other Pt catalysts. As for the most active 3 wt% Pt/SiC–C-200-H2 catalyst, the reaction rate can reach 25.1 mmolFAL gPt−1 min−1 based on the complete conversion within 4 h, about 5 times of those obtained with the other Pt catalysts.
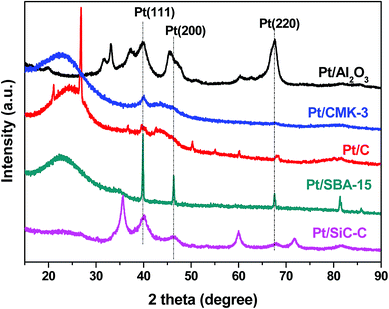
In order to understand the differences between different Pt catalysts, the related Pt catalysts were characterized using XRD and TEM. All the Pt catalysts show Pt(111) diffraction and the Pt/SBA-15 catalyst shows the strongest diffraction among all the Pt catalysts (Fig. 8). This might be one of the important reasons for the Pt/SBA-15 catalyst not to behave well for the selective hydrogenation of FAL. With regards to Pt catalysts supported on activated carbon, CMK-3 or alumina, only rather weak Pt(111) diffraction is observed, suggesting that Pt nanoparticles on these supports are uniformly dispersed. The XRD results are in good agreement with the TEM images (Fig. 3). However, when recalling their catalytic performance in the selective hydrogenation of FAL, the Pt catalysts supported on activated carbon, CMK-3 or alumina exhibit inferior performance although they even have smaller Pt particle size compared with the Pt/SiC–C catalyst. This implies that the Pt particle size is not the only important factor to influence the catalytic performance. We propose that the surface electronic property of Pt catalysts plays a vital role in adsorption and activation of carbonyl group in FAL. The SiC–C composites supported Pt catalyst maybe has an optimal surface electronic property so that the adsorption and activation of carbonyl group in FAL would be preferred, which would be discussed later.
We also compared our results with the related Pt catalysts reported in the literature. As clearly listed in Table 5, 50 mg of 5 wt% Pt/Al2O3 catalyst converted 1 g of FAL with 17.5% conversion in isopropanol after 5 h at 25 °C with 2 MPa of hydrogen, the reaction rate (in terms of the converted moles of FAL per gram of Pt per minute) reaching 2.42 mmol gPt−1 min−1.28 Another example is that, 20 mg of 2 wt% Pt/Al2O3 catalyst converted 0.02 mmol of FAL with 80.0% of conversion in methanol after 7 h at 50 °C. Maybe because the atmospheric hydrogen was adopted, the reaction rate was only 0.095 mmol gPt−1 min−1 as a result.27 More recently, Mu and co-workers carried out the hydrogenation of FAL to FOL with 2.5 wt% Pt nanoparticles supported on g-C3N4 graphitic carbon nitride nano-sheets (Pt@TECN). At 100 °C and in water, the Pt@TECN catalyst afforded a reaction rate of 12.33 mol gPt−1 min−1.29 In this study, we applied 20 mg of 3 wt% Pt/SiC–C-200-H2 catalyst for the hydrogenation of 0.3 ml FAL in water at room temperature (25 °C) with 1 MPa of hydrogen. After 3 h, 80.2% conversion was achieved. We calculated the reaction rate using the similar method and the 3 wt% Pt/SiC–C-200-H2 catalyst give a reaction rate of 26.5 mmol gPt−1 min−1, which is much higher than those in the literature.
| Catalyst | Amount (mg) | FAL amount | T (°C) | PH2 | t (h) | Conv. (%) | Rate (mmol gPt−1 min−1) | Ref. |
|---|---|---|---|---|---|---|---|---|
| 5% Pt/Al2O3 | 50 | 1 g in 20 ml isopropanol | 25 | 2.0 MPa | 5 | 17.5 | 2.42 | 28 |
| 2% Pt/Al2O3 | 20 | 0.02 mmol in methanol | 50 | Ambient | 7 | 80.0 | 0.095 | 27 |
| 2.5% Pt@TECN | 50 | 0.4 ml in 20 ml water | 100 | 1.0 MPa | 5 | 95.9 | 12.3 | 29 |
| 3% Pt/SiC–C | 20 | 0.3 ml in 10 ml water | 25 | 1.0 MPa | 3 | 80.2 | 26.5 | This study |
3.4. Further characterization of the 3 wt% Pt/SiC–C-200-H2 catalyst and further discussion
Based on the results and discussion above, the 3 wt% Pt/SiC–C-200-H2 catalyst is very active and selective for the selective hydrogenation of FAL to FOL even the reaction was performed at room temperature. To understand the superiority of the SiC–C supported Pt catalyst, the 3 wt% Pt/SiC–C-200-H2 catalyst was further characterized using XPS technique after in situ pretreatment in flowing hydrogen at 400 °C for 2 h. Fig. 9A shows the C 1s spectra of the catalyst. Besides the typical C 1s peak (282.9 eV) attributed to SiC, there are abundant C 1s species assigning to amorphous carbon (284.9 eV) or graphene carbon.33 In addition, there are also some carbon species with higher binding energies (285.9 and 298.5 eV) attributed to organic groups. As for the Si 2p spectra (Fig. 9B), there are dominant Si 2p species which can be assigned to SiC (100.8 eV), in accompany with Si 2p species attributed to SiO2 (102.8 eV).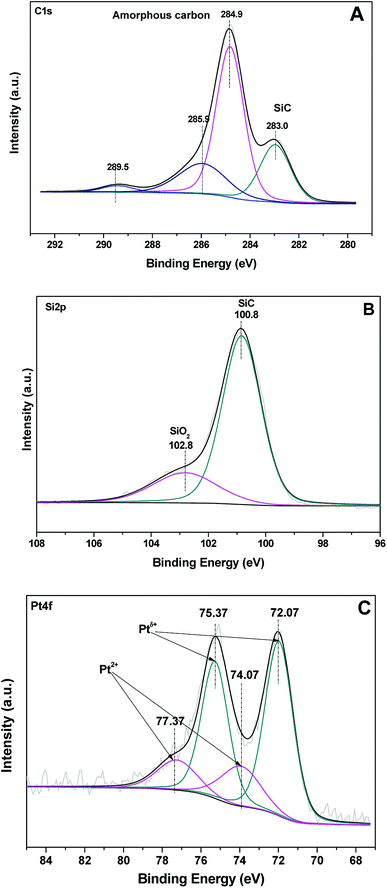 | ||
| Fig. 9 (A) C 1s, (B) Si 2p and (C) Pt 4f XPS spectra of the 3 wt% Pt/SiC–C-200-H2 catalyst after in situ pretreatment in flowing hydrogen at 400 °C for 2 h. | ||
Fig. 9C displays the Pt 4f spectra of the 3 wt% Pt/SiC–C-200-H2 catalyst. It can be deconvoluted to four peaks for two Pt species. The stronger peaks at 72.1 and 75.4 eV for Pt 4f7/2 and Pt 4f5/2 are higher than those for Pt0, but lower than those for Pt2+, so it can be attributed to Ptδ+. The other doublet at 74.1 and 77.4 eV could be assigned to Pt2+.22,33 Compared with the conventional supported Pt catalysts, there are obvious shift in binding energy to the higher energy. This suggests that there is very strong interaction between Pt nanoparticles and SiC–C composites, which might be formed during calcination of the catalyst precursor and the reduction process in flowing hydrogen. The strong interaction caused predominant Ptδ+ species on the catalyst surface, while the Ptδ+ species are beneficial to the adsorption and activation of FAL through the interaction of Ptδ+ species with the oxygen atom in carbonyl group of FAL, so that the selectivity to FOL is greatly improved with the Pt/SiC–C catalyst.
With regards to the Pt catalysts supported on other materials, SBA-15, the ordered mesoporous silica, is regarded as one of the inert supports, which would not have interaction with Pt nanoparticles so that the electronic disturbance to Pt surface property can be ignored. As for the Pt/CMK-3 and Pt/Al2O3 catalysts, we have characterized using CO-probed diffuse reflectance infrared Fourier-transformation spectroscopy in our previous studies.37 As a result, the Pt/CMK-3 catalyst has a high electron density and thus there is an electrostatic repulsion to CO molecules, while the commercial Pt/Al2O3 catalyst gave a CO-linearly adsorbed band at 2083 cm−1 together with a shoulder band at 2050 cm−1, assignable to Ptδ+ and Pt0 atoms, respectively. Correspondingly, different support materials have different interaction with Pt nanoparticles so that the supported Pt catalysts behave differently in the liquid-phase hydrogenation of FAL in water at room temperature.
The SiC–C composite supported Pt catalysts after optimization of preparation parameters have high and uniform Pt dispersion, optimal Pt particle size and optimal interaction with Pt nanoparticles after calcination in static air at 200 °C. These physico-chemical properties of the Pt/SiC–C catalysts determine that the Pt/SiC–C catalyst exhibit superior catalytic performance in the liquid-phase hydrogenation of FAL even at room temperature.
4. Conclusions
In summary, the Pt nanocatalyst supported on SiC–C composite shows superior activity and selectivity to other Pt catalysts supported on conventional materials, such as SBA-15, CMK-3, Al2O3 and carbon, in the liquid-phase selective hydrogenation of FAL in water at room temperature. The SiC–C composite has the advantages of carbon and SiC, so that the SiC–C composite has large specific surface area and Pt nanoparticles can be highly and uniformly dispersed on its surface with an average Pt particle size of 1.8 nm. Furthermore, there is special and optimal interaction between Pt nanoparticles and SiC–C composite, which makes the uniform dispersion of Pt nanoparticles and predominant Ptδ+ species on the catalyst surface. These physico-chemical properties of the Pt/SiC–C catalysts are beneficial to the adsorption and activation of FAL through the interaction of Ptδ+ species with the oxygen atom in carbonyl group of FAL, so that the activity and selectivity to FOL is greatly improved with the Pt/SiC–C catalysts.Conflicts of interest
There are no conflicts to declare.Acknowledgements
This work was supported by the National Natural Science Foundation of China (21273076) and Shanghai Leading Academic Discipline Project (B409).References
- A. Corma, S. lborra and A. Velty, Chem. Rev., 2007, 207, 2411 CrossRef PubMed.
- P. Gallezot, Chem. Soc. Rev., 2012, 41, 1538 RSC.
- I. Delidovich, K. Leonhard and R. Palkovits, Energy Environ. Sci., 2014, 7, 2803 RSC.
- R. A. Sheldon, Green Chem., 2014, 16, 950 RSC.
- M. G. Dohade and P. L. Dhepe, Green Chem., 2017, 19, 1144 RSC.
- R. F. Perez and M. A. Fraga, Green Chem., 2014, 16, 3942 RSC.
- R. S. Rao, R. T. K. Baker and M. A. Vannice, Catal. Lett., 1999, 60, 51 CrossRef CAS.
- B. M. Nagaraja, A. H. Padmasri, B. David Raju and K. S. Rama Rao, J. Mol. Catal. A: Chem., 2007, 265, 90 CrossRef CAS.
- K. Yan, G. Wu, T. Lafleur and C. Jarvis, Renewable Sustainable Energy Rev., 2014, 38, 663 CrossRef CAS.
- R. Rao, A. Dandekar, R. T. K. Baker and M. A. Vannice, J. Catal., 1997, 171, 406 CrossRef CAS.
- S. Srivastava, N. Solanki, P. Mohanty, K. A. Shah, J. K. Parikh and A. K. Dalai, Catal. Lett., 2015, 145, 81 CrossRef.
- S. Srivastava, P. Mohanty, J. K. Parikh, A. K. Dalai, S. S. Amritphale and A. K. Khare, Chin. J. Catal., 2015, 36, 933 CrossRef CAS.
- K. Fulajtarova, T. Sotak, M. Hronec, I. Vavra, E. Dobrocka and M. Omastova, Appl. Catal., A, 2015, 502, 78 CrossRef CAS.
- M. Ghashghaee, S. Shirvani and M. Ghambarian, Appl. Catal., A, 2017, 545, 134 CrossRef CAS.
- Á. O'Driscoll, J. J. Leahy and T. Curtin, Catal. Today, 2017, 279, 194 CrossRef.
- C. P. Jiménez-Gómez, J. A. Cecilia, R. Moreno-Tost and P. Maireles-Torres, Top. Catal., 2017, 60, 1 CrossRef.
- S. Shirvani, M. Ghashghaee, V. Farzaneh and S. Sadjadi, Biomass Convers. Biorefin., 2018, 8, 79 CrossRef CAS.
- J. Zhang and J. Chen, ACS Sustainable Chem. Eng., 2017, 5, 5982 CrossRef CAS.
- J. Chen, F. Lu, J. Zhang, W. Yu, F. Wang, J. Gao and J. Xu, ChemCatChem, 2013, 5, 2822 CrossRef CAS.
- Q. Yuan, D. Zhang, L. van Haandel, F. Ye, T. Xue, E. J. M. Hensen and Y. Guan, J. Mol. Catal. A: Chem., 2015, 406, 58 CrossRef CAS.
- Y. Nakagawa, K. Takada, M. Tamura and K. Tomishige, ACS Catal., 2014, 4, 2718 CrossRef CAS.
- H. Pan, J. Li, J. Lu, W. Xie, P. Wu and X. Li, J. Catal., 2017, 354, 24 CrossRef CAS.
- Y. Xue, R. Yao, G. Wang, P. Wu and X. Li, Catal. Sci. Technol., 2017, 7, 6112 RSC.
- H. Pan, X. Li, Y. Yu, J. Li, J. Hu, Y. Guan and P. Wu, J. Mol. Catal. A: Chem., 2015, 399, 1 CrossRef CAS.
- X. Li, W. Zheng, H. Pan, Y. Yu, L. Chen and P. Wu, J. Catal., 2013, 300, 9 CrossRef CAS.
- P. D. Vaidya and V. V. Mahajani, Ind. Eng. Chem. Res., 2003, 42, 3881 CrossRef CAS.
- M. J. Taylor, L. J. Durndell, M. A. Isaacs, C. M. A. Parlett, K. Wilson, A. F. Lee and G. Kyriakou, Appl. Catal., B, 2016, 180, 580 CrossRef CAS.
- S. Bhogeswararao and D. Srinivas, J. Catal., 2015, 327, 65 CrossRef CAS.
- X. F. Chen, L. G. Zhang, B. Zhang, X. C. Guo and X. D. Mu, Sci. Rep., 2016, 6, 28558 CrossRef PubMed.
- J. Zhang, K. Dong, W. Luo and H. Guan, ACS Omega, 2018, 3, 6206 CrossRef CAS.
- V. V. Pushkarev, N. Musselwhite, K. An, S. Alayoglu and G. A. Somorjai, Nano Lett., 2012, 12, 5196 CrossRef CAS PubMed.
- R. Wu, K. Zhou, C. Y. Yue, J. Wei and Y. Pan, Prog. Mater. Sci., 2015, 72, 1 CrossRef CAS.
- R. Yao, J. Li, P. Wu and X. Li, RSC Adv., 2016, 6, 81211 RSC.
- R. V. Sharma, U. Das, R. Sammynaiken and A. K. Dalai, Appl. Catal., A, 2013, 454, 127 CrossRef CAS.
- M. G. Dohade and P. L. Dhepe, Green Chem., 2017, 19, 1144 RSC.
- A. B. Merlo, V. Vetere, J. F. Ruggera and M. L. Casella, Catal. Commun., 2009, 10, 1665 CrossRef CAS.
- B. Li, X. Li, H. Wang and P. Wu, J. Mol. Catal. A: Chem., 2011, 345, 81 CrossRef CAS.
| This journal is © The Royal Society of Chemistry 2018 |

