 Open Access Article
Creative Commons Attribution 3.0 Unported Licence
Microwave-assisted facile synthesis of poly(luminol-co-phenylenediamine) copolymers and their potential application in biomedical imaging†
Ufana Riaz *a,
Sapana Jadouna,
Prabhat Kumarb,
Raj Kumarc and
Nitin Yadavd
aMaterials Research Laboratory, Department of Chemistry, Jamia Millia Islamia, New Delhi-110025, India. E-mail: ufana2002@yahoo.co.in
bAdvanced Instrumentation Research Facility, Jawaharlal Nehru University, New Delhi-110067, India
cCancer and Radiation Therapeutics Laboratory, School of Life Sciences, Jawaharlal Nehru University, New Delhi-110067, India
dDepartment of Chemistry, Indian Institute of Technology, Delhi-110016, India
First published on 6th November 2018
Abstract
Conjugated copolymers have attracted much attention because of their outstanding photo-physical properties. The present work reports for the first time, microwave-assisted copolymerization of o-phenylenediamine with luminol using different weight ratios of the two monomers. The composition of the copolymers was confirmed by Fourier transform infrared spectroscopy (FTIR) and nuclear magnetic resonance spectroscopy (1H-NMR) while monomer reactivity ratios were determined using the Fineman–Ross method. Ultraviolet-visible spectroscopy revealed the variation in polaronic states upon copolymerization while X-ray diffraction (XRD) and transmission electron microscopy (TEM) analyses showed the morphology of the copolymers to be intermediate between that of the homopolymers. Confocal analysis and fluorescence studies revealed that the copolymers showed composition based blue as well as red emission which could be utilized for in vivo imaging of cancer cells.
Introduction
Stimuli responsive fluorescent nanomaterials such as quantum dots, (QDs),1,2 carbon nano-dots (CDs),3,4 polymer dots5,6 etc. have been extensively investigated for their biological applications particularly in the detection and diagnosis of tumours at early stages of occurrence. QDs are well-known for their remarkable optoelectronic properties, size-tunability, high quantum yield (QY), outstanding resistance to photo-bleaching, and exceptionally large Stokes shift.7,8 However, most of the QDs that are effectively used as contrast imaging agents are toxic inorganic nanoparticles, which raises serious concerns regarding their potential long-term cytotoxicity under in vivo conditions.9–12 Hence, the quest for alternative biocompatible as well as non-cytotoxic materials has gained momentum.13,14 Several near infrared (NIR) light-emitting polymers such as polyfluorenes (PFs),15 polyethylene-dioxythiophene (PEDOT),16 polypyrrole (PPy)17 etc. have been demonstrated to exhibit good biocompatibility in a number of in vitro and in vivo studies. However, efforts are still underway to develop effective conjugated polymer based theranostic agents for controllable cancer detection and diagnosis. Applications of aggregation-induced emission (AIE) of luminogens such as cyano-substituted diarylethene derivatives,18,19 tetraphenylethene (TPE) derivatives,20,21 distyrylanthracene derivatives,22,23 α-cyanostilbene derivatives24,25 in chemosensors and bio-imaging are well-documented.26 Polymerization-induced self-assembly (PISA) has also been investigated to prepare positive contrast agents for magnetic resonance imaging (MRI).27,28Near infrared emission (NIR) provides high sensitivity towards in vivo measurements through minimum interference of auto-fluorescence from biological tissues and hence is regarded as a desirable technology for the diagnostic bioimaging. Hence, aith the view to develop a tunable bioimaging agent, we have for the first time, attempted to copolymerize luminol with POPD via microwave-assisted chemical polymerization method. Among the several polymerization techniques known, microwave-assisted synthesis offers several advantages such as solid phase synthesis, increased reaction rates, and improved product yields.29,30
Luminol was chosen as a co-monomer because it is commonly used as a chemiluminescence reagent in forensic medicine for selective detection of blood stains, but no work has been reported on the chemical copolymerization of luminol.31–34 O-phenylenediamine (OPD) on the other hand, is an extensively explored polyaniline (PANI) derivative which exhibits outstanding photo-physical properties and fairly good water solubility.35,36 Copolymerization of the two monomers was carried out with a view to tailor the opto-electronic and electrochemical properties of copolymers by varying the co-monomer ratio.37–39
The copolymers were analysed for their spectral and morphological characteristics by employing infrared (IR), 1H-NMR, ultraviolet-visible (UV-Vis) spectroscopies, X-ray diffraction (XRD) and transmission electron microscopic (TEM) techniques. Fluorescence spectroscopy and confocal imaging were also carried out to explore the emission characteristics of the copolymers. Spectral studies confirmed the formation of a random copolymer exhibiting composition dependent optical characteristics. Cell viability was investigated using the methyl tetrazolium (MTT) assay and human cervical tumour (HeLa) cells. The imaging capability of the copolymers was analysed via live cell imaging studies.
Experimental
Luminol, o-phenylenediamine, dimethyl sulfoxide and 3(4,5-dimethyl thiozol-2-yl)-2,5-diphenyl tetrazolium bromide) (MTT) assay were purchased from Sigma Aldrich, USA and were used without further purification. RPMI-1640, FBS, trypsin and antibodies were purchased from GIBCO Grand Island, New York, USA.Microwave-assisted synthesis of homopolymers of o-phenylenediamine and luminol
O-phenylenediamine (OPD) (1 g, 9 × 10⁻² mol) was dispersed in deionized water (50 ml) in an Erlenmeyer flask (100 ml) containing benzoyl peroxide (BPO) (4.47993 g, 2.5 × 10⁻¹ mol). The reaction mixture was exposed to microwave irradiation for 15 min at 25 °C in microwave oven (model LBP125-230, Ladd Research (USA)) as per synthesis conditions reported in our previous studies.39 The obtained product was then kept overnight in a deep freezer at −10 °C and was centrifuged after 24 h with distilled water to remove the unreacted impurities. The synthesized polymer was dried at 70 °C for 72 h in vacuum oven to ensure complete removal of moisture, unreacted monomer and other volatile impurities. The polymerization of luminol (PLU) was carried out in a similar manner using luminol (1 g, 5 × 10⁻² mol) and BPO (4.47993 g, 2.5 × 10⁻¹ mol). The yields obtained for POPD and PLU were 67.75% and 84.33% respectively.Synthesis of copolymers of o-phenylenediamine and luminol
To prepare copolymers of POPD![[thin space (1/6-em)]](https://www.rsc.org/images/entities/char_2009.gif) :
:![[thin space (1/6-em)]](https://www.rsc.org/images/entities/char_2009.gif) PLU, monomer (OPD) (0.5 g, 5 × 10⁻² mol) and luminol (LUM) (0.2 g, 1 × 10⁻² mol) were added to Erlenmeyer flask (100 ml) containing BPO (4.47993 g, 2.5 × 10⁻¹ mol) homogeneously dispersed in distilled water (50 ml). The reaction mixture was exposed to microwave irradiation for 15 min at 25°C in microwave oven (model LBP125-230, Ladd Research (USA)) as per synthesis conditions reported in our previous studies.39 The synthesized copolymer centrifuged with distilled water and removal of iron was ensured by testing the filtrate with potassium ferrocyanide.39 The obtained copolymer was dried in vacuum oven at 70 °C (for 72 h) to ensure complete removal of water and other volatile impurities. The copolymer was designated as POPD/PLU-80/20. Similarly, the synthesis of other POPD
PLU, monomer (OPD) (0.5 g, 5 × 10⁻² mol) and luminol (LUM) (0.2 g, 1 × 10⁻² mol) were added to Erlenmeyer flask (100 ml) containing BPO (4.47993 g, 2.5 × 10⁻¹ mol) homogeneously dispersed in distilled water (50 ml). The reaction mixture was exposed to microwave irradiation for 15 min at 25°C in microwave oven (model LBP125-230, Ladd Research (USA)) as per synthesis conditions reported in our previous studies.39 The synthesized copolymer centrifuged with distilled water and removal of iron was ensured by testing the filtrate with potassium ferrocyanide.39 The obtained copolymer was dried in vacuum oven at 70 °C (for 72 h) to ensure complete removal of water and other volatile impurities. The copolymer was designated as POPD/PLU-80/20. Similarly, the synthesis of other POPD![[thin space (1/6-em)]](https://www.rsc.org/images/entities/char_2009.gif) :
:![[thin space (1/6-em)]](https://www.rsc.org/images/entities/char_2009.gif) PLU copolymers were carried out by varying the co-monomer ratios OPD
PLU copolymers were carried out by varying the co-monomer ratios OPD![[thin space (1/6-em)]](https://www.rsc.org/images/entities/char_2009.gif) :
:![[thin space (1/6-em)]](https://www.rsc.org/images/entities/char_2009.gif) LUM as 0.3 g, 2 × 10⁻² mol: 0.5 g, 3 × 10⁻² mol and 0.25 g, 2 × 10⁻² mol: 1.63 g, 1 × 10⁻² mol respectively. The synthesized copolymers were designated as POPD/PLU-50/50 and POPD/PLU-20/80. The percent yield obtained for the copolymers was POPD/PLU-80/20: 75.03%; POPD/PLU-50/50: 78.27% and POPD/PLU-20/80: 79.81%.
LUM as 0.3 g, 2 × 10⁻² mol: 0.5 g, 3 × 10⁻² mol and 0.25 g, 2 × 10⁻² mol: 1.63 g, 1 × 10⁻² mol respectively. The synthesized copolymers were designated as POPD/PLU-50/50 and POPD/PLU-20/80. The percent yield obtained for the copolymers was POPD/PLU-80/20: 75.03%; POPD/PLU-50/50: 78.27% and POPD/PLU-20/80: 79.81%.
Characterization
The viscosity average molar mass was investigated by viscosity method as reported in our previous studies.39 FT-IR spectra were recorded on FT-IR spectrophotometer model Shimadzu IRA Affinity-1 and the integrated absorption coefficient (∫ad![[small nu, Greek, macron]](https://www.rsc.org/images/entities/char_e0ce.gif) ) was determined as per reported method.37 UV-visible spectra were taken on UV-visible spectrophotometer model Shimadzu UV-1800 in DMSO and the molar extinction coefficient (εM) as well as oscillator strength was calculated as per reported method.37 1H-NMR spectra of the polymer solutions (prepared in CDCl3 10 mg ml−1) were recorded on Bruker AC300. X-ray diffraction patterns were obtained using Philips PW 3710 powder diffractometer. Transmission electron micrographs (TEM) were recorded on Morgagni 268-D TEM, FEI, USA. Fluorescence spectra were recorded on fluorescence spectrophotometer model Horiba Fluorolog@3-11 in the solution state using N-methyl 2-pyrrolidinone (NMP) as solvent. The quantum yield was determined as per reported method.37 Confocal micrographs were taken on a Laser Confocal Microscope Olympus FluoView™ (λexc = 410 nm).
) was determined as per reported method.37 UV-visible spectra were taken on UV-visible spectrophotometer model Shimadzu UV-1800 in DMSO and the molar extinction coefficient (εM) as well as oscillator strength was calculated as per reported method.37 1H-NMR spectra of the polymer solutions (prepared in CDCl3 10 mg ml−1) were recorded on Bruker AC300. X-ray diffraction patterns were obtained using Philips PW 3710 powder diffractometer. Transmission electron micrographs (TEM) were recorded on Morgagni 268-D TEM, FEI, USA. Fluorescence spectra were recorded on fluorescence spectrophotometer model Horiba Fluorolog@3-11 in the solution state using N-methyl 2-pyrrolidinone (NMP) as solvent. The quantum yield was determined as per reported method.37 Confocal micrographs were taken on a Laser Confocal Microscope Olympus FluoView™ (λexc = 410 nm).
Cell culture and MTT assay studies
The cancer cell line used for cell culture, Human cervical cancer cell (HeLa) was purchase from National Centre for Cell Science, Department of Biotechnology, Pune, India. The studies pertaining to cell proliferation, viability and imaging were carried out as per reported protocols.31,40Results and discussion
Determination of solubility, intrinsic viscosity and viscosity average molecular weight
The solubility of PLU was observed to be higher in most of the organic solvents as compared to that of POPD. With increasing PLU content, the solubility of the copolymers was found to increase. The solubility of the copolymer POPD/PLU-20/80 was found to be highest among all the copolymers due to the presence of high luminol content, (ESI Table S1†). The intrinsic viscosity and viscosity average molecular weight was determined using Mark–Houwink equation.39 Intrinsic viscosities were observed to be 0.90 for POPD and 0.36 for PLU while for the copolymers they were calculated to be 0.73, 0.66, 0.44 for POPD/PLU-80/20, POPD/PLU-50/50, POPD/PLU-20/80 respectively (ESI Table S2†). The values of intrinsic viscosities of copolymers varied between the homopolymers. Among the copolymers, the highest
  was found to be 12
![[thin space (1/6-em)]](https://www.rsc.org/images/entities/char_2009.gif) 514 for the copolymer POPD/PLU-80/20 due to higher number of POPD units. Enhancement in the intrinsic viscosity was observed to be directly related to increment of molar mass but inversionally proportional to the polymerization yield (ESI Fig. S1†).
514 for the copolymer POPD/PLU-80/20 due to higher number of POPD units. Enhancement in the intrinsic viscosity was observed to be directly related to increment of molar mass but inversionally proportional to the polymerization yield (ESI Fig. S1†).
Confirmation of copolymerization by FTIR and 1H-NMR studies
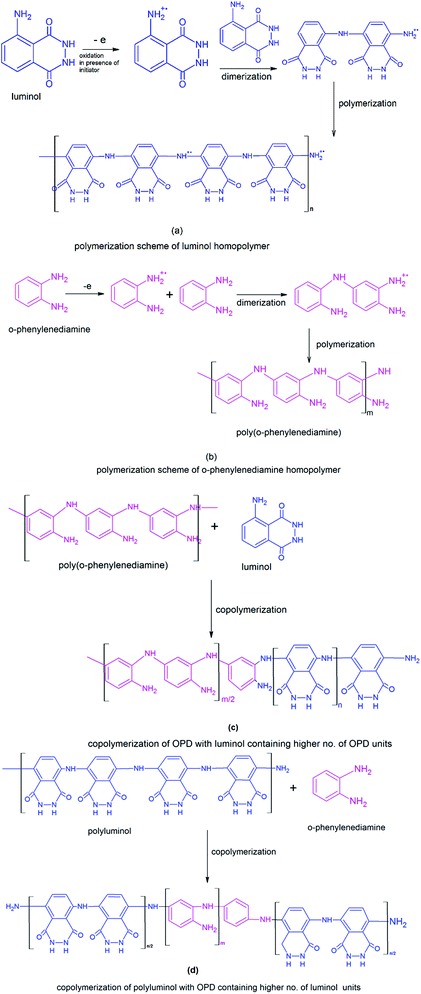
The 1H-NMR spectra of POPD, PLU and their copolymers are given in ESI, Fig. S2.† The NH protons of POPD were observed at δ = 6.9–7.9 ppm while the NH protons of PLU were noticed between δ = 7.4–8.5 ppm. The integrated areas of the NH protons of POPD (taken as 1/3) and PLU (taken as 1/4) were used for calculating their molar ratios in the copolymer. The calculated values were observed to be matching with the monomer feed ratios and therefore confirmed the copolymer composition (ESI, Table S3†).The monomer reactivity ratios calculated from Fineman–Ross parameters confirmed random copolymerization as shown in Scheme 1(a–d).37
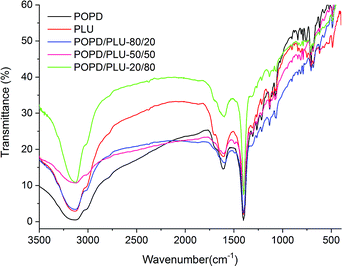
The IR spectrum of the homopolymer POPD, Fig. 1, showed N–H stretching vibration peak at 3134 cm−1 associated with the presence of secondary amine (–NH–).37 The peak noticed at 1610 cm−1 was correlated to imine stretching vibration while the peaks at 1402 cm−1 and 1351 cm−1 were designated to ring puckering of the quinonoid and benzenoid units respectively.
The peak observed at 1250 cm−1 was assigned to CN stretching vibration. The peaks noticed at 850 cm−1 and 720 cm−1 were associated with p-substituted benzene and C–H out-of plane bending vibrations of the phenazene skeleton respectively, which confirmed the polymerization of POPD.37,39 The benzenoid![[thin space (1/6-em)]](https://www.rsc.org/images/entities/char_2009.gif) :
:![[thin space (1/6-em)]](https://www.rsc.org/images/entities/char_2009.gif) quinonoid (B
quinonoid (B![[thin space (1/6-em)]](https://www.rsc.org/images/entities/char_2009.gif) :
:![[thin space (1/6-em)]](https://www.rsc.org/images/entities/char_2009.gif) Q) ratio was calculated to be 3.46 indicating greater number of quinonoid units. The homopolymer PLU exhibited NH stretching vibration peak at 3132 cm−1 while the peak at 1668 cm−1 was correlated to imine stretching vibration. The peaks associated with quinonoid and benzenoid rings puckering were observed at 1402 cm−1 and 1350 cm−1 respectively and the CN stretching vibration peak was noticed at 1230 cm−1. The B
Q) ratio was calculated to be 3.46 indicating greater number of quinonoid units. The homopolymer PLU exhibited NH stretching vibration peak at 3132 cm−1 while the peak at 1668 cm−1 was correlated to imine stretching vibration. The peaks associated with quinonoid and benzenoid rings puckering were observed at 1402 cm−1 and 1350 cm−1 respectively and the CN stretching vibration peak was noticed at 1230 cm−1. The B![[thin space (1/6-em)]](https://www.rsc.org/images/entities/char_2009.gif) :
:![[thin space (1/6-em)]](https://www.rsc.org/images/entities/char_2009.gif) Q ratio was found to be 2.94 in this case indicating greater number of quinonoid units. The IR spectrum of PLU was observed to be similar to that of POPD due to the structural similarities of the two polymers. The IR spectrum of POPD/PLU-80/20, Fig. 1, showed NH stretching vibration peak at 3154 cm−1, while the imine stretching peak appeared at 1668 cm−1. The quinonoid and benzenoid peaks were observed at 1598 cm−1 and 1402 cm−1 respectively and the B
Q ratio was found to be 2.94 in this case indicating greater number of quinonoid units. The IR spectrum of PLU was observed to be similar to that of POPD due to the structural similarities of the two polymers. The IR spectrum of POPD/PLU-80/20, Fig. 1, showed NH stretching vibration peak at 3154 cm−1, while the imine stretching peak appeared at 1668 cm−1. The quinonoid and benzenoid peaks were observed at 1598 cm−1 and 1402 cm−1 respectively and the B![[thin space (1/6-em)]](https://www.rsc.org/images/entities/char_2009.gif) :
:![[thin space (1/6-em)]](https://www.rsc.org/images/entities/char_2009.gif) Q ratio was calculated to be 2.41. The value was noticed to be intermediate of the homopolymers. The NH stretching vibration peak for POPD/PLU-50/50, Fig. 1, was observed at 3124 cm−1 revealing a shift of about 10 cm−1 as compared to that of pristine POPD whereas the imine stretching peak was noticed at 1633 cm−1. The B
Q ratio was calculated to be 2.41. The value was noticed to be intermediate of the homopolymers. The NH stretching vibration peak for POPD/PLU-50/50, Fig. 1, was observed at 3124 cm−1 revealing a shift of about 10 cm−1 as compared to that of pristine POPD whereas the imine stretching peak was noticed at 1633 cm−1. The B![[thin space (1/6-em)]](https://www.rsc.org/images/entities/char_2009.gif) :
:![[thin space (1/6-em)]](https://www.rsc.org/images/entities/char_2009.gif) Q ratio in this case was 1.65 which was lower than that of POPD/PLU-80/20. Similarly, POPD/PLU-20/80 showed the NH stretching vibration peak at 3134 cm−1 as noticed in POPD but the imine stretching peak was noticed at 1668 cm−1 which was comparable to the one observed in PLU. The B
Q ratio in this case was 1.65 which was lower than that of POPD/PLU-80/20. Similarly, POPD/PLU-20/80 showed the NH stretching vibration peak at 3134 cm−1 as noticed in POPD but the imine stretching peak was noticed at 1668 cm−1 which was comparable to the one observed in PLU. The B![[thin space (1/6-em)]](https://www.rsc.org/images/entities/char_2009.gif) :
:![[thin space (1/6-em)]](https://www.rsc.org/images/entities/char_2009.gif) Q ratio was observed to be 1.17 which was lowest among all the copolymers. The NH peak area (∫ad
Q ratio was observed to be 1.17 which was lowest among all the copolymers. The NH peak area (∫ad![[small nu, Greek, macron]](https://www.rsc.org/images/entities/char_e0ce.gif) ) value was found to be 1088 for POPD and 853 for PLU. The ∫ad
) value was found to be 1088 for POPD and 853 for PLU. The ∫ad![[small nu, Greek, macron]](https://www.rsc.org/images/entities/char_e0ce.gif) values for POPD/PLU-80/20, POPD/PLU-50/50 and POPD/PLU-20/80 were calculated to be 741, 568 and 380 respectively. The ∫ad
values for POPD/PLU-80/20, POPD/PLU-50/50 and POPD/PLU-20/80 were calculated to be 741, 568 and 380 respectively. The ∫ad![[small nu, Greek, macron]](https://www.rsc.org/images/entities/char_e0ce.gif) values were noticed to decrease with the increase in the PLU content. Likewise, the ∫ad
values were noticed to decrease with the increase in the PLU content. Likewise, the ∫ad![[small nu, Greek, macron]](https://www.rsc.org/images/entities/char_e0ce.gif) values for the imine stretching peak were observed to be 97 for POPD and 28 for PLU while for POPD/PLU-80/20, POPD/PLU-50/50 and POPD/PLU-20/80, they were observed to be 44, 52 and 25 respectively, showing a similar trend of decrease in the area with the increase in the PLU content as seen in case of the NH peak. It can therefore be concluded that copolymerization of POPD and PLU was observed to be composition dependent as the NH as well as the imine stretching peaks showed variation in the ∫ad
values for the imine stretching peak were observed to be 97 for POPD and 28 for PLU while for POPD/PLU-80/20, POPD/PLU-50/50 and POPD/PLU-20/80, they were observed to be 44, 52 and 25 respectively, showing a similar trend of decrease in the area with the increase in the PLU content as seen in case of the NH peak. It can therefore be concluded that copolymerization of POPD and PLU was observed to be composition dependent as the NH as well as the imine stretching peaks showed variation in the ∫ad![[small nu, Greek, macron]](https://www.rsc.org/images/entities/char_e0ce.gif) values which could be well correlated to the co-monomer content in the copolymer.
values which could be well correlated to the co-monomer content in the copolymer.
Influence of copolymerization on morphology confirmed by XRD and TEM studies
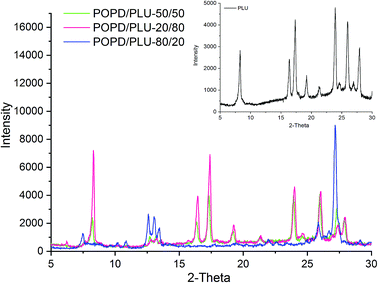
The XRD pattern of PLU (inset), Fig. 2, exhibited prominent peaks at 2θ = 7.5°, 16.3°, 18.2°, 19.8°, 21.2°, 24.3°, 26.2° and 28.3° revealing a highly crystalline structure. The planes observed at (020), (010), (100), (110) and (011) revealed a pseudo orthorhombic lattice type for the polymer.37 The XRD pattern of POPD has been reported in our previous work which revealed peaks at 2θ = 8.33°, 18.5°, 19.78°, 23.5° and 28.08° with limited planes at (010), (110) and (011).37The TEM of PLU, Fig. 3(a), revealed distorted cluster formation and the average size of the particles was observed to be 200 nm. The TEM of POPD, Fig. 3(b), showed distorted sea-shell like morphology and the particles were observed to have a dense core surrounded by thin layer of film. The copolymer POPO/PLU-80/20, Fig. 3(c), revealed a mixed morphology of dense hexagonal and sea-shell like particles matching those observed in case of pristine POPD. The copolymer POPO/PLU-50/50, Fig. 3(d), showed formation of compact spherical particles, with an average diameter of 160 nm while, the TEM of POPO/PLU-20/80, Fig. 3(e), showed formation of large spherical particles exhibiting an average diameter of 470 nm. A mixed morphology was observed for the copolymers depending upon the PLU/POPD content. The copolymers revealed peaks associated with both the homopolymers along with minor variations in the 2θ values of some of the peaks. All the peaks were found to be well disposed indicating a highly organized and crystalline morphology of the copolymers. POPD/PLU-80/20 displayed peaks corresponding to PLU of lowest intensity while the intensity for the peaks corresponding to POPD was pronounced.
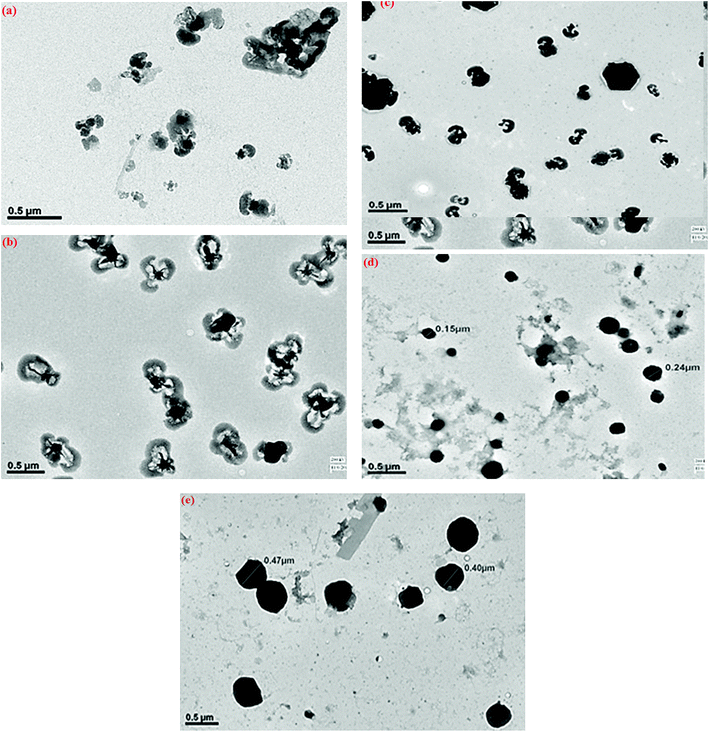 | ||
| Fig. 3 TEM micrographs of (a) POPD, (b) PLU, (c) POPD/PLU-80/20, (d) POPD/PLU-50/50and (e) POPD/PLU-20/80. | ||
Variation in the UV and fluorescence characteristics upon copolymerization
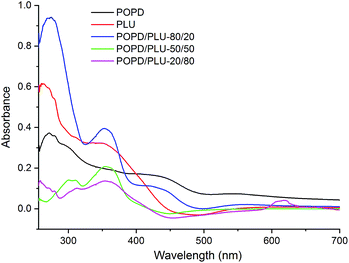
The UV-visible spectra of POPD, PLU and its copolymers are depicted in Fig. 4. The peaks observed at 280 nm and 425 nm for POPD were assigned to π–π* transition and polaronic transition respectively as reported in our previous studies.37 The peaks associated with similar transition were observed at 270 nm and 375 nm in PLU.37,38 Interestingly, the UV-visible spectra of copolymers revealed peaks corresponding to both POPD and PLU. POPD/PLU-80/20 copolymer revealed peaks at 280 nm, 375 nm and 425 nm confirming that the individual electronic states of the homopolymers were retained even after copolymerization.The intensity of the peaks corresponding to POPD was higher as compared to that of PLU confirming higher content of the former in the copolymer. Likewise, the UV spectrum of POPD/PLU-50/50 showed peaks at 300 nm, 375 nm confirming the presence of PLU in the copolymer.38 The peak at 425 nm associated with POPD was observed to be missing. Similarly in case of POPD/PLU-20/80, a broad hump was noticed at 350 nm and a small peak was noticed around 610 nm. For POPD/PLU-80/20, the ∫adν and the εM values were found to be 82.32 ± 0.03 and 1437 respectively while for copolymer POPD/PLU-50![[thin space (1/6-em)]](https://www.rsc.org/images/entities/char_2009.gif) :
:![[thin space (1/6-em)]](https://www.rsc.org/images/entities/char_2009.gif) 50, ∫adν and εM values were noticed to be 64.13 ± 0.01, 1077 respectively. The ∫adν and εM values for POPD/PLU-20/80 were found to be 40.73 ± 0.02 and 754 respectively. The oscillator strength was observed to be highest for pristine POPD. The oscillator strength decreased from 0.012 ± 0.03 to 0.0060 ± 0.03 as the copolymer composition of POPD/PLU varied from 80/20 to 20/80. Thus, the progressive change in the optical properties with the copolymer composition indicated random copolymerization (Table 1).
50, ∫adν and εM values were noticed to be 64.13 ± 0.01, 1077 respectively. The ∫adν and εM values for POPD/PLU-20/80 were found to be 40.73 ± 0.02 and 754 respectively. The oscillator strength was observed to be highest for pristine POPD. The oscillator strength decreased from 0.012 ± 0.03 to 0.0060 ± 0.03 as the copolymer composition of POPD/PLU varied from 80/20 to 20/80. Thus, the progressive change in the optical properties with the copolymer composition indicated random copolymerization (Table 1).
| Sample | λmax (nm) | ∫ad![[small nu, Greek, macron]](https://www.rsc.org/images/entities/char_e0ce.gif) integrated absorption coefficient, cm−2 integrated absorption coefficient, cm−2 |
Molar extinction coefficient (εM) (M−1 cm−1) | Oscillator strength |
|---|---|---|---|---|
| POPD | 425 | 142.46 ± 0.02 | 2515 | 0.022 ± 0.02 |
| PLU | 375 | 25.93 ± 0.03 | 323 | 0.004 ± 0.01 |
| POPD/PLU-80/20 | 425 | 82.32 ± 0.03 | 1437 | 0.012 ± 0.03 |
| POPD/PLU-50/50 | 375 | 64.13 ± 0.01 | 1077 | 0.009 ± 0.04 |
| POPD/PLU-20/80 | 610 | 40.73 ± 0.02 | 754 | 0.006 ± 0.03 |
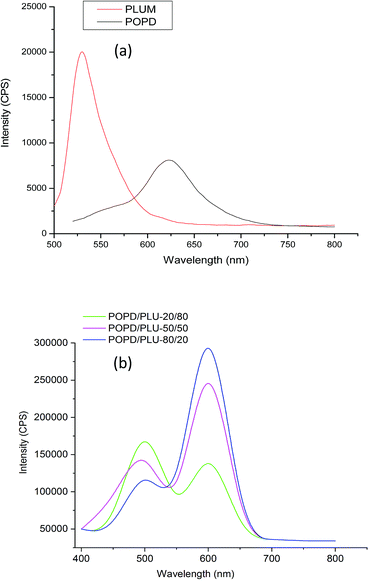
The fluorescence emission spectrum of POPD, Fig. 5(a), showed an intense broad peak centered at 620 nm upon excitation at 350 nm while the spectrum of PLU showed a pronounced peak at 525 nm at similar excitation wavelength which was attributed to S1 → S0 transition.37,39 The copolymers revealed broad emission peaks at 500 nm and 610 nm.
The intensity of the peak at 610 nm associated with POPD was observed to increase with the increase in the number of POPD units in the copolymer. For POPD/PLU-80/20, the emission peak at 500 nm peak associated with PLU was observed to be lower, while the peak related to POPD was noticed to have highest intensity among all the copolymers due to higher number of POPD units in this copolymer. The intensity of the 500 nm peak was observed to increase with the increase in the number of PLU units in the copolymer. The intensity of the emission peak at 500 nm was observed to be 110![[thin space (1/6-em)]](https://www.rsc.org/images/entities/char_2009.gif) 000 cps while the intensity for the emission peak at 610 nm was noticed to be 280
000 cps while the intensity for the emission peak at 610 nm was noticed to be 280![[thin space (1/6-em)]](https://www.rsc.org/images/entities/char_2009.gif) 000 cps. The copolymer POPD/PLU-50/50 revealed an emission intensity of 245
000 cps. The copolymer POPD/PLU-50/50 revealed an emission intensity of 245![[thin space (1/6-em)]](https://www.rsc.org/images/entities/char_2009.gif) 000 cps for the peak at 620 nm while the intensity of the emission peak at 500 was found to be 145
000 cps for the peak at 620 nm while the intensity of the emission peak at 500 was found to be 145![[thin space (1/6-em)]](https://www.rsc.org/images/entities/char_2009.gif) 000 cps. The copolymer POPD/PLU-20/80, showed emission intensities of 160
000 cps. The copolymer POPD/PLU-20/80, showed emission intensities of 160![[thin space (1/6-em)]](https://www.rsc.org/images/entities/char_2009.gif) 000 cps and 125
000 cps and 125![[thin space (1/6-em)]](https://www.rsc.org/images/entities/char_2009.gif) 000 cps for 500 nm and 610 nm peaks respectively. The Φ values were calculated by taking Rhodamine B (RhB) as reference, Table 2.
000 cps for 500 nm and 610 nm peaks respectively. The Φ values were calculated by taking Rhodamine B (RhB) as reference, Table 2.
| Sample | λEm (nm) | Integrated area (Isamp) | Quantum yield (Φ) |
|---|---|---|---|
| PLU | 525 | 3.57 × 10⁸ | 0.14 ± 0.05 |
| POPD | 620 | 2.42 × 10⁹ | 0.36 ± 0.03 |
| POPD/PLU-20/80 | 500 | 1.79 × 10⁸ | 0.12 ± 0.04 |
| 610 | 2.34 × 10⁷ | 0.22 ± 0.06 | |
| POPD/PLU-50/50 | 500 | 2.14 × 10⁸ | 0.10 ± 0.05 |
| 610 | 2.18 × 10⁸ | 0.31 ± 0.03 | |
| POPD/PLU-80/20 | 500 | 1.34 × 10⁸ | 0.09 ± 0.04 |
| 610 | 2.32 × 10⁹ | 0.34 ± 0.02 |
For POPD, the ∫adν value of the emission peak at 620 nm was calculated to be 2.42 × 10⁹ and the Φ value was found to be 0.36 ± 0.03. Similarly for PLU, the ∫adν for the emission peak at 525 nm was calculated to be 3.57 × 10⁸ and the Φ value was found to be 0.14 ± 0.05. The ∫adν value for the emission peak at 500 nm in case of POPD/PLU-20/80 was found to be 1.79 × 10⁸ while for the peak at 610 nm, it was calculated to be 2.34 × 10⁷. The Φ values were calculated as 0.12 ± 0.04 and 0.22 ± 0.06 corresponding to the emission peaks observed at 500 nm and 610 nm respectively. The copolymers POPD/PLU-50/50 and POPD/PLU-80/20 showed ∫adν values 2.14 × 10⁸, 2.18 × 10⁸, 1.34 × 10⁸ and 2.32 × 10⁹ for the peaks at 500 nm and 610 nm respectively while the Φ values were found to be 0.10 ± 0.05, 0.31 ± 0.03, 0.09 ± 0.04 and 0.34 ± 0.02 respectively. The variation in the fluorescence intensity matched well with the ∫adν values. As the ratio of POPD in the copolymer increased, quantum yield increased from 0.22 ± 0.06 to 0.34 ± 0.02. Quantum yield of POPD as well as PLU were noticed to be proportional to their ratios in the copolymer. Hence, composition dependant fluorescence properties were attained upon varying the loading of POPD as well as PLU.
Confocal studies
The confocal analysis of the homopolymers and copolymers was carried out in solution state and is shown in Fig. 6. The confocal micrograph of PLU, Fig. 6(a), showed intense blue coloured particles. The fluorescence emission spectrum of PLU also revealed an emission peak around 525 nm. POPD was noticed to emit intense red coloured tiny particles as the polymer revealed fluorescence emission peak at 620 nm, Fig. 6(b). | ||
| Fig. 6 Confocal micrographs of (a) PLU, (b) POPD, (c) POPD/PLU-80/20, (d) POPD/PLU-50/50, (e) POPD/PLU-20/80. | ||
The copolymer POPD/PLU/80/20, Fig. 6(c), revealed intense red coloured particles with a blue region of PLU particles. Similarly, POPD/PLU-50/50, Fig. 6(c) and POPD/PLU-20/80, Fig. 6(d) showed the presence of intense red nanoparticles which could be correlated to POPD while the PLU region was found to blue in colour. The morphology was found to consist of densely distributed aggregates of irregularly shaped fine particles of POPD dispersed in the PLU matrix. The regions of red and blue emission by the particles were found to vary with the composition of the copolymer which clearly confirmed that the homopolymers retained their photo = physical properties even upon copolymerization.
Cytotoxicity and imaging of tumor cells
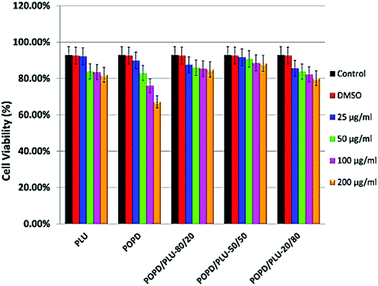
HeLa cells were used to examine cellular toxicity, which included normal as well as tumor cells. The effects of homopolymers and copolymers on cell viability and proliferation were measured using the MTT assay, which is based on the reduction of the yellow tetrazolium salt MTT by metabolically active cells, resulting in purple formazan crystals. Among the homopolymers, neither PLU nor POPD revealed any toxic effect over the concentration range of 25–50 μg ml−1. Interestingly, the copolymers did not reveal any toxic effect up to the concentration of 200 μg ml−1, Fig. 7. Only in case of pure POPD, the concentration of 200 μg ml−1 showed to slightly block the cell viability. The cytotoxicity of the homopolymers as well as copolymers was observed to be time independent.The copolymers were found to be non-toxic at concentrations as high as 200 μg ml−1 in all tested cell lines. The copolymer POPD/PLY-50/50 showed results quite comparable to the control group. The tumor cell lines clearly appeared to be able to tolerate exposure to copolymers through high metabolic activity during in vitro cytotoxicity tests and revealed capability of maintaining their cell proliferation and membrane integrity during exposure to higher dosages of copolymers.
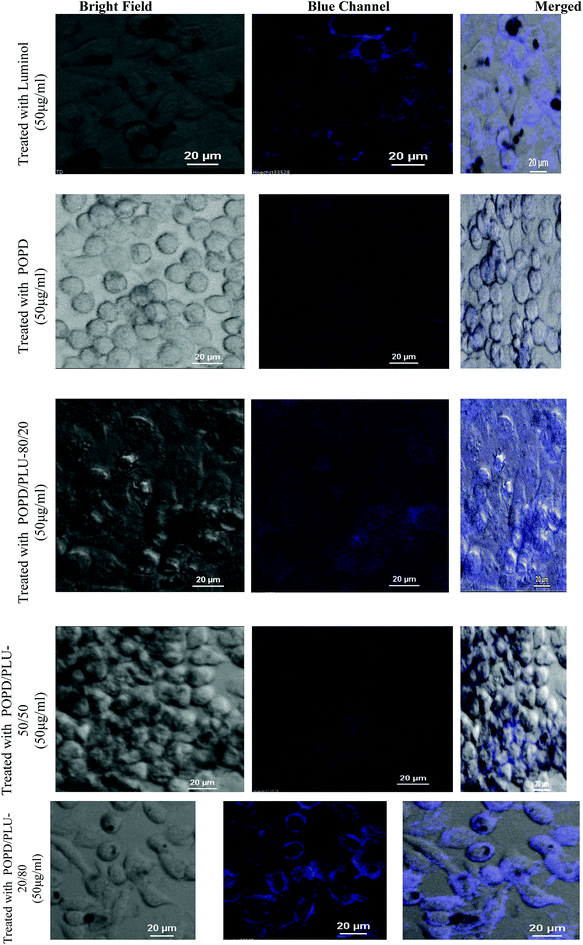
The cellular uptake of POPD, PLU and its copolymers by the HeLa cells was visualized via confocal microscopic imaging, Fig. 8. The studies revealed that blue luminescence was observed by the HeLa cells treated with homopolymers as well as copolymers for a period of 4 h, Fig. 8. Furthermore, the internalization of the pristine polymers and copolymers after 4 h of treatment was clearly observed in case of HeLa cells, which showed high expression levels. An intensive fluorescence signal was observed on the surface and in the cytoplasm of the HeLa cells after treatment with the PLU and POPD/PLU-20/80. In contrast, only slight fluorescence signals were observed in the HeLa cells under similar experimental conditions using POPD and copolymers containing higher POPD content. These results demonstrated the effective targeting specificity of the copolymers containing higher PLU content towards HeLa cells. To get a better insight, time-dependent confocal microscopy studies were carried out for POPD, PLU and POPD/PLU-20/80 treated HeLa cells. It was observed that the copolymer POPD/PLU-20/80 showed a better contrast even after 24 h (ESI Fig. S3†). The time dependent confocal analysis confirmed that PLU and POPD/PLU-20/80 could be used as a novel fluorescent indicator to study the absorption, transportation processes inside the mammalian cells.
Conclusion
Microwave-assisted copolymerization of o-phenylenediamine with luminol was successfully carried out using different weight ratios of the two monomers. 1H-NMR studies confirmed random copolymerization while UV-visible and fluorescence studies showed composition dependant photo-physical properties. X-ray diffraction (XRD) and transmission electron microscopy (TEM) analyses confirmed the morphology of copolymers to be dependent on the ratio of the two monomers in the copolymer. Confocal analysis also revealed composition dependant emission of the copolymers which was found to be intense red/blue depending upon the content of POPD/PLU in the copolymer. MTT assay studies confirmed that the homopolymers as well as the copolymers were non-toxic and could be safely used for in vivo imaging of cancer cells. The confocal images of the homopolymers/copolymer modified HeLa cells revealed blue luminescence and the internalization of PLU and POPD/PLU-20/80 showed high expression levels which could be used as an efficient nanoprobe for imaging of various kinds of tumors.Conflicts of interest
On behalf of all authors, the corresponding author states that there is no conflict of interest.Acknowledgements
The corresponding author Dr Ufana Riaz acknowledges the Department of Science and Technology (DST)-Science and Engineering Research board DST-SERB, India vide sanction no. SB/S-1/PC-070-2013 for granting major research project. One of the co-authors Mrs Sapana Jadoun is thankful to DST-SERB for granting Senior Research Fellowship under the said project. The authors also acknowledge the SAIF Facility at All India Institute of Medical Sciences (AIIMS), New Delhi, India for TEM analysis. The authors sincerely acknowledge support of Dr Prabhat at the Advance Instrument Research Facility (AIRF), Jawaharlal Nehru University (JNU) for carrying out the live cell imaging analysis.References
- Z. Ge and S. Liu, Functional block copolymer assemblies responsive to tumor and intracellular microenvironments for site-specific drug delivery and enhanced imaging performance, Chem. Soc. Rev., 2013, 42, 7289–7325 RSC.
- L. Zhu and V. P. Torchilin, Stimulus-responsive nano preparations for tumor targeting, Integr. Biol., 2013, 5, 96–107 RSC.
- P. Zhao, Q. X. u, J. Tao, Z. Jin, Y. Pan, C. Yu and Z. Yu, Near infrared quantum dots in biomedical applications: current status and future perspective, Wiley Interdiscip. Rev.: Nanomed. Nanobiotechnol., 2017, 10, e1483 Search PubMed.
- Y. Yang, X. Wang, G. Liao, X. Liu, Q. Chen, H. Li, L. Lu, P. Zhao and Z. Yui, iRGD-decorated red shift emissive carbon nanodots for tumor targeting fluorescence imaging, J. Colloid Interface Sci., 2018, 509, 515–521 CrossRef CAS PubMed.
- C. F. Wu and D. T. Chiu, Highly fluorescent semiconducting polymer dots for biology and medicine, Angew. Chem., Int. Ed., 2013, 52, 2–26 Search PubMed.
- L. L. Yang, F. F. An, Z. Liu, X. J. Zhang, M. J. Zhou, W. Li, X. J. Hao, C. S. Lee and X. H. Zhang, Ultrabright and ultrastable near-infrared dye nanoparticles for in vitro and in vivo bioimaging, Biomaterials, 2012, 33, 7803–7809 CrossRef PubMed.
- U. Riaz and S. M. Ashraf, Fluorescence bioimaging with applications to chemistry, in Computational Optical Biomedical Spectroscopy and Imaging, CRC Press, 2015 Search PubMed.
- X. Gao, Y. Cui, R. M. Levenson, L. W. K. Chung and S. Nie, In vivo cancer targeting and imaging with semiconductor quantum dots, Nat. Biotechnol., 2004, 22, 969–976 CrossRef CAS PubMed.
- G. Libralato, E. Galdiero, A. Falang, R. Carotenuto, E. de Alteriis and M. Guida, Toxicity Effects of Functionalized Quantum Dots, Gold and Polystyrene Nanoparticles on Target Aquatic Biological Models: A Review, Molecules, 2017, 22(9), 1439–1455 CrossRef PubMed.
- A. J. Hackettab, J. Malmströmb and J. T. Sejdica, Functionalization of conducting polymers for biointerface applications, Prog. Polym. Sci., 2017, 70, 18–33 CrossRef.
- D. Mantione, I. Agua, A. S. Sanchez and D. Mecerreyes, Poly(3,4-ethylenedioxythiophene) (PEDOT) Derivatives: Innovative Conductive Polymers for Bioelectronics, Polymers, 2017, 9(8), 354–385 CrossRef.
- T. Cantu, K. Walsh, V. P. Pattani, A. J. Moy, J. W. Tunnell, J. Irvin and T. Betancourt, Conductive polymer-based nanoparticles for laser-mediated photothermal ablation of cancer: synthesis, characterization, and in vitro evaluation, Int. J. Nanomed., 2017, 12, 615–663 CrossRef CAS PubMed.
- J. Shan and Z. Ma, A review on amperometric immunoassays for tumor markers based on the use of hybrid materials consisting of conducting polymers and noble metal nanomaterials, Microchim. Acta, 2017, 184(4), 969–979 CrossRef CAS.
- X. Yue, Q. Zhang and Z. Dai, Near-infrared light-activatable polymeric nanoformulations for combined therapy and imaging of cancer, Adv. Drug Delivery Rev., 2017, 115, 155–170 CrossRef CAS PubMed.
- B. Muthuraj, S. Mukherjee, C. R. Patra and P. K. Iyer, Amplified Fluorescence from Polyfluorene Nanoparticles with Dual State Emission and Aggregation Caused Red Shifted Emission for Live Cell Imaging and Cancer Theranostics, ACS Appl. Mater. Interfaces, 2016, 8(47), 32220–32229 CrossRef CAS PubMed.
- M. C. MacNeill, E. M. Wailes and N. H. L. Polyachenko, A Comparative Study of the Photothermal Efficiency of Electrically Conducting Poly(3,4-ethylenedioxythiophene)-Based Nanomaterials with Cancer Cells, J. Nanosci. Nanotechnol., 2013, 13(6), 3784–3791 CrossRef PubMed.
- D. Samanta, N. H. Nassab, A. D. McCartya and R. N. Zare, Ultra-low voltage triggered release of an anti-cancer drug from polypyrrole nanoparticles, Nanoscale, 2018, 10, 9773–9779 RSC.
- Z. Long, L. Mao, M. Liu, Q. Wan, Y. Wan, X. Zhang and Y. Wei, Marrying multicomponent reactions and aggregation-induced emission (AIE): new directions for fluorescent nanoprobes, Polym. Chem., 2017, 8, 5644–5654 RSC.
- X. Zhang, Z. Ma, Y. Yang, X. Zhang, X. Jia and Y. Wei, Fine tuning the mechano-fluorochromic properties of benzothiadiazole -cored cyano-substituted diphenylethene derivatives through D–A effect, J. Mater. Chem. C, 2014, 2, 8932–8938 RSC.
- Y. Dong, J. W. Lam, A. Qin, J. Liu, Z. Li, B. Z. Tang, J. Sun and H. S. Kwok, Aggregation-Induced Emissions of Tetraphenylethene Derivatives and Their Utilities as Chemical Vapor Sensors and in Organic Light-Emitting Diodes, Appl. Phys. Lett., 2007, 91, 011111 CrossRef.
- H. Tong, Y. Hong, Y. Dong, M. Häußler, J. W. Lam, Z. Li, Z. Guo, Z. Guo and B. Z. Tang, Fluorescent “light-up” bioprobes based on tetraphenylethylene derivatives with aggregation-induced emission characteristics, Chem. Commun., 2006, 3705–3707 RSC.
- L. Wang, B. Xu, J. Zhang, Y. Dong, S. Wen, H. Zhang and W. Tian, Theoretical investigation of electronic structure and charge transport property of 9,10-distyrylanthracene(DSA) derivatives with high solid-state luminescent efficiency, Phys. Chem. Chem. Phys., 2013, 15, 2449–2458 RSC.
- Z. Wang, K. Ma, B. Xu, X. Li and W. Tian, A highly sensitive “turn-on” fluorescent probe for bovine serum albumin protein detection and quantification based on AIE-active distyrylanthracene derivative, Sci. China: Chem., 2013, 56, 1234–1238 CrossRef CAS.
- Y. Zhang, J. Huang, L. Kong, Y. Tian and J. Yang, Two novel AIEE-active imidazole/α-cyanostilbene derivatives: photo-physical properties, reversible fluorescence switching, and detection of explosives, CrystEngComm, 2018, 20, 1237–1244 RSC.
- X. He, G.-B. Zhang, Z.-X. Chi, P.-F. Dai, J.-Y. Huang and J.-X. Yang, Terpyridine functionalized α-cyanostilbene derivative as excellent fluorescence and naked eyes Fe2+ probe in aqueous environment, Chem. Pap., 2017, 71(11), 2209–2221 CrossRef CAS.
- Y. Yang, Q. Chen, S. Li, W. Ma, G. Yao, F. Ren, Z. Cai, P. Zhao, G. Liao, J. Xiong and Z. Yu, iRGD-Mediated and Enzyme-Induced Precise Targeting and Retention of Gold Nanoparticles for the Enhanced Imaging and Treatment of Breast Cancer, J. Biomed. Nanotechnol., 2018, 14, 1396–1408 CrossRef CAS PubMed.
- L. Esser, N. P. Truong, B. Karagoz, B. A. Moffat, C. Boyer, J. F. Quinn, M. R. Whittaker and T. P. Davis, Gadolinium-Functionalized Nanoparticles for Application as Magnetic Resonance Imaging Contrast Agents via Polymerization-Induced Self-Assembly, Polym. Chem., 2016, 7, 7325–7337 RSC.
- S. Y. Khor, M. N. Vu, E. H. Pilkington, A. P. R. Johnston, M. R. Whittaker, J. F. Quinn, N. P. Truong and T. P. Davis, Elucidating the Influences of Size, Surface Chemistry, and Dynamic Flow on Cellular Association of Nanoparticles Made by Polymerization-Induced Self-Assembly, Small, 2018, 14(34), e1801702 CrossRef PubMed.
- E. T. Garrett, Y. Pei and A. B. Lowe, Microwave-assisted synthesis of block copolymer nanoparticles via RAFT with polymerization induced self-assembly in methanol, Polym. Chem., , 2016, 7, 297–301 Search PubMed.
- F. Fan, C. Cai, L. Gao, J. Li, P. Zhang, G. Li, C. Li and G. Yu, Microwave-assisted synthesis of glycopolymers by ring-opening metathesis polymerization (ROMP) in an emulsion system, Polym. Chem., 2017, 8, 6709–6719 RSC.
- U. Riaz, S. Jadoun, P. Kumar, M. Arish, A. Rub and S. M. Ashraf, Influence of Luminol Doping of Poly(o-phenylenediamine) on the Spectral, Morphological, and Fluorescent properties: A Potential Fluorescent Marker for Early detection and Diagnosis of Leishmania donovani, ACS Appl. Mater. Interfaces, 2017, 9(38), 33159–33168 CrossRef CAS PubMed.
- S. Jadoun, V. Sharma, S. M. Ashraf and U. Riaz, Sonolytic doping of poly(1-naphthylamine) with luminol: influence on spectral, morphological and fluorescent characteristics, Colloid Polym. Sci., 2017, 295(4), 715–724 CrossRef CAS.
- Y. P. Dong, J. Wang, Y. Peng and J. J. Zhu, A Novel Aptasensor for Lysozyme based on Electrogenerated Chemiluminescence Resonance Energy Transfer Between Luminol and Silicon Quantum Dots, Biosens. Bioelectron., 2017, 94, 530–535 CrossRef CAS PubMed.
- P. Khan, D. Idrees, M. A. Moxley, J. A. Corbett, F. Ahmad, G. Figura, W. S. Sly, A. Waheed and M. I. Hassan, Luminol Based Chemiluminescent Signals: Clinical and Non-Clinical Application and Future Uses, Appl. Biochem. Biotechnol., 2014, 173(2), 333–355 CrossRef CAS PubMed.
- S. Samanta, P. Roy and P. Kar, Synthesis of poly(o-phenylenediamine) nanofiber with novel structure and properties, Polym. Adv. Technol., 2017, 28(7), 797–804 CrossRef CAS.
- J. L. O. Martínez, B. I. F. Mancilla, A. V. Rios and E. A. Z. Contreras, Poly(ortho-phenylenediamine-co-aniline) based copolymer with improved capacitance, J. Power Sources, 2017, 366, 233–240 CrossRef.
- S. Jadoun, S. M. Ashraf and U. Riaz, Tuning the spectral, thermal and fluorescent properties of conjugated polymers via random copolymerization of hole transporting monomers, RSC Adv., 2017, 7, 32757–32768 RSC.
- S. Jadoun, S. M. Ashraf and U. Riaz, Microwave-assisted synthesis of copolymers of luminol with anisidine: Effect on spectral, thermal and fluorescence characteristics, Polym. Adv. Technol., 2018, 29(2), 1007–1017 CrossRef CAS.
- U. Riaz, S. M. Ashraf, S. Aleem, V. Budhiraja and S. Jadoun, Microwave-Assisted Green Synthesis of Some Nanoconjugated Copolymers: Characterisation and Fluorescence Quenching Studies with Bovine Serum Albumin, New J. Chem., 2016, 40, 4643–4653 RSC.
- R. Kumar and A. B. Tiku, Galangin induces cell death by modulating the expression of glyoxalase-1 and Nrf-2 in HeLa cells, Chem.-Biol. Interact., 2018, 279(5), 1–9 CrossRef PubMed.
Footnote |
| † Electronic supplementary information (ESI) available. See DOI: 10.1039/c8ra08373h |
| This journal is © The Royal Society of Chemistry 2018 |

