
 Open Access Article
 This Open Access Article is licensed under a Creative Commons Attribution-Non Commercial 3.0 Unported Licence
Luminescence properties of ZnGa2O4:Cr3+,Bi3+ nanophosphors for thermometry applications†
E. Glais ab,
M. Pellerinab,
V. Castaingb,
D. Alloyeauc,
N. Touatib,
B. Viana*b and
C. Chanéac*a
ab,
M. Pellerinab,
V. Castaingb,
D. Alloyeauc,
N. Touatib,
B. Viana*b and
C. Chanéac*a
aSorbonne Université, CNRS, Collège de France, Laboratoire de Chimie de la Matière Condensée de Paris, 4 Place Jussieu, 75005 Paris, France. E-mail: corinne.chaneac@sorbonne-universite.fr
bPSL Research University, IRCP, Chimie ParisTech, CNRS, 11 rue P. et M. Curie, 75231 Paris cedex 05, France. E-mail: bruno.viana@chimie-paristech.fr
cUniversité Paris Diderot, CNRS, Laboratoire Matériaux et Phénomènes Quantiques (MPQ) 10 rue Alice Domon et Léonie Duquet, 75205 Paris cedex 13, France
First published on 14th December 2018
Abstract
Chromium(III) and bismuth(III) co-doped ZnGa2O4 nanoparticles are synthesized by a hydrothermal method assisted by microwave heating. The obtained nanoparticles, with a diameter smaller than 10 nm, present good luminescence emission in the deep red range centered at 695 nm after coating with a silica layer and calcination at 1000 °C during 2 h. Persistent luminescence and photoluminescence properties are investigated at several temperatures. Bandwidth and luminescence intensity ratio of persistent emission do not present enough change with temperature to obtain a competitive nanothermometer with high sensitivity. Nevertheless, persistent luminescence decay curves present a significant shape change since the trap levels involved in the deexcitation mechanism are unfilled with increase of temperature. Even if the sensitivity reaches 1.7% °C−1 at 190 °C, the repeatability is not optimal. Furthermore, photoluminescent lifetime in the millisecond range extracted from the photoluminescence decay profiles drastically decreases with temperature increase. This variation is attributed to the thermal equilibrium between two thermally coupled chromium(III) levels (2E and 4T2) that have very different deexcitation lifetimes. For ZnGa2O4:Cr3+0.5%,Bi3+0.5%, the temperature sensitivity reaches 1.93% °C−1 at 200 °C. Therefore, this kind of nanoparticle is a very promising thermal sensor for temperature determination at the nanoscale.
Introduction
The precise measure and control of temperature are key parameters in many fields including medicine, aeronautics, electronics, and catalysis. A non-contact, and non-invasive measurement is possible thanks to the use of luminescent thermometers. Many luminescent compounds have been studied with respect to the variation of their luminescent properties according to temperature like organic1,2 and polymer3 species, quantum dots,4–6 nanomaterials based on lanthanide ions7–9 or transition metal ions.10 These nanosized sensors are very attractive since they allow a temperature determination at the nanoscale.11,12 Thus, temperature variation at the cellular scale could be detectable as well as non-destructive temperature control in micro-electronic devices. Candidates for thermal sensors should present a high emission brightness and a high thermal sensitivity. Several luminescence parameters can be observed and may vary according to the temperature such as intensity, lifetime, bandwidth, or spectral position.13,14ZnGa2O4:Cr3+0.5%,Bi3+0.5% nanoparticles (NPs) presented in this paper have persistent luminescence properties. These NPs are able to emit light several minutes or even hours after stopping the excitation. Because of their emission in the biological window of tissue transparency (λ = 695 nm) due to chromium transition from 2E excited state to 4A2 ground state, this particles are also studied for in vivo bio-imaging applications.15–19 It has already been demonstrated on bulk material20,21 but also at nanosize,22,23 that persistent luminescence properties can be improved by adding bismuth codopant in the matrix.
Only few recent works have studied the persistent luminescence properties variation with temperature for thermometry applications. Martin Rodriguez et al.24 have investigated Sr4Al14O25:Eu3+,Cr3+,Nd3+ as nanosensor using the luminescence intensity ratio method. This sensor, emitting in the first biological window, display a relative sensitivity close to 0.75% °C−1. Yang et al.25 also presented a ratiometric afterglow based on zinc gallogermanate sensor doped with chromium. In the present work, we propose to demonstrate the potentiality of ZnGa2O4:Cr3+0.5%,Bi3+0.5%@SiO2 nanoparticles calcined 2 h at 1000 °C (ZGO-cal-NPs) as temperature sensor. NPs are synthesized by hydrothermal way assisted by microwave heating. We first discuss the temperature influence on the persistent luminescence properties after excitation in the UV range. The ratiometric method is not the only usable approach for this kind of sensor but we also enlarge our analysis to the bandwidth variation and persistent lifetime variation versus temperature. Then the photoluminescence lifetime variation after pulsed excitation at 430 nm is investigated giving outstanding results.
Experimental
ZnGa2O4:Cr3+,Bi3+ nanoparticles are obtained using hydrothermal synthesis assisted by microwave heating followed by calcination in air. ZnCl2 (≥98%), GaCl3 (≥99.999%), CrCl3·6H2O (≥98%) and Bi(NO3)3·5H2O (99![[thin space (1/6-em)]](https://www.rsc.org/images/entities/char_2009.gif) 999%) were purchased from Sigma Aldrich as starting materials. Zinc, gallium, chromium and bismuth salts solutions are dissolved and mixed in 20 mL of water in stoichiometric proportions to get the nominal composition ZnGa2O4:Cr3+(0.5%),Bi3+(0.5%). The dopant concentration is expressed in atomic percentages with respect to Ga3+ ions rate. The pH of the resulting solution is adjusted to 8 using a 4 M solution of sodium hydroxide. The obtained precipitated solution is then transferred in a microwave teflon-lined reactor (Anton Paar, micro-wave Synthos 3000) for 1 h heat treatment under microwave irradiation at 200 °C. The compound is washed several times with water and dried under air. To avoid sintering during the thermal treatment, the nanoparticles are embedded in a silica layer using a sol–gel chemistry way. A mixture of TEOS:EtOH 1:5 is added to a basic solution of nanoparticles (C = 5.3 mg mL−1). After stirring overnight, the solution is washed several times with water and dried under air. The obtained ZnGa2O4:Cr3+,Bi3+@SiO2 nanoparticles are then calcined in air 2 h at 1000 °C using a 10 °C per minute ramp.
999%) were purchased from Sigma Aldrich as starting materials. Zinc, gallium, chromium and bismuth salts solutions are dissolved and mixed in 20 mL of water in stoichiometric proportions to get the nominal composition ZnGa2O4:Cr3+(0.5%),Bi3+(0.5%). The dopant concentration is expressed in atomic percentages with respect to Ga3+ ions rate. The pH of the resulting solution is adjusted to 8 using a 4 M solution of sodium hydroxide. The obtained precipitated solution is then transferred in a microwave teflon-lined reactor (Anton Paar, micro-wave Synthos 3000) for 1 h heat treatment under microwave irradiation at 200 °C. The compound is washed several times with water and dried under air. To avoid sintering during the thermal treatment, the nanoparticles are embedded in a silica layer using a sol–gel chemistry way. A mixture of TEOS:EtOH 1:5 is added to a basic solution of nanoparticles (C = 5.3 mg mL−1). After stirring overnight, the solution is washed several times with water and dried under air. The obtained ZnGa2O4:Cr3+,Bi3+@SiO2 nanoparticles are then calcined in air 2 h at 1000 °C using a 10 °C per minute ramp.
X-ray diffraction patterns are obtained by powder X-ray diffraction (PW-XRD) using a Bruker D8 Advance diffractometer with Cu-Kα radiation (λ = 1.5406 Å) at 30 kV and 40 mA, 0.0017° 2θ step size and 1 s step time over 10 to 70° – 2θ. Transmission electron microscopy (TEM) pictures are taken thanks to a Technai G2 Spirit apparatus. Carbon coated with copper TEM grids are used, after evaporation of one drop of nanoparticle suspension in ethanol. High Resolution TEM were performed using an aberration-corrected JEOL ARM microscope operated at 80 kV. Continuous Wave Electronic Paramagnetic Resonance (CW-EPR) measurements were performed on X-Band with Bruker ELEXSYS E500 spectrometer, operating at 9.8 GHz and under non saturated conditions at room temperature. Persistent luminescence decays and emission spectra are registered after respectively 2 minutes and 5 minutes excitation with 6 W mercury lamp (Vilber Lourmat) at 254 nm. Signal is collected after switching off the excitation using a Roper Pixis 100 CCD camera coupled to an Acton SpectraPro monochromator. Monochromator slit is kept at 1 mm for these experiments, in order to get an optimal signal with a resolution of 2.3 nm. Thermally stimulated luminescence measurements are also registered after 5 min excitation with 6 W mercury lamp at 254 nm at 0 °C then the system is cooling down to −70 °C. A sumitomo cryogenics cryogenerator and a LakeShore temperature controller are used. The registration start at −70 °C until 300 °C using the same detector as for persistent luminescence set-up. Photoluminescence decay spectra are obtained after an excitation provided by an Optical Parametric Oscillator (OPO) YAG:Nd pulsed laser (EKSPLA 342B) and recorded via a photomultiplier coupled to an oscilloscope.
Results and discussion
The PW-XRD pattern shown in Fig. 1 reveals the formation, after the microwave (in purple) synthesis, of a pure cubic spinel phase of ZnGa2O4 with a Fd![[3 with combining macron]](https://www.rsc.org/images/entities/char_0033_0304.gif) m (Oh7) space group. The Zn2+ ions occupy the tetrahedral sites of the structure and the Ga3+ the octahedral sites. The ZnGa2O4 matrix is a good host for Cr3+ (0.63 Å) as it can substitute Ga3+ (0.62 Å) ions as well as Bi3+ (1.03 Å).
m (Oh7) space group. The Zn2+ ions occupy the tetrahedral sites of the structure and the Ga3+ the octahedral sites. The ZnGa2O4 matrix is a good host for Cr3+ (0.63 Å) as it can substitute Ga3+ (0.62 Å) ions as well as Bi3+ (1.03 Å).
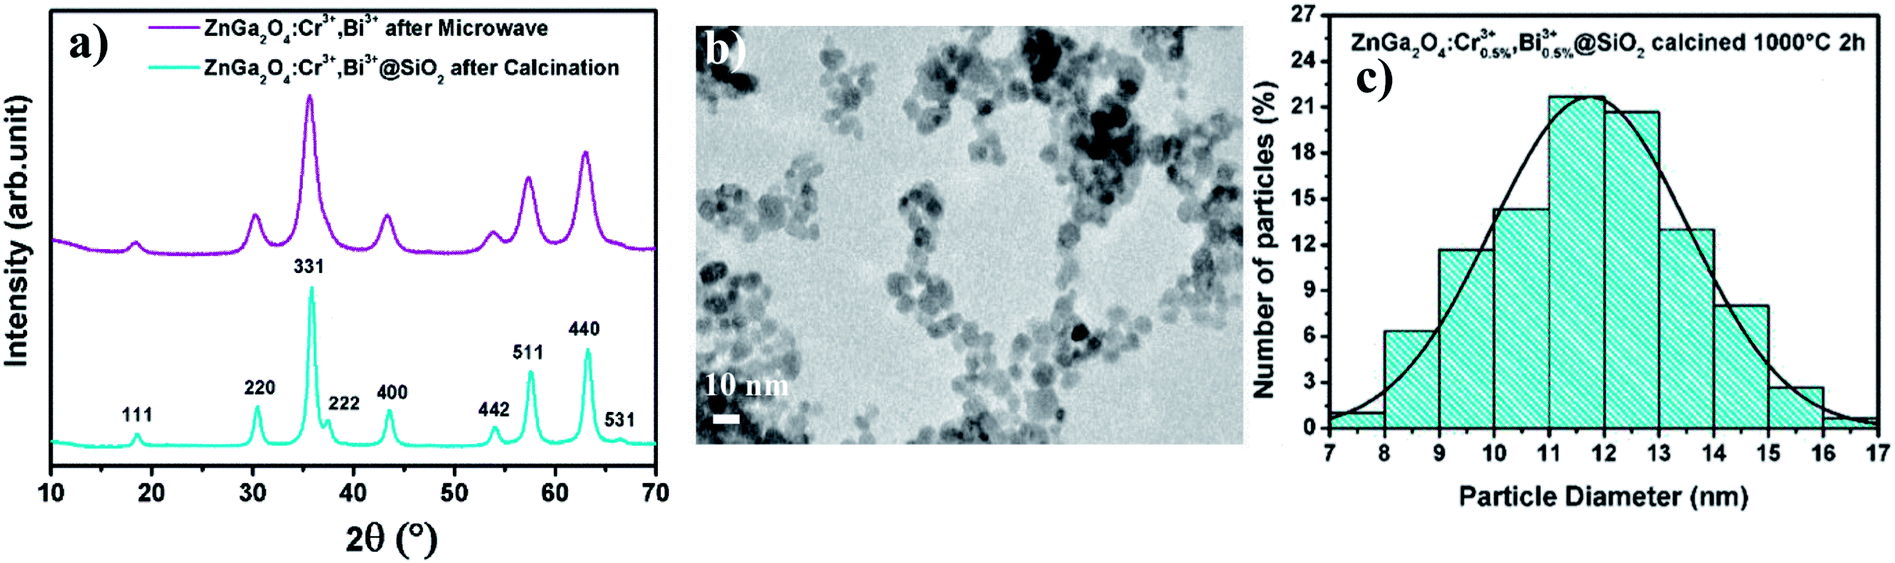 | ||
| Fig. 1 (a) XRD patterns of ZGO-MW-NPs (in purple) and ZGO-cal-NPs (in blue) (JCPDS 38-1240) (b) TEM image of ZGO-MW-NPs. (c) Distribution diagram of ZGO-cal-NPs. | ||
The size of particles after microwave treatment (ZGO-MW-NPs) can be estimated thanks to Scherrer's calculation to be 5.9 ± 0.1 nm with a lattice parameter of 8.36 Å, which is in good agreement with TEM images shown in Fig. 1b. The nanoparticles are monodisperse with a sub-10 nm size (average diameter: 6.1 ± 0.5 nm). After calcination, ZGO-cal-NPs are also characterized by XRD (Fig. 1, blue). Nanoparticle's size slightly increases to 11.7 ± 1.9 nm and the lattice parameter decreases to 8.32 Å, traducing a local order improvement in the structure. The distribution diagram shown Fig. 1c is plotted from 300 randomly selected particles. A proof of such local order improvement can be highlighted by EPR spectroscopy. Fig. 2 shows EPR spectra of ZnGa2O4:Cr3+,Bi3+ nanoparticles after microwave (ZGO-MW-NPs, in purple) and after silica coating prior to the calcination step (ZGO-cal-NPs, in blue). After microwave treatment, EPR signal is composed by several chromium species closed to defects with only a small fraction of chromium in non-distorted symmetry. After calcination, the EPR signal shows peaks well defined and sharp, which is comparable to spectra obtained in bulk materials synthesized by solid state reaction.26 Hence, trivalent chromium transitions are characteristic to those obtained in a well ordered material. It appears that, trivalent chromium is very sensitive to its local environment, and is thus a very good local probe of disorder.
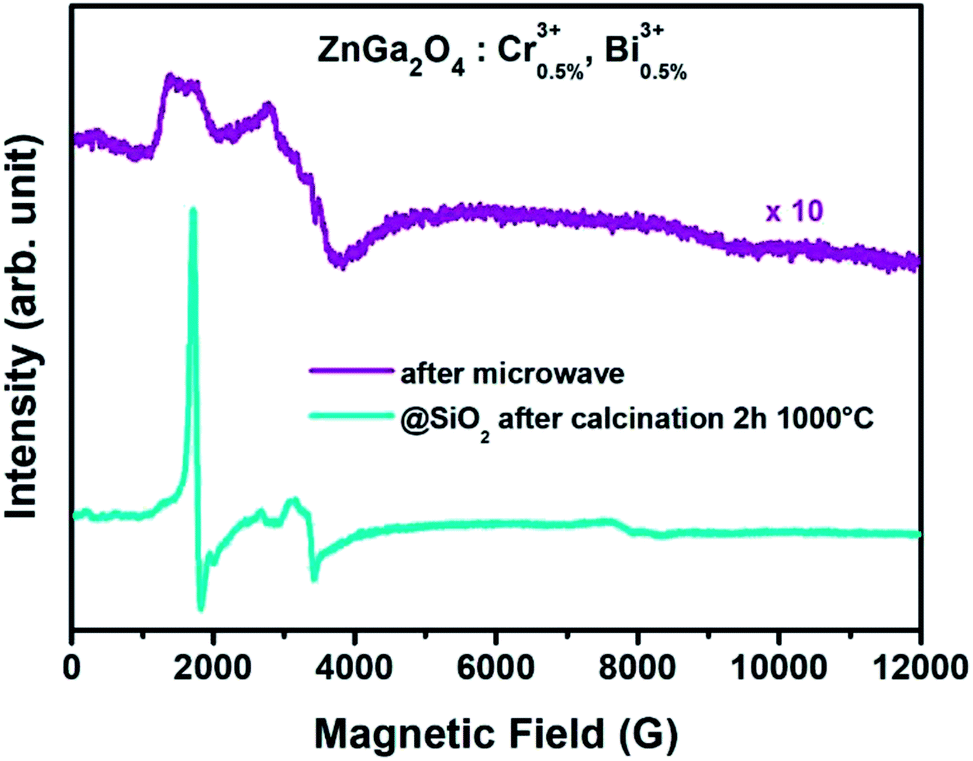 | ||
| Fig. 2 EPR spectra of ZGO-MW-NPs (in purple) and ZGO-cal-NPs (in blue). | ||
It is possible to identify the type of matrix defects responsible of such a disorder thanks to NMR measurements.22 Indeed, gallium NMR study highlights the decrease of gallium in tetrahedral site rate to the profit of octahedral site rate after thermal treatment (see ESI-A†). The calcination step allows the relocation of antisite cations in the appropriate site. In addition, the oxygen deficiency rate can also be reduced by thermal annealing in air. High resolution microscopy picture of particle after calcination reveals the high crystallinity of the ZnGa2O4:Cr3+,Bi3+ nanoparticle. Fig. 3a shows the ZnGa2O4:Cr3+,Bi3+ particle surrounded by its silica layer. Inter planar spacing are also extracted (see Fig. 3a). Besides FFT (Fast Fourier Transformation) analysis associated to high resolution TEM picture, enables to index atomic planes, which are in good agreement with the spinel phase of the particles (Fig. 3b).
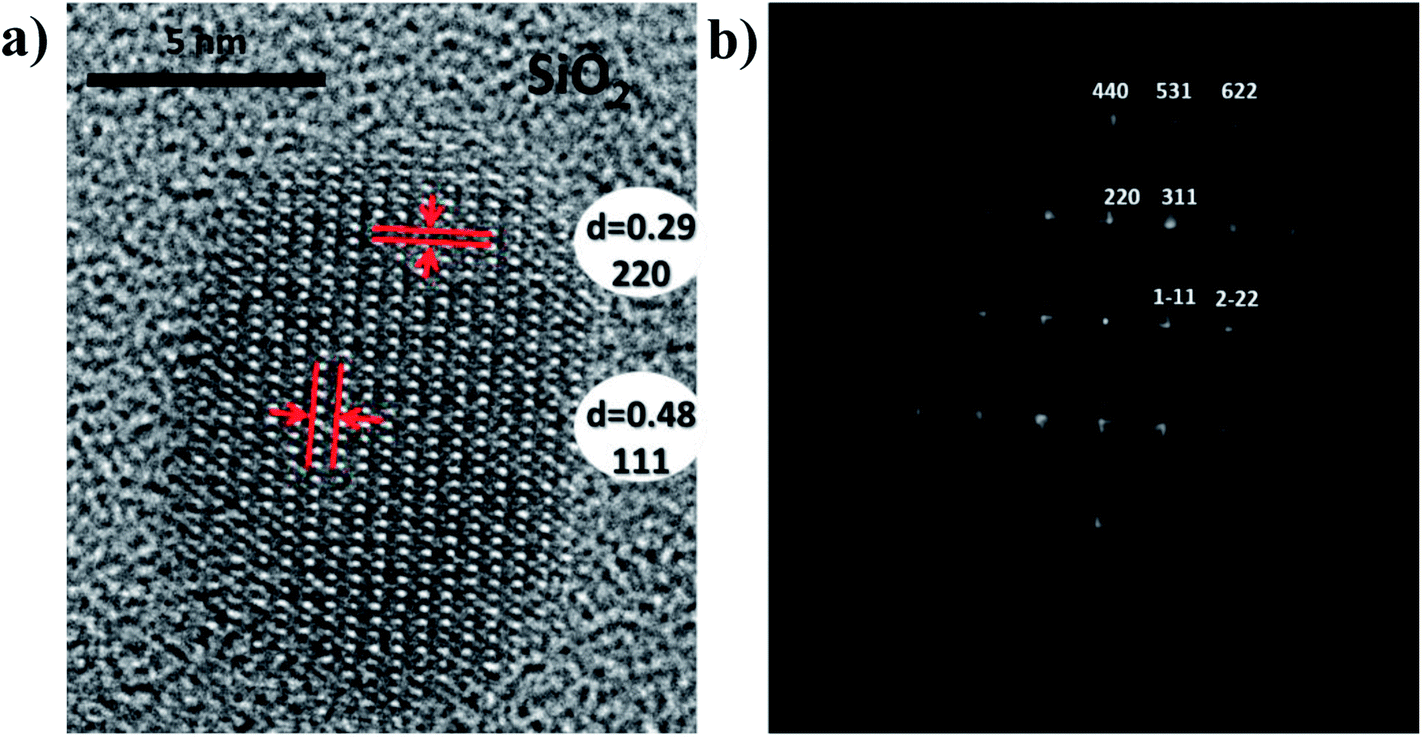 | ||
| Fig. 3 (a) HRTEM image and (b) associated FFT picture of ZGO-cal-NPs oriented along the [112] direction. | ||
All the optical measurements considered in this paper are carried out on the silica embedded nanoparticles ZnGa2O4:Cr3+,Bi3+@SiO2 after calcination step (ZGO-cal-NPs). As presented in Fig. 4a, after 254 nm excitation ZGO-cal-NPs present a deep red emission band centered at 695 nm, which corresponds to the 2E → 4A2 transition of the Cr3+ ions.27 ZGO-cal-NPs present persistent luminescence properties since signal can still be detected 10 minutes after stopping the excitation source. Persistent luminescence emission spectra at several temperatures from room temperature to 100 °C are presented in Fig. 4a. Two optical features can be extracted from these spectra at different temperatures: the bandwidth at half maximum (FWHM) and the luminescence intensity ratio (LIR) between the two bands centered respectively at 692 and 705 nm. The FWHM and the LIR variation according to temperature are presented in Fig. 4b and c respectively. The rising bandwidth is related to the increase of the electron–phonon interaction with the temperature, whereas the change of intensity ratio comes from the contribution variation of two different transitions. The band centered at 692 nm is attributed to the N2 line corresponding to the emission of trivalent chromium in the vicinity of an antisite cation, and the one centered at 705 nm corresponds to the combination of Cr3+-clusters emission (n7 line) and PSB (phonon side bands).26 In order to compare the sensing ability of ZGO-cal-NPs, one important parameter can be introduced called the relative sensitivity:13
 | (1) |
 | ||
| Fig. 4 (a) Persistent luminescence emission of ZGO-cal-NPS at several temperatures and associated extracted data (b) bandwidth (c) luminescence intensity ratio, fitted curves (dashed lines) and sensitivity (orange) are presented in both cases. | ||
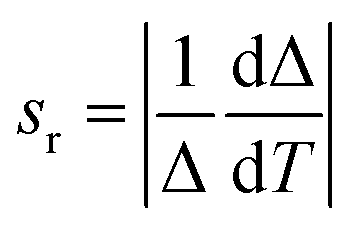
The relative sensitivity (curves in red Fig. 4b and c) is calculated from fitted curves for both (bandwidth and LIR) studies. Numerical fit is performed using a polynomial expansion up to order 3. The sensitivity is higher in the case of bandwidth investigation, which reaches 0.85% °C−1 at 100 °C compared to less than 0.14% °C−1 for LIR method. In addition, the standard deviation is larger in the case of LIR study (σ = 0.0056, 0.7%), traducing a poor repeatability of the method compare to the FWHM one (σ = 0.12 nm, 0.3%). Nevertheless, the use of bandwidth or luminescence intensity ratio requires detecting set-up with high spectral resolution. This is not the case for luminescence decays registration. Therefore, afterglow curves of the same ZnGa2O4:Cr3+,Bi3+@SiO2 nanopowders are recorded at several temperatures from room temperature to 200 °C. These decays presented in Fig. 5a are recorded after 2 minutes excitation with a 254 nm mercury lamp. The acquisition starts 5 seconds after switching off the excitation in order to avoid parasitic signal. It appears that the persistent luminescence intensity became very small for temperature larger than 100 °C. In order to understand such a variation in the persistent luminescence lifetime, thermoluminescence measurements are also performed. Thermoluminescence allows the study of trap depth distribution, explaining the presence of persistent luminescence phenomena around room temperature. The persistent phosphors have traps related to the intrinsic defects in the host.26,28 The trap depth, that is the energy difference between traps and a recombination center (the conduction band, valence band or an excited state), is a key parameter to get persistent luminescence at required temperature.29,30 ZGO-cal-NPs are excited during 5 min at 0 °C with a 6 W mercury lamp at 254 nm, then the temperature is cooled down to −70 °C, temperature at which the registration is started. The temperature is then increased until 300 °C. The ZGO-cal-NPs thermoluminescence glow curve shows only one broad band centered at 33 °C (Fig. 5c), corresponding to one kind of traps responsible for persistent luminescence. Schematic representation of energetic diagram is presented in Fig. 5d. After UV excitation, two types of configuration can be identified: excited chromium (Cr*), and exciton trapped by defects inside the matrix (D*). The persistent luminescence arises from the relaxation between excited chromium state to the fundamental state (red arrow). A transfer between the two conformations (Cr*–D and Cr*–D*) is possible and is dependent on activation energy between them. Indeed, with increasing temperature, the energy transfer from trap levels to chromium levels become easier, thus the dynamic of detrapping is faster, leading to the decrease of the persistent lifetime. At higher temperature, above 200 °C, no persistent luminescence is observed. Using these experimental conditions (2 min excitation, 10 min recording), it is possible to investigate the temperature range from 50 °C to 200 °C, where persistent emission occurs with a maximal sensitivity of 1.7% °C−1 at 190 °C (Fig. 5b). Although the standard deviation of this method is high, the sensitivity is competitive in comparison to LIR and FWHM methods (see Table 2). One should further notice that to obtain a temperature determination below 50 °C the recording time should be increased as seen Fig. 5a. Indeed, the experimental lifetime is extracted from the persistence decay using the following equation:
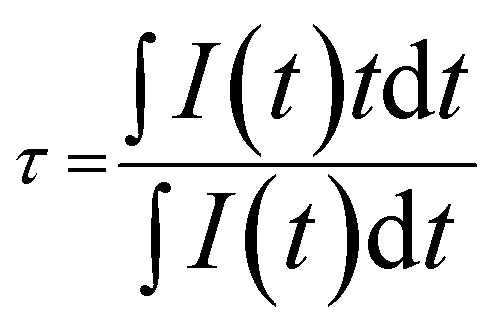 | (2) |
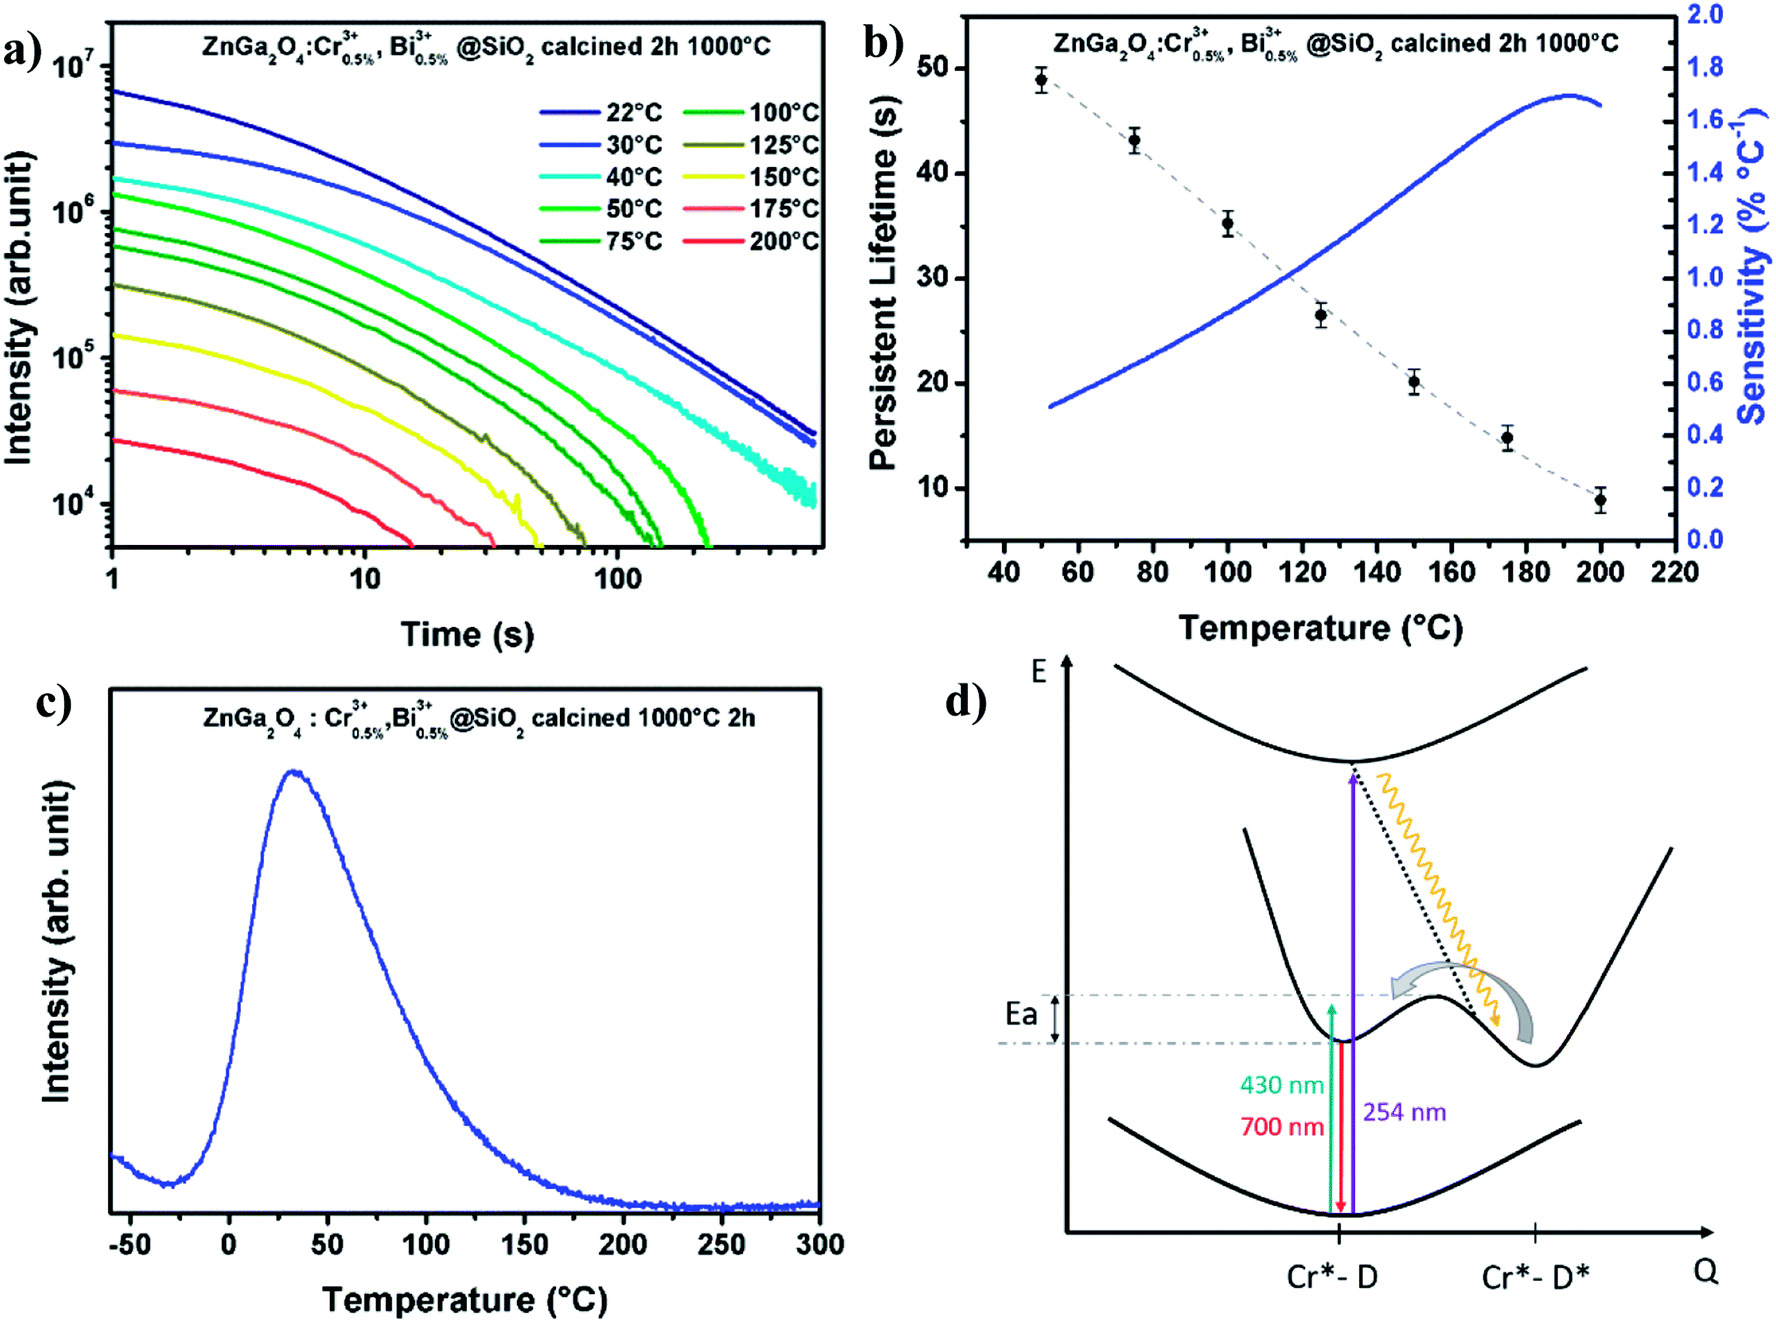 | ||
| Fig. 5 (a) Persistent luminescence spectra of ZGO-cal-NPs at various temperatures. (b) Persistent lifetime and corresponding sensitivity. (c) Thermoluminescence of ZGO-cal-NPs spectrum. (d) Schematic representation of ZGO-cal-NPs conformations. | ||
To calculate the experimental lifetime, all the decay should be recorded until the total extinction of the luminescence. However, the main disadvantage of the persistent lifetime study for thermometry applications is the need to empty the traps between each measurement with increasing temperature above 200 °C, in order to get repeatable measurements. In the case of bandwidth variation and luminescence intensity ratio determination, measurements were performed with and without thermal bleaching and no significant difference was observed. Besides, the study of persistent luminescence method should include the precise control of the time between the interruption of the excitation and the beginning of the recording as additional parameter: according to the time after which the excitation source is stopped the response will change (please see ESI-B†). The implementation of temperature measurement thanks to persistent luminescence is therefore not optimal since the acquisition can last more than several minutes. Moreover, the luminescence response in intensity depends on experimental conditions like the quantity of nanoparticles used for the experiments, the distances between the sample and the excitation source as well as the detector, the excitation time, etc. The persistent properties still could be very interesting to study in the case of photo-stimulation after injection in vivo.
For an immediate, self-referenced and a more precise temperature measurement, photoluminescence (PL) properties are also investigated in ZGO-cal-NPs at various temperatures. Nanoparticles powder were excited with a 430 nm pulsed Laser (10 Hz) and the PL decays are registered. At this wavelength, only chromium(III) is excited (Cr*–D, Fig. 5d). The PL decay does not depend on experimental conditions and the dynamic of the 4T2 → 4A2 transition is in the milliseconds range. It appears that the PL lifetime is decreasing with an increase of temperature (Fig. 6). The 2E → 4A2 chromium transition is spin forbidden, and consequently at room temperature, the luminescence lifetime is long (8.5 ms). In the case of trivalent chromium in ZnGa2O4 matrix the 2E level is in thermal equilibrium with the 4T2 level. The 4T2 → 4A2 transition is spin allowed and is characterized by a short lifetime value. With thermal activation, the contribution of the spin allowed transition increase at the expense of 2E → 4A2 transition resulting in a decrease of the effective lifetime. As the decay profiles have a non-exponential shape (due to the contribution of two transitions), the PL experimental lifetime can be deduced from the decay curve thanks to the eqn (2).
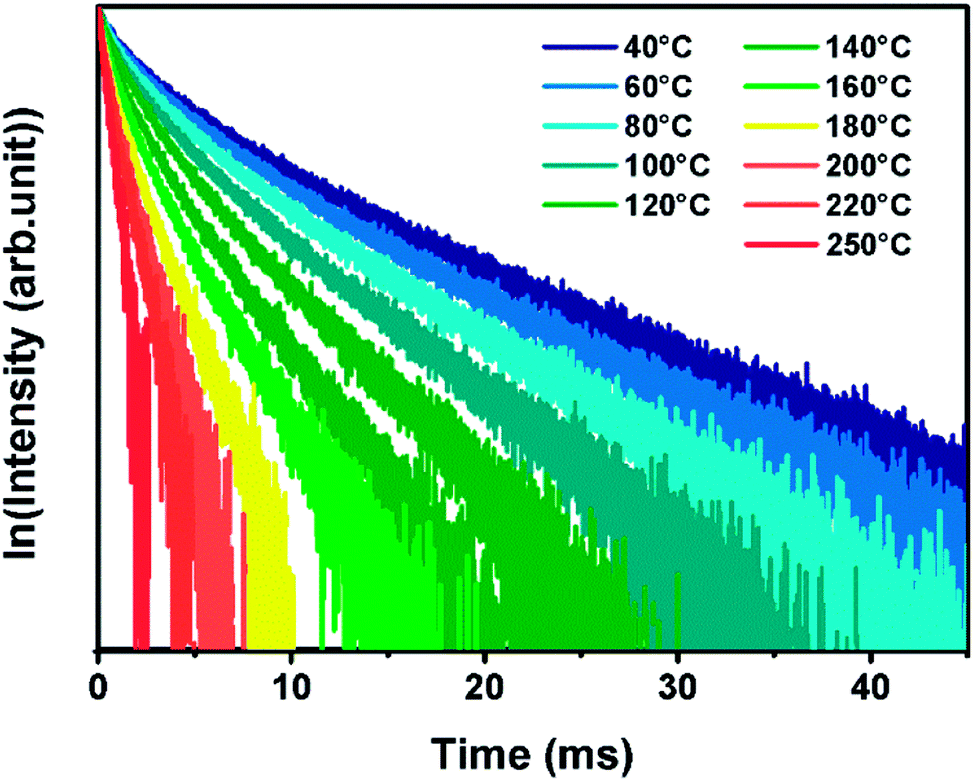 | ||
| Fig. 6 Experimentally obtained luminescence decay curves at various temperature of ZGO-cal-NPs. | ||
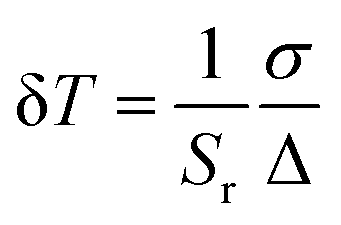
This lifetime variation depending on temperature, extracted from the decay curves, is represented on Fig. 7a. The lifetime variation is significant from 30 °C to 200 °C. In the case of ZnGa2O4:Cr3+0.5%,Bi3+0.5% nanoparticles coated with a silica layer and calcined at 1000 °C during 2 hours the maximal sensitivity is 1.93% °C−1. This value is competitive in comparison to other luminescent thermal sensors reported in the literature data (see Table 1). In order to determine the validity of the measurements, the same measurements have been recorded several times at room temperature and the measurement standard deviation was estimated to be σ = 0.06 ms, 0.7%. The use of photoluminescence lifetime is therefore more suitable than persistent luminescence lifetime for temperature determination (see Table 2). The reversibility of the system has also been investigated. Indeed, in Fig. 7b are reported experimental lifetime values obtained for five thermal cycles of heating and cooling (between 40 °C and 100 °C). These measurements reveal a quite good reversibility of ZGO-cal-NPs nanothermometer but also a good repeatability and stability. One last parameter is also determined, which is very important to characterize the performance of thermal sensor: the thermal uncertainty (or temperature resolution, δT. This parameter, which is temperature dependant describes the minimal change in temperature that can lead to a noticeable variation in the optical response. It is calculated as following:
 | (3) |
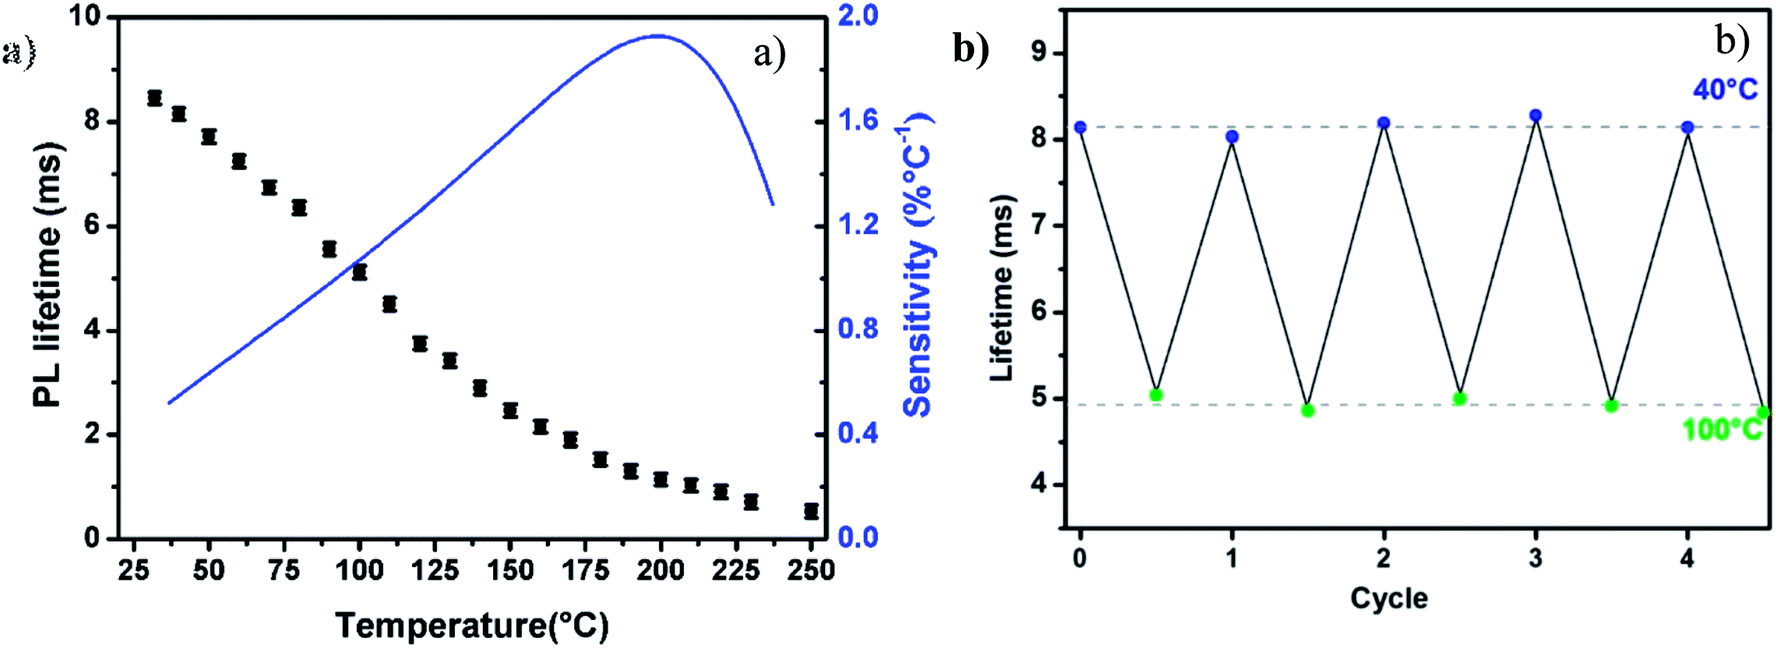 | ||
| Fig. 7 (a) ZGO-cal-NPs photoluminescence lifetimes at various temperatures, the sensitivity is presented in blue. (b) Cycling lifetime registration at 40 °C and 100 °C showing the reversibility of the system ZnGa2O4:Cr3+0.5%,Bi3+0.5%@SiO2 calcined 1000 °C, 2 h. | ||
| Method | Maximal sensitivity | Temperature range | Standard deviation | Ref. |
|---|---|---|---|---|
| Persistent LIR | 0.19% °C−1 | 20–100 °C | 0.7% | This work |
| Persistent FWHM | 0.85% °C−1 | 20–100 °C | 0.3% | This work |
| Persistent lifetime | 1.7% °C−1 | 50–200 °C | 3.3% | This work |
| Photoluminescent lifetime | 1.93% °C−1 | 20–200 °C | 0.7% | This work |
Conclusions
ZnGa2O4:Cr3+0.5%,Bi3+0.5% nanoparticles coated with a silica layer and calcined at 1000 °C during 2 h have been investigated as thermal sensors, since their luminescent properties vary with the temperature. The study of persistent luminescence profiles allows absolute temperature determination, but requires a detecting set-up with a high resolution, and is very dependent on time between the excitation shutdown and the registration start. The persistent luminescence lifetime investigation at several temperatures allows temperature determination with a competitive sensitivity but the implementation is quite complicated since thermal detrapping is needed between each measurement. In comparison, photoluminescence lifetimes variation of ZGO-cal-NPs with temperature, are better for the temperature determination. After careful calibration, it is possible to measure precisely the temperature. We also have demonstrated the robustness of ZGO-cal-NPs as thermal sensors since they present good reversibility and repeatability luminescence properties. This self-referenced and nanosized device, is indeed a good candidate for thermometry at the nanoscale and could be use thanks to its good sensitivity for local temperature measurement and more especially for temperature determination of nanoheaters like plamonic gold nanoparticles or magnetic iron oxide nanoparticles.Conflicts of interest
There are no conflicts to declare.Acknowledgements
This work was supported by the Cluster of Excellence MATISSE, by DGA (Direction Générale de l’Armement, France), and by French research council managed by the ANR and more especially the ANR-14-CE08-0016-03 PEPSI project.References
- R. K. P. Benninger, Y. Koç, O. Hofmann, J. Requejo-Isidro, M. A. A. Neil, P. M. W. French and A. J. deMello, Quantitative 3D Mapping of Fluidic Temperatures within Microchannel Networks Using Fluorescence Lifetime Imaging, Anal. Chem., 2006, 78, 2272–2278 CrossRef CAS PubMed.
- F. H. C. Wong and C. Fradin, Simultaneous pH and Temperature Measurements Using Pyranine as a Molecular Probe, J. Fluoresc., 2011, 21, 299–312 CrossRef CAS PubMed.
- S. Uchiyama, N. Kawai, A. P. de Silva and K. Iwai, Fluorescent Polymeric AND Logic Gate with Temperature and pH as Inputs, J. Am. Chem. Soc., 2004, 126, 3032–3033 CrossRef CAS PubMed.
- G. W. Walker, V. C. Sundar, C. M. Rudzinski, A. W. Wun, M. G. Bawendi and D. G. Nocera, Quantum-dot optical temperature probes, Appl. Phys. Lett., 2003, 83, 3555–3557 CrossRef CAS.
- V. A. Vlaskin, N. Janssen, J. van Rijssel, R. Beaulac and D. R. Gamelin, Tunable Dual Emission in Doped Semiconductor Nanocrystals, Nano Lett., 2010, 10, 3670–3674 CrossRef CAS PubMed.
- L. M. Maestro, C. Jacinto, U. R. Silva, F. Vetrone, J. A. Capobianco, D. Jaque and J. G. Solé, CdTe Quantum Dots as Nanothermometers: Towards Highly Sensitive Thermal Imaging, Small, 2011, 7, 1774–1778 CrossRef CAS PubMed.
- F. Vetrone, R. Naccache, A. Zamarrón, A. Juarranz de la Fuente, F. Sanz-Rodríguez, L. Martinez Maestro, E. Martín Rodriguez, D. Jaque, J. García Solé and J. A. Capobianco, Temperature Sensing Using Fluorescent Nanothermometers, ACS Nano, 2010, 4, 3254–3258 CrossRef CAS PubMed.
- D. Wawrzynczyk, A. Bednarkiewicz, M. Nyk, W. Strek and M. Samoc, Neodymium(III) doped fluoride nanoparticles as non-contact optical temperature sensors, Nanoscale, 2012, 4, 6959 RSC.
- M. D. Dramićanin, Sensing temperature via downshifting emissions of lanthanide-doped metal oxides and salts. A review, Methods Appl. Fluoresc., 2016, 4, 042001 CrossRef PubMed.
- L. Marciniak and A. Bednarkiewicz, Nanocrystalline NIR-to-NIR luminescent thermometer based on Cr3+,Yb3+ emission, Sens. Actuators, B, 2017, 243, 388–393 CrossRef CAS.
- B. del Rosal, E. Ximendes, U. Rocha and D. Jaque, In vivo Luminescence Nanothermometry: from Materials to Applications, Adv. Opt. Mater., 2017, 5, 1600508 CrossRef.
- C. D. S. Brites, P. P. Lima, N. J. O. Silva, A. Millán, V. S. Amaral, F. Palacio and L. D. Carlos, Thermometry at the nanoscale, Nanoscale, 2012, 4, 4799 RSC.
- D. Jaque and F. Vetrone, Luminescence nanothermometry, Nanoscale, 2012, 4, 4301 RSC.
- H. Peng, H. Song, B. Chen, J. Wang, S. Lu, X. Kong and J. Zhang, Temperature dependence of luminescent spectra and dynamics in nanocrystalline Y2O3:Eu3+, J. Chem. Phys., 2003, 118, 3277–3282 CrossRef CAS.
- E. Teston, S. Richard, T. Maldiney, N. Lièvre, G. Y. Wang, L. Motte, C. Richard and Y. Lalatonne, Non-Aqueous Sol–Gel Synthesis of Ultra Small Persistent Luminescence Nanoparticles for Near-Infrared In Vivo Imaging, Chem. - Eur. J., 2015, 21, 7350–7354 CrossRef CAS PubMed.
- S. K. Sharma, D. Gourier, E. Teston, D. Scherman, C. Richard and B. Viana, Persistent luminescence induced by near infra-red photostimulation in chromium-doped zinc gallate for in vivo optical imaging, Opt. Mater., 2017, 63, 51–58 CrossRef CAS.
- T. Maldiney, A. Bessière, J. Seguin, E. Teston, S. K. Sharma, B. Viana, A. J. J. Bos, P. Dorenbos, M. Bessodes, D. Gourier, D. Scherman and C. Richard, The in vivo activation of persistent nanophosphors for optical imaging of vascularization, tumours and grafted cells, Nat. Mater., 2014, 13, 418–426 CrossRef CAS PubMed.
- T. Lécuyer, E. Teston, G. Ramirez-Garcia, T. Maldiney, B. Viana, J. Seguin, N. Mignet, D. Scherman and C. Richard, Chemically engineered persistent luminescence nanoprobes for bioimaging, Theranostics, 2016, 6, 2488–2524 CrossRef PubMed.
- B. Viana, S. K. Sharma, D. Gourier, T. Maldiney, E. Teston, D. Scherman and C. Richard, Long term in vivo imaging with Cr3+ doped spinel nanoparticles exhibiting persistent luminescence, J. Lumin., 2016, 170, 879–887 CrossRef CAS.
- Y. Zhuang, J. Ueda and S. Tanabe, Enhancement of Red Persistent Luminescence in Cr3+-Doped ZnGa2O4 Phosphors by Bi2O3 Codoping, Appl. Phys. Express, 2013, 6, 052602 CrossRef.
- Y. Zhuang, J. Ueda and S. Tanabe, Tunable trap depth in Zn(Ga1–xAlx)2O4:Cr,Bi red persistent phosphors: considerations of high-temperature persistent luminescence and photostimulated persistent luminescence, J. Mater. Chem. C, 2013, 1, 7849 RSC.
- M. Pellerin, C. Coelho-Diogo, C. Bonhomme, N. Touatib, L. Binet, D. Gourier, J. Ueda, S. Tanabe, B. Viana and C. Chanéac, Proc. SPIE 10100, Optical Components and Materials XIV, 2017, p. 101000B Search PubMed.
- Z. Zou, X. Tang, C. Wu, D. Wang, J. Zhang, Z. Ci, S. Du and Y. Wang, How to tune trap properties of persistent phosphor: photostimulated persistent luminescence of NaLuGeO4:Bi3+,Cr3+ tailored by trap engineering, Mater. Res. Bull., 2018, 97, 251–259 CrossRef CAS.
- E. Martín Rodríguez, G. López-Peña, E. Montes, G. Lifante, J. García Solé, D. Jaque, L. A. Diaz-Torres and P. Salas, Persistent luminescence nanothermometers, Appl. Phys. Lett., 2017, 111, 081901 CrossRef.
- J. Yang, Y. Liu, Y. Zhao, Z. Gong, M. Zhang, D. Yan, H. Zhu, C. Liu, C. Xu and H. Zhang, Ratiometric Afterglow Nanothermometer for Simultaneous in situ Bioimaging and Local Tissue Temperature Sensing, Chem. Mater., 2017, 29, 8119–8131 CrossRef CAS.
- D. Gourier, A. Bessière, S. K. Sharma, L. Binet, B. Viana, N. Basavaraju and K. R. Priolkar, Origin of the visible light induced persistent luminescence of Cr3+-doped zinc gallate, J. Phys. Chem. Solids, 2014, 75, 826–837 CrossRef CAS.
- W. Mikenda and A. Preisinger, N-lines in the luminescence spectra of Cr3+-doped spinels (I) identification of N-lines, J. Lumin., 1981, 26, 53–66 CrossRef CAS.
- A. Bessière, R. A. Benhamou, G. Wallez, A. Lecointre and B. Viana, Site occupancy and mechanisms of thermally stimulated luminescence in Ca9Ln(PO4)7 (Ln = lanthanide), Acta Mater., 2012, 60, 6641–6649 CrossRef.
- A. Bessière, A. Lecointre, R. A. Benhamou, E. Suard, G. Wallez and B. Viana, How to induce red persistent luminescence in biocompatible Ca3(PO4)2, J. Mater. Chem. C, 2013, 1, 1252–1259 RSC.
- D. C. Rodríguez Burbano, S. K. Sharma, P. Dorenbos, B. Viana and J. A. Capobianco, Persistent and Photostimulated Red Emission in CaS:Eu2+,Dy3+ Nanophosphors, Adv. Opt. Mater., 2015, 3, 551–557 CrossRef.
- D. Chen, Z. Wan, Y. Zhou and Z. Ji, Cr3+-doped gallium-based transparent bulk glass ceramics for optical temperature sensing, J. Eur. Ceram. Soc., 2015, 35, 4211–4216 CrossRef CAS.
- R. Liang, R. Tian, W. Shi, Z. Liu, D. Yan, M. Wei, D. G. Evans and X. Duan, A temperature sensor based on CdTe quantum dots–layered double hydroxide ultrathin films via layer-by-layer assembly, Chem. Commun., 2013, 49, 969–971 RSC.
- M. G. Nikolić, Ž. Antić, S. Ćulubrk, J. M. Nedeljković and M. D. Dramićanin, Temperature sensing with Eu3+ doped TiO2 nanoparticles, Sens. Actuators, B, 2014, 201, 46–50 CrossRef.
- M. K. Mahata, K. Kumar and V. K. Rai, Er3+–Yb3+ doped vanadate nanocrystals: a highly sensitive thermographic phosphor and its optical nanoheater behavior, Sens. Actuators, B, 2015, 209, 775–780 CrossRef CAS.
Footnote |
| † Electronic supplementary information (ESI) available. See DOI: 10.1039/c8ra08182d |
| This journal is © The Royal Society of Chemistry 2018 |