
 Open Access Article
 This Open Access Article is licensed under a Creative Commons Attribution-Non Commercial 3.0 Unported Licence
Cyperane and eudesmane-type sesquiterpenoids from Chinese liverwort and their anti-diabetic nephropathy potential†
Jiaozhen Zhanga,
Yongjie Wang b,
Rongxiu Zhuc,
Yi Lia,
Yuelan Lia,
Yanan Qiaoa,
Jinchuan Zhoud and
Hongxiang Lou*a
b,
Rongxiu Zhuc,
Yi Lia,
Yuelan Lia,
Yanan Qiaoa,
Jinchuan Zhoud and
Hongxiang Lou*a
aDepartment of Natural Products Chemistry, Key Lab of Chemical Biology of the Ministry of Education, Shandong University, Jinan 250012, People's Republic of China. E-mail: louhongxiang@sdu.edu.cn; Fax: +86-531-8838-2019; Tel: +86-531-8838-2012
bDepartment of Pharmacy, The Second Hospital of Shandong University, Jinan, Shandong 250033, People's Republic of China
cSchool of Chemistry and Chemical Engineering, Shandong University, Jinan 250010, People's Republic of China
dSchool of Pharmacy, Linyi University, Linyi 276000, People's Republic of China
First published on 22nd November 2018
Abstract
Six new sesquiterpenoids, including cyperane (1 and 2) and eudesmane (3–6) types, and one known eudesmane derivative (7), were isolated from the Chinese liverwort Chiloscyphus polyanthus var. rivularis (Schrad.) Nees. The structures of 1–7 were determined based on a combination of their spectroscopic data (NMR, HRESIMS and IR), single-crystal X-ray diffraction, and electronic circular dichroism (ECD) calculations. Preliminary anti-diabetic nephropathy activity testing showed that the cyperane-type sesquiterpenoids could inhibit cell proliferation and extracellular matrix accumulation in high glucose cultured mesangial cells in a dose-dependent manner.
1. Introduction
Diabetic nephropathy (DN) is one of the most serious complications of diabetes mellitus.1,2 It is characterized by mesangial cell (MC) proliferation and overproduction of extracellular matrix (ECM) such as fibronectin (FN) and collagen IV (Col IV), and can lead to renal failure and end-stage renal disease.3–5 Currently, clinically available drugs for DN are scarce.6 Thus, it is a promising approach to find new drug candidates from natural products.Reportedly, a number of sesquiterpenoids have shown their potential in the treatment of DN.7–10 Liverworts are rich source of bioactive sesquiterpenoids.11–14 Previous chemical investigations on the Chinese liverwort Chiloscyphus polyanthus var. rivularis (Schrad.) Nees, collected in the Changbaishan mountain at Jilin Province of China, has led to the isolation of several ent-eudesmane-type sesquiterpenoids.15 In order to hunt for sesquiterpenoids with anti-DN activity, our further research on the same species led to the discovery of six new sesquiterpenoids including the cyperane (1 and 2) and ent-eudesmane (3–6) types, together with one known ent-eudesmane-type sesquiterpenoid (7). The anti-DN activities of the isolated compounds were evaluated by inhibiting the cell proliferation and the accumulation of ECM. Herein, we report the isolation, structural elucidation, and preliminary anti-DN activity of these compounds.
2. Results and discussion
2.1. Isolation and identification of undescribed compounds
The 95% EtOH extract of air-dried C. polyanthus var. rivularis was fractionated by chromatography over MCI gel, silica gel and Sephadex LH-20 and was then further purified by semipreparative HPLC to afford six previously undescribed sesquiterpenoids and one known analogue (Fig. 1). Their structures were determined based on their spectroscopic data, single-crystal X-ray diffraction, and ECD calculations.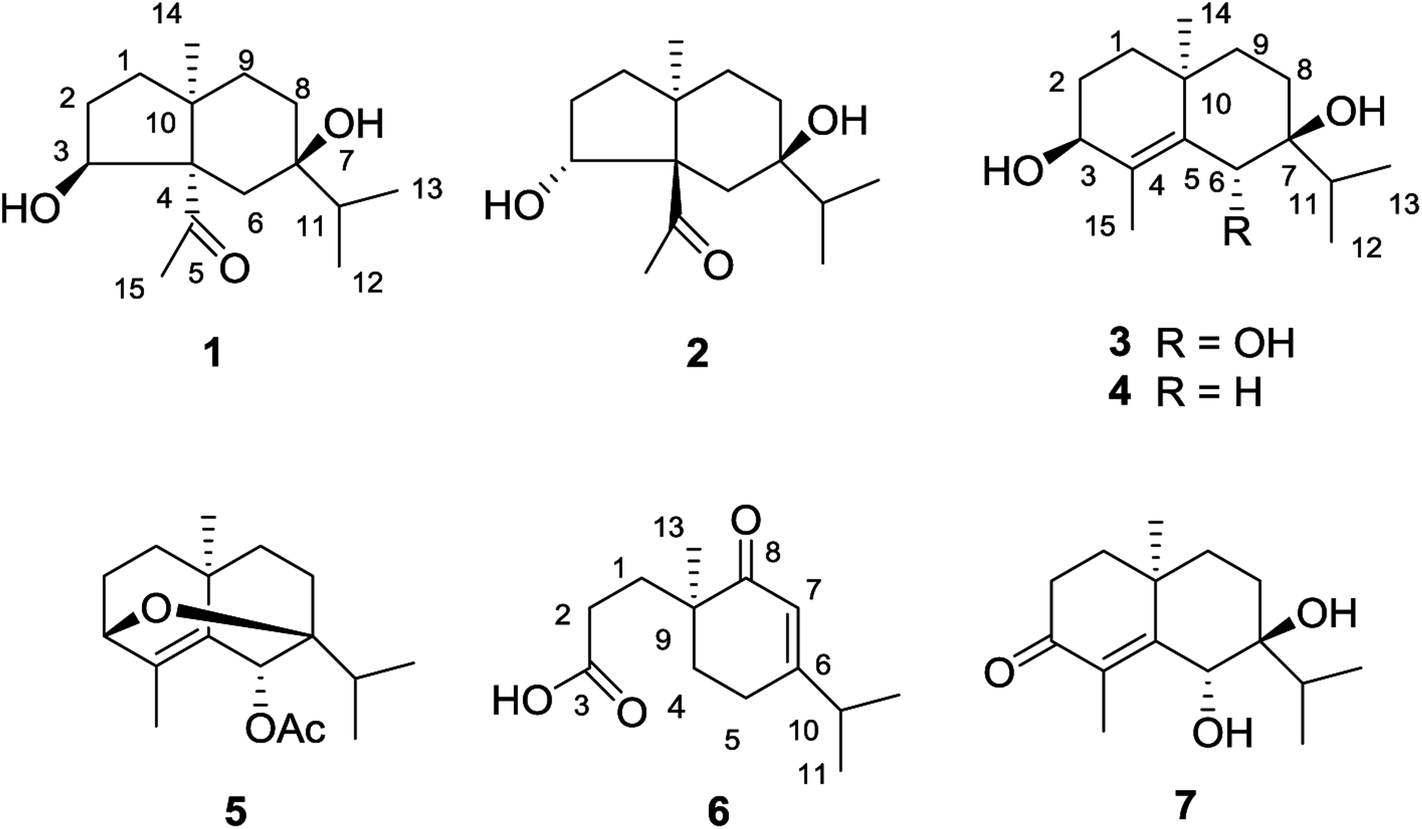 | ||
| Fig. 1 Structures of compounds 1–7. | ||
Compound 1 was obtained as colorless needles. The molecular formula was established as C15H26O3 based on the pseudo molecular ion [M + Na]+ peak at m/z 277.1777 (calcd 277.1774) in the HRESIMS and 13C NMR data, requiring three indices of hydrogen deficiency. The IR spectrum revealed an absorption band for one carbonyl group (1680 cm−1). The 1H NMR data (Table 1) of 1 displayed signals for two tertiary methyls at δH 0.95 (s) and 2.14 (s), two secondary methyls at δH 0.98 (d, J = 6.7 Hz) and 0.99 (d, J = 6.7 Hz), and one oxygenated methine at δH 4.36 (dd, J = 8.1, 6.0 Hz). The 13C NMR (Table 1) and HMQC data showed 15 carbons including one carbonyl group (δC 212.8), three quaternary carbons (with one of these oxygenated at δC 71.6), two methines (one oxygenated at δC 77.4), five methylenes, and four methyls. The above NMR data showed that 1 was a derivative of 4-oxo-cyperan-3α,7α,11-triol bearing a cyperane skeleton,16 in which the oxygenated quaternary carbon at C-11 was replaced by a methine group (δH 1.69 sept J = 6.7, δC 39.2) in 1. The 1H–1H COSY correlations (Fig. 2) of 1 established three segments: CH2(1)–CH2(2)–CH(3), CH2(8)–CH2(9), and CH3(12)–CH(11)–CH3(13). The keto carbonyl at C-4 was confirmed using HMBC correlations (Fig. 2) from H3-15 (δH 2.14) to C-4 and C-5 (δC 65.2). The hydroxyl groups at C-3 and C-7 were verified by the HMBC correlations from H-3 (δH 4.36) to C-1 (δC 37.7), C-4, C-5 and C-10 (δC 43.4), and from H3-12/13 (δH 0.98 and 0.99) to C-7 (δC 71.6), respectively. Thus, the gross structure of 1 was determined as shown. The NOESY correlation (Fig. 3) of H3-14/H3-15, H-1β/H-9α/H-9β, and H-2β/H-9β indicated the two rings were cis-fused and the NOESY correlations between H-3 and H3-15 suggested the hydroxyl group of C-3 was β-oriented. Single-crystal X-ray diffraction analysis with Cu Kα radiation (Fig. 4) was operated to establish the unambiguous assignment of its relative and absolute configurations. Therefore, compound 1 was identified as (3S,5S,7R,10S)-3,7-dihydroxy-cyperan-4-one.
| Pos. | 1 | 2 | ||
|---|---|---|---|---|
| δC | δH | δC | δH | |
| 1α | 37.7 t | 1.76 m | 37.7 t | 1.87 m |
| 1β | 1.49 m | 1.42 ddd (12.6, 9.5, 2.9) | ||
| 2α | 34.5 t | 2.34 m | 31.2 t | 2.30 m |
| 2β | 1.81 m | 1.73 m | ||
| 3 | 77.4 d | 4.36 dd (8.1, 6.0) | 78.2 d | 5.22 dd (10.0, 7.0) |
| 4 | 212.8 s | 213.8 s | ||
| 5 | 65.2 s | 64.4 s | ||
| 6α | 32.6 t | 2.01 d (15.0) | 33.3 t | 2.01 d (14.5) |
| 6β | 1.94 d (15.0) | 1.87 d (14.5) | ||
| 7 | 71.6 s | 73.1 s | ||
| 8 | 30.2 t | 1.50 m | 30.1 t | 1.55 m |
| 9α | 33.0 t | 1.20 br d (10.5) | 33.0 t | 1.16 br d (13.9) |
| 9β | 1.95 m | 1.87 m | ||
| 10 | 43.4 s | 42.7 s | ||
| 11 | 39.2 d | 1.69 sept (6.7) | 40.1 d | 1.63 sept (6.8) |
| 12 | 17.2 q | 0.99 d (6.7) | 16.8 q | 0.99 d (6.8) |
| 13 | 17.1 q | 0.98 d (6.7) | 16.7 q | 0.96 d (6.8) |
| 14 | 22.9 q | 0.95 s | 22.3 q | 0.94 s |
| 15 | 29.8 q | 2.14 s | 31.2 q | 2.15 s |
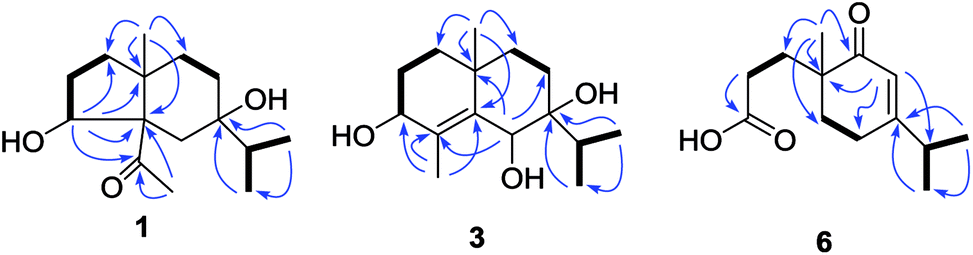 | ||
Fig. 2 Selected HMBC (H→C) and 1H–1H COSY (H![[thick line, graph caption]](https://www.rsc.org/images/entities/char_e117.gif) H) correlations of 1, 3 and 6. H) correlations of 1, 3 and 6. | ||
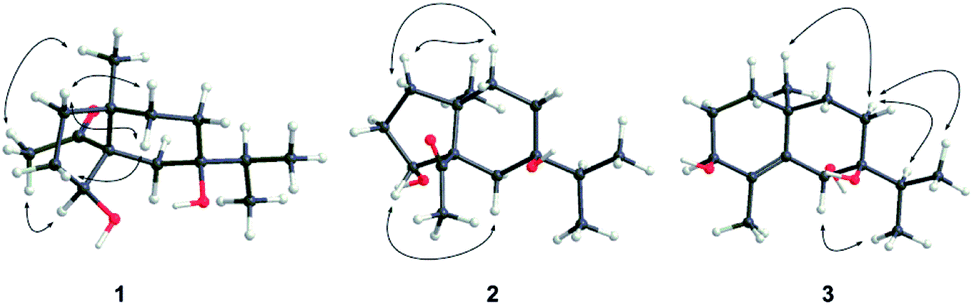 | ||
| Fig. 3 Selected NOESY correlations (H↔H) of 1, 2 and 3. | ||
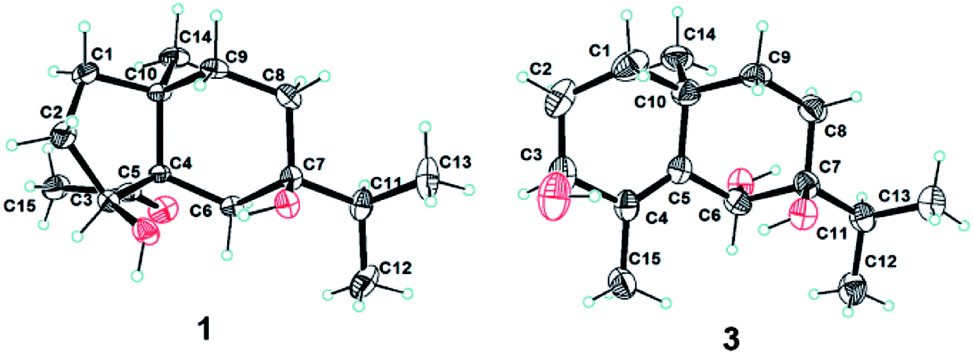 | ||
| Fig. 4 X-ray crystallographic structures of 1 and 3. | ||
Compound 2 was found to share the same planar structure with compound 1 based on the same molecular formula [C15H26O3, m/z 277.1766 [M + Na]+ (calcd 277.1774) in the HRESIMS of 2] and similar NMR data (Table 1). In comparison of their 1H NMR data, the most observable change is the downfield shift of 0.86 ppm for H-3 (δH 5.22, dd, J = 10.0, 7.0 Hz) in 2 which implied its configuration at C-3 is different with compound 1. In the NOE spectrum of 2, correlations of H-3/H-6β confirmed the OH-3 was α-oriented and correlations of H-9α/H-1α/H-1β suggested the presence of trans-fused rings (Fig. 3). Above conclusion was verified by the negative Cotton effect at 299 nm in its ECD spectrum, which was contrary to the positive Cotton effect at 302 nm in the ECD spectrum of 1 and suggested the inverse configuration of the chiral center adjacent keto carbonyl of 2.17 Thus, the structure of 2 was determined as (3R,5R,7R,10S)-3,7-dihydroxy-cyperan-4-one, which was further supported by the agreement exhibiting in experimental and calculated electronic circular dichroism (ECD) spectra of 2 (Fig. 5).
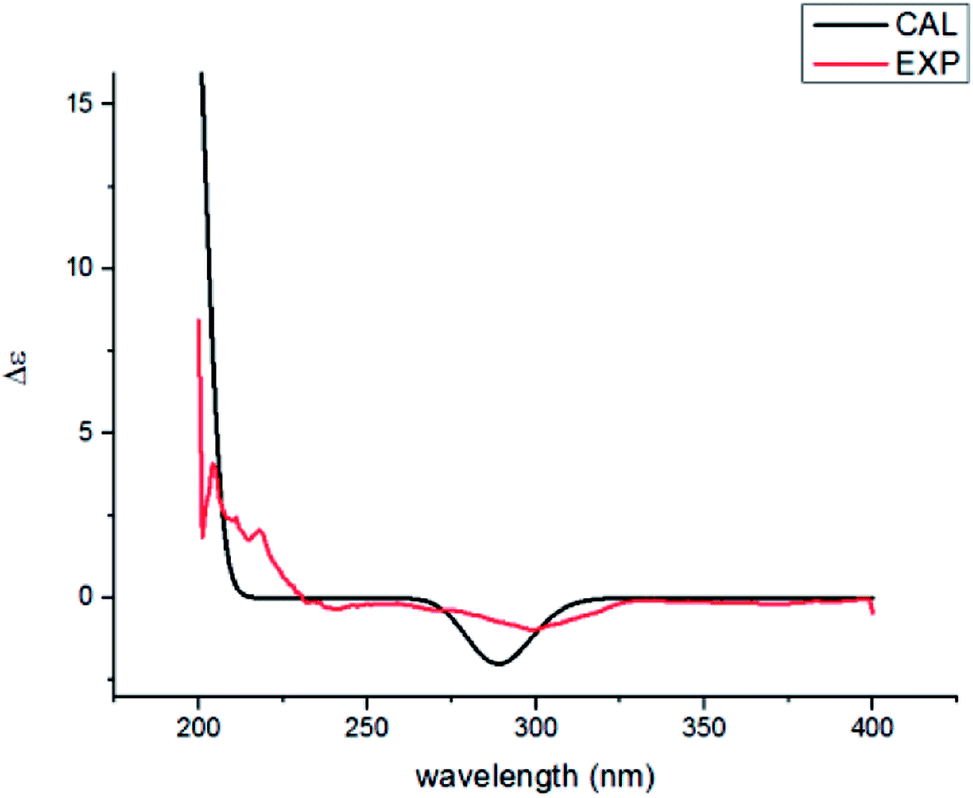 | ||
| Fig. 5 Experimental ECD (red) and calculated ECD (black) of 2. | ||
Compound 3 was obtained as colorless needles with a molecular formula of C15H26O3, based on its HRESIMS at m/z 277.1775 [M + Na]+ (calcd 277.1774), which indicated three degrees of unsaturation. The IR spectrum showed absorptions at 3391 cm−1 suggesting the presence of hydroxy groups. The 1H NMR data (Table 2) displayed the signals of two tertiary methyls at δH 1.20 (s) and 1.90 (s), a isopropyl group including two secondary methyls at δH 0.96 (d, J = 7.0 Hz) and 1.02 (d, J = 7.0 Hz) and a methine at δH 2.03 (sept, J = 7.0 Hz), two oxygenated methines at δH 3.90 (d, J = 3.2 Hz) and 4.53 (s). The 13C NMR (Table 2) and HMQC data showed 15 carbons as two vinylic carbons (δC 134.6 and 139.0), two quaternary carbons (with one of these oxygenated at δC 75.4), three methines (two oxygenated at δC 70.1 and 70.0), four methylenes, and four methyls (δC 16.1, 16.2, 26.0 and 17.4). Three spin systems CH2(1)–CH2(2)–CH(3), CH2(8)–CH2(9), and CH3(12)–CH(11)–CH3(13) from the 1H–1H COSY spectrum (Fig. 2), as well as the HMBC correlations from H3-15 (δH 1.90) to C-3 (δC 70.1), C-4 (δC 134.6), and C-5 (δC 139.0); from H3-12 (δH 1.02) and H3-13 (δH 0.96) to C-11 (δC 33.0), and C-7 (δC 75.4); from H3-14 (δH 1.20) to C-1 (δC 35.3), C-5, C-9 (δC 36.4), and C-10 (δC 33.7); from H-6 (δH 4.53) to C-4, C-5, C-7, C-8 (δC 26.4) and C-10 furnished the planar structure of compound 3, which was the same as that of eudesm-4-ene-3α,6α,7α-triol.18 The semblable 1D NMR data recorded in DMSO-d6 with the sole difference of the chemical shift of H-6 (δH 4.24 for compound 3, and δH 4.24 for the reported compound), and the NOE correlations of H3-13/H-11/H-8α, and H-8α/H3-14 of compound 3 (Fig. 3), indicated that these two compounds shared the same relative configuration, except that at C-6. Single-crystal X-ray diffraction analysis with Cu Kα radiation (Fig. 4) was employed to confirm the aforementioned conclusion, and determine the absolute configuration of this compound. The structure of 3 was therefore elucidated as (3S,6R,7S,10S)-3,6,7-trihydroxy-eudesma-4E-ene.
| Pos. | 3a | 3b | 4a | |||
|---|---|---|---|---|---|---|
| δC | δH | δC | δH | δC | δH | |
| a Recorded in CDCl3.b Recorded in DMSO-d6. | ||||||
| 1α | 35.3 t | 1.33 dt (12.8, 3.0) | 35.1 t | 1.09 m | 34.0 t | 1.42 m |
| 1β | 1.59 m | 1.57 m | 1.67 m | |||
| 2α | 27.7 t | 1.92 m | 27.9 t | 1.74 m | 27.9 t | 1.75 m |
| 2β | 1.74 m | 1.54 m | ||||
| 3 | 70.1 d | 3.90 d (3.2) | 68.3 d | 3.64 t (4.4) | 69.8 d | 3.87 br s |
| 4 | 134.6 s | 131.2 s | 130.0 s | |||
| 5 | 139.0 s | 138.2 s | 137.1 s | |||
| 6α | 70.0 d | 4.53 s | 68.2 d | 4.24 d (3.2) | 33.9 t | 1.99 br d (14.4) |
| 6β | 2.45 dd (14.4, 2.4) | |||||
| 7 | 75.4 s | 73.8 s | 75.4 s | |||
| 8α | 26.4 t | 1.81 m | 26.1 t | 1.65 m | 29.3 t | 1.44 m |
| 8β | 1.61 m | 1.41 m | 1.63 m | |||
| 9 | 36.4 t | 1.50 m | 36.3 t | 1.20 m | 37.6 t | 1.53 m |
| 1.50 m | ||||||
| 10 | 33.7 s | 33.1 s | 34.9 s | |||
| 11 | 33.0 d | 2.03 sept (7.0) | 32.6 d | 1.88 sept (6.8) | 38.3 d | 1.63 sept (6.8) |
| 12 | 16.1 q | 1.02 d (7.0) | 16.4 q | 0.89 d (6.8) | 17.2 q | 0.98 d (6.8) |
| 13 | 16.2 q | 0.96 d (7.0) | 16.2 q | 0.84 d (6.8) | 17.4 q | 0.98 d (6.8) |
| 14 | 26.0 q | 1.20 s | 25.6 q | 1.11 s | 22.6 q | 0.99 s |
| 15 | 17.4 q | 1.90 s | 17.0 q | 1.72 s | 17.3 q | 1.77 s |
Compound 4 was assigned a molecular formula of C15H26O2, with three degrees of unsaturation, based on its HRESIMS (m/z 261.1831 [M + Na]+, calcd 261.1825) and NMR spectra (Table 2). Analysis of the 1H and 13C NMR data revealed that the planar structure of 4 is same with that of 3,7-dihydroxy-eudesma-4-ene,19 which was previously synthesized and reported with the uncertain configuration of C-3. In addition, the reported NMR data of H-3 (δH 4.13) was slightly different with that of compound 4 (δH 3.87) and the hydroxyl group at C-3 of compound 4 was β-oriented, as supported by NOESY correlations of H-3/H-1α (δH 1.42) and H-1α/H3-14 (δH 0.99). Thus, the structure of 4 was determined as (3S,7R,10S)-3,7-dihydroxy-eudesma-4Z-ene.
Compound 5 was deduced to have the molecular formula, C17H26O3, from its HRESIMS (m/z 279.1949 [M + H]+, calcd 279.1955) and 13C NMR data, indicating five indices of hydrogen deficiency. Comparison of the 1D NMR data (Table 3) with those of compound 3 showed the absence of a hydroxyl group and the presence of a acetyl group (δH 2.13; δC 21.4 and 170.2) at C-6. The HMBC correlations from H-3 (δH 3.80) to C-7 (δC 78.3) of compound 5 and the one more degree of unsaturation compared with compound 3 suggested the presence of an oxygen bridge connecting C-3 and C-7. The NOESY correlations between H-1α (δH 1.44) and H3-14 (δH 1.12), H3-14 and H-9α (δH 1.52) as well as H-1β (δH 1.62) and H-9β (δH 1.48) supported the relative configuration of 5, and the structure of 5 was assigned as (3S,6R,7S,10S)-3,7-epoxy-6-acetoxy-eudesma-4E-ene from a biosynthetic standpoint.
| Pos. | 5 | 6 | ||
|---|---|---|---|---|
| δC | δH | δC | δH | |
| 1α | 34.7 t | 1.44 dt (13.2, 4.2) | 31.4 t | 1.88 m |
| 1β | 1.62 m | |||
| 2α | 27.6 t | 1.72 m | 28.2 t | 2.35 m |
| 2β | ||||
| 3 | 70.7 d | 3.80 br s | 177.7 s | |
| 4a | 130.6 s | 34.0 t | 1.90 m | |
| 4b | 1.75 m | |||
| 5 | 135.4 s | 24.7 t | 2.35 m | |
| 6 | 75.6 d | 5.61 s | 170.0 s | |
| 7 | 78.3 s | 122.5 d | 5.79 s | |
| 8α | 25.2 t | 1.72 m | 203.7 s | |
| 8β | 1.55 m | |||
| 9α | 37.6 t | 1.52 m | 43.2 s | |
| 9β | 1.48 m | |||
| 10 | 37.8 s | 35.5 d | 2.39 sept (6.9) | |
| 11 | 33.4 d | 2.05 sept (7.2) | 20.9 q | 1.11 d (6.9) |
| 12 | 16.6 q | 0.84 d (7.2) | 20.9 q | 1.01 d (6.9) |
| 13 | 17.5 q | 0.98 d (7.2) | 22.0 q | 1.09 s |
| 14 | 22.8 q | 1.12 s | ||
| 15 | 17.7 q | 1.88 s | ||
| OAc | 170.2 s | |||
| 21.4 q | 2.13 s | |||
Compound 6 displayed a molecular formula of C13H20O3, as determined by its NMR (Table 3) and HRESIMS (m/z 225.1481 [M + H]+, calcd 225.1485) data and was assigned as a norsesquiterpenoid. It was found to represent one trisubstituted double bond (δC 170.0 and δH 5.79 s, δC 122.5), one carbonyl group (δC 203.7), one carboxyl group (δC 177.7), one isopropyl group [δH 2.39 sept (6.9), δC 35.5; δH 1.01 d (6.9), δC 20.9 & δH 1.11 d (6.9), δC 20.9] and one tertiary methyl (δH 1.09 s, δC 22.0). The structure of this 4,5-scco-eudesmane-type norsesquiterpenoid was confirmed by the HMBC correlations (Fig. 2) from H3-13 to C-1 (δC 31.4), C-4 (δC 34.0), C-8 (δC 203.7) and C-9 (δC 43.2 s) as well as from H2-2 (δH 2.35 m) to C-3 (δC 177.7). As C-9 is the sole chiral center in the structure, absolute configuration of 6 was confirmed by comparing their specific rotation with the data in literature,20 and its structure was defined as (9S)-4,5-seco-4-nor-3-carboxy-9-oxo-eudesma-6E-ene.
One known ent-eudesmane-type sesquiterpenoid, namely, (6R,7S,10R)-6,7-dihydroxy-3-oxo-eudesma-4E-ene (7), was isolated and identified by comparing their observed and reported ESIMS and NMR data.21
2.2. Preliminary anti-DN activity testing of isolated compounds
The anti-DN activities of compounds 1–7 were evaluated. Among them, the cyperane-type sesquiterpenoids 1 and 2 can inhibit cell proliferation and ECM (FN and Col IV) accumulation in rat glomerular MCs cultured under high glucose condition. As shown in Fig. 6A, compared with normal glucose (NG) and isoosmotic mannitol (Man) control groups, high glucose (HG) dramatically promoted MC proliferation and treatment with compound 1 or 2 could inhibit HG-induced MC proliferation in a concentration-dependent manner. The accumulation of glomerular ECM proteins is involved the development of DN. Thus, we measured the effect of isolated sesquiterpenoids on ECM proteins expression in MCs induced by HG. The results of ELISA and western blot analysis demonstrated that, compared with control groups, the protein expression levels of FN and Col IV were markedly increased in HG group. Strikingly, compounds 1 (40 μM) and 2 (80 μM) obviously reversed HG-induced protein expression levels of FN and Col IV in MCs (Fig. 6B–E). In addition, cytotoxic test against MCs was carried out using the MTT method, and the results showed that all the compounds exhibited no toxic effects at 80 μM.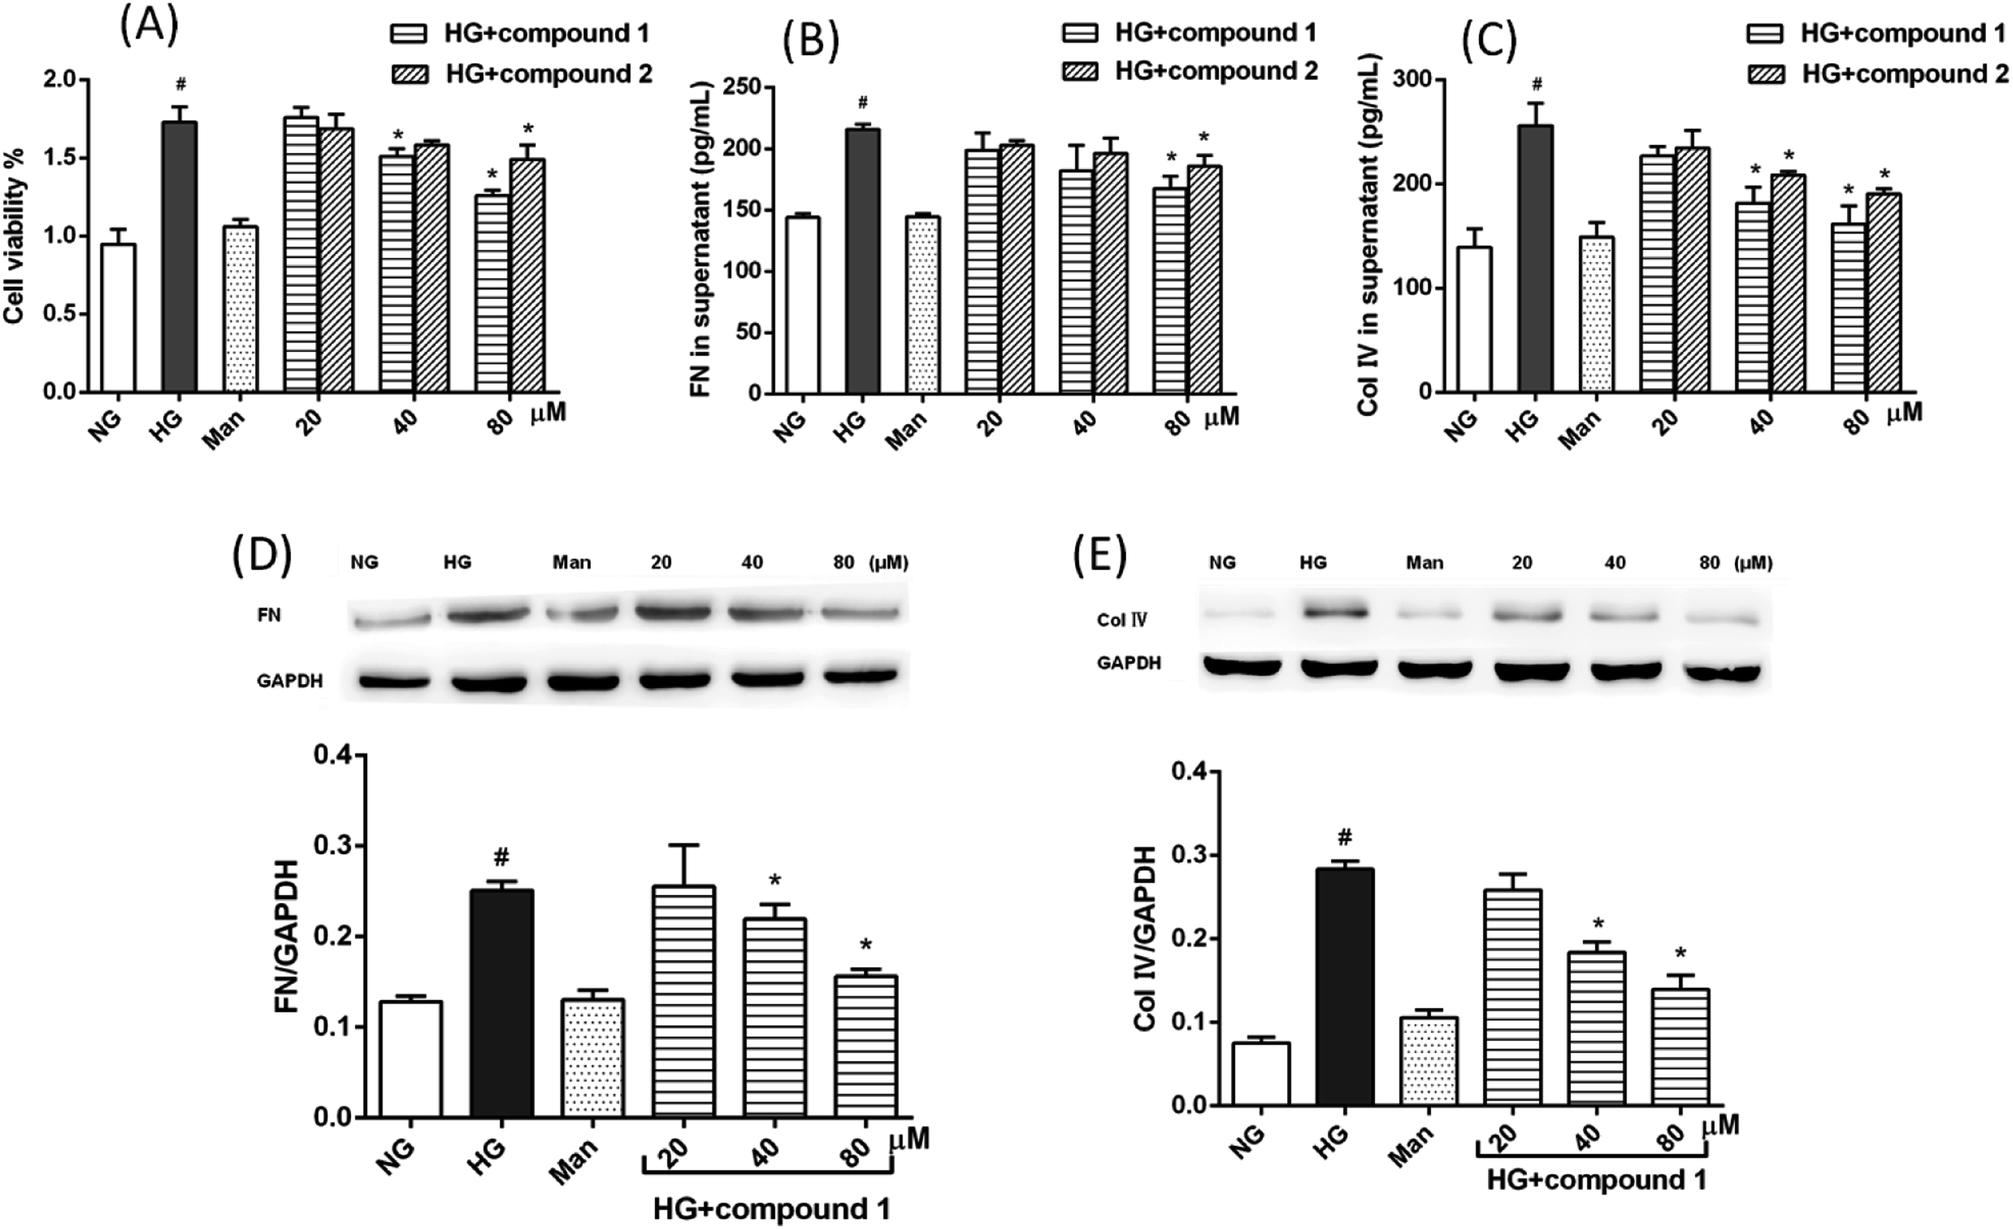 | ||
| Fig. 6 Inhibitory effects of compounds 1 and 2 on high glucose-cultured rat glomerular MCs. (A) Compounds 1 and 2 inhibit HG-induced MC proliferation. (B–E) Compounds 1 and 2 inhibit HG-induced ECM (FN and Col IV) expression in MCs. (B and C) The productions of FN and Col IV in MCs cultured under different conditions were tested by ELISA. (D and E) Western blot analysis were performed to detect the protein expression levels of FN and Col IV, MCs cultured under different conditions. NG: cells treated with 5.5 mM glucose; Man: cells treated with 5.5 mM glucose plus 24.5 Mm; HG: cells treated with high glucose 30 mM. Data are presented as the means ± SEM, n = 3. #P < 0.05 vs. NG; *P < 0.05 vs. HG. | ||
3. Experimental section
3.1. General experimental procedures
NMR spectra were recorded on a Bruker Avance DRX-600 spectrometer (1H: 600 MHz, 13C: 150 MHz) and Bruker Avance AVIII-400 spectrometer (1H: 400 MHz, 13C: 100 MHz), and TMS was used as internal standard. HRESIMS were obtained using an LTQ-Orbitrap XL. Melting points were measured using an X-6 micro-melting point apparatus (uncorrected). Optical rotations were acquired on a MCP 200 modular circular polarimeter. UV data were recorded using a Shimadzu UV-2550 spectrophotometer. ECD spectra were performed on a Chirascan spectropolarimeter. IR spectra were measured on a Nicolet iN 10 Micro FTIR spectrometer. HPLC was carried out on an Agilent 1200 series instrument with Eclipse XDB-C18 5 μm columns (4.6 × 250 mm and 9.4 × 250 mm). MCI gel (CHP20P, 75–150 μm, Mitsubishi Chemical Industries Ltd.), silica gel (200–300 mesh; Yantai Huanghai Chemical Co. Ltd.), Sephadex LH-20 (25–100 μm; Pharmacia), and reversed-phase C18 silica gel (150–200 mesh, Merck) were used for column chromatography.3.2. Plant material
Whole plants of C. polyanthus were collected from wet soil along the River of Changbaishan Mountain, Jilin Province, People's Republic of China, in July 2014, and identified by Dr Jinchuan Zhou (College of Pharmaceutical Sciences, Linyi University). A voucher specimen (no. 20140725-09) has been deposited at the Department of Natural Products Chemistry, School of Pharmaceutical Sciences, Shandong University, People's Republic of China.3.3. Extraction and isolation
The air-dried and milled plant material from C. polyanthus var. rivularis (780 g) was extracted with 95% EtOH (4 × 1.5 L, each for one week) at room temperature and filtered. The filtrate was evaporated under reduced pressure at 40 °C to afford the crude extract (36.0 g), which was suspended in H2O (250 mL) and partitioned successively with Et2O (3 × 250 mL) and n-BuOH (3 × 250 mL). The Et2O fraction (8.0 g) was separated by MCI gel column chromatography (MeOH–H2O, 3![[thin space (1/6-em)]](https://www.rsc.org/images/entities/char_2009.gif) :7 to 9:1) and gave fractions 1–4. Fraction 2 (1.6 g) was chromatographed using a silica gel column [petroleum ether (60–90 °C)–acetone, 200:1 to 0:1] to give subfractions 2A–2F. Fraction 2E (292.6 mg) was applied to a Sephadex LH-20 column (MeOH) and a RP-18 silica gel column (MeOH/H2O, 5:5 to 10:0) to afford subfractions E1–E7. Subfraction E5 (94.5 mg) was purified by HPLC to afford 1 (19.4 mg), and 3 (3.5 mg) was afforded from subfraction E1 (17.71 mg) by recrystallization. Fraction 2F (345.1 mg) was subjected to a Sephadex LH-20 column (MeOH) and an RP-18 silica gel column (MeOH–H2O, 4:6 to 9:1) to afford subfractions F1–F8. Subfraction F1 (7.59 mg) was purified using HPLC to yield 4 (2.7 mg) and 6 (0.8 mg). Subfraction F2 (20.3 mg) was purified using HPLC to yield 7 (6.2 mg). Subfraction F6 (20.9 mg) was purified using HPLC to yield 2 (5.1 mg), and 5 (1.1 mg).
ε) 200 (3.38) nm; ECD (MeOH) 302 (Δε 0.54) nm; IR νmax 3086, 2960, 2877, 2741, 1680, 1010 cm−1; 1H and 13C NMR data, see Table 1; HRESIMS m/z 277.1777 [M + Na]+ (calcd for C15H26O3Na, 277.1774).ε) 200 (3.38) nm; ECD (MeOH) 299 (Δε −0.06) nm; IR νmax 3385, 2956, 2932, 2874, 1685, 1081 cm−1; 1H and 13C NMR data, see Table 1; HRESIMS m/z 277.1766 [M + Na]+ (calcd for C15H26O3Na, 277.1774).ε) 242 (3.01) nm; ECD (MeOH) 216 (Δε +0.07) nm, 255 (Δε +0.06) nm; IR νmax 3391, 2931, 2875, 1698, 1649, 982 cm−1; 1H and 13C NMR data, see Table 2; HRESIMS m/z 277.1775 [M + Na]+ (calcd for C15H26O3Na, 277.1774).ε) 240 (3.00); 300 (2.67) nm; ECD (MeOH) 209 (Δε −3.38) nm; IR νmax 2962, 2918, 2850, 1710, 1662, 1462, 1218 cm−1; 1H and 13C NMR data, see Table 2; HRESIMS m/z 261.1831 [M + Na]+ (calcd for C15H26O2Na, 261.1825).ε) 299 (2.72) nm; ECD (MeOH) 252 (Δε −0.23) nm, 342 (Δε −0.16) nm; IR νmax 3393, 2958, 2953, 2874, 1738, 1240 cm−1; 1H and 13C NMR data, see Table 3; HRESIMS m/z 279.1949 [M + H]+ (calcd for C17H27O3, 279.1955).ε) 237 (3.51) nm; ECD (MeOH) 262 (Δε 0.26) nm; IR νmax 2962, 2918, 2850, 1710, 1662, 1462, 1218 cm−1; 1H and 13C NMR data, see Table 3; HRESIMS m/z 225.1481 [M + H]+ (calcd for C13H21O3, 255.1485).
:7 to 9:1) and gave fractions 1–4. Fraction 2 (1.6 g) was chromatographed using a silica gel column [petroleum ether (60–90 °C)–acetone, 200:1 to 0:1] to give subfractions 2A–2F. Fraction 2E (292.6 mg) was applied to a Sephadex LH-20 column (MeOH) and a RP-18 silica gel column (MeOH/H2O, 5:5 to 10:0) to afford subfractions E1–E7. Subfraction E5 (94.5 mg) was purified by HPLC to afford 1 (19.4 mg), and 3 (3.5 mg) was afforded from subfraction E1 (17.71 mg) by recrystallization. Fraction 2F (345.1 mg) was subjected to a Sephadex LH-20 column (MeOH) and an RP-18 silica gel column (MeOH–H2O, 4:6 to 9:1) to afford subfractions F1–F8. Subfraction F1 (7.59 mg) was purified using HPLC to yield 4 (2.7 mg) and 6 (0.8 mg). Subfraction F2 (20.3 mg) was purified using HPLC to yield 7 (6.2 mg). Subfraction F6 (20.9 mg) was purified using HPLC to yield 2 (5.1 mg), and 5 (1.1 mg).
ε) 200 (3.38) nm; ECD (MeOH) 302 (Δε 0.54) nm; IR νmax 3086, 2960, 2877, 2741, 1680, 1010 cm−1; 1H and 13C NMR data, see Table 1; HRESIMS m/z 277.1777 [M + Na]+ (calcd for C15H26O3Na, 277.1774).ε) 200 (3.38) nm; ECD (MeOH) 299 (Δε −0.06) nm; IR νmax 3385, 2956, 2932, 2874, 1685, 1081 cm−1; 1H and 13C NMR data, see Table 1; HRESIMS m/z 277.1766 [M + Na]+ (calcd for C15H26O3Na, 277.1774).ε) 242 (3.01) nm; ECD (MeOH) 216 (Δε +0.07) nm, 255 (Δε +0.06) nm; IR νmax 3391, 2931, 2875, 1698, 1649, 982 cm−1; 1H and 13C NMR data, see Table 2; HRESIMS m/z 277.1775 [M + Na]+ (calcd for C15H26O3Na, 277.1774).ε) 240 (3.00); 300 (2.67) nm; ECD (MeOH) 209 (Δε −3.38) nm; IR νmax 2962, 2918, 2850, 1710, 1662, 1462, 1218 cm−1; 1H and 13C NMR data, see Table 2; HRESIMS m/z 261.1831 [M + Na]+ (calcd for C15H26O2Na, 261.1825).ε) 299 (2.72) nm; ECD (MeOH) 252 (Δε −0.23) nm, 342 (Δε −0.16) nm; IR νmax 3393, 2958, 2953, 2874, 1738, 1240 cm−1; 1H and 13C NMR data, see Table 3; HRESIMS m/z 279.1949 [M + H]+ (calcd for C17H27O3, 279.1955).ε) 237 (3.51) nm; ECD (MeOH) 262 (Δε 0.26) nm; IR νmax 2962, 2918, 2850, 1710, 1662, 1462, 1218 cm−1; 1H and 13C NMR data, see Table 3; HRESIMS m/z 225.1481 [M + H]+ (calcd for C13H21O3, 255.1485).3.4. Crystallographic analysis of compounds 1 and 3
Diffraction intensities for 1 and 3 were collected at 291.15 K on a Bruker Apex2 CCD diffractometer using Cu Kα radiation, using Olex2.22 The structure was solved with the ShelXS structure solution program using direct methods and refined with the ShelXL refinement package using least squares minimization.23Compound 1 (C15H26O3, M = 254.36 g mol−1): monoclinic, space group P1, a = 6.9631(10) Å, b = 10.2646(14) Å, c = 15.2511(15) Å, V = 730.66(18) Å3, Z = 2, Dcalcd = 1.156 g cm−3, μ (Cu Kα) = 0.623 mm−1, F(000) = 280, R (reflections) = 0.0382(4571), wR2 (reflections) = 0.0955(5123). The flack parameter was −0.13(11). Details of crystallographic data for 1 have been deposited with the Cambridge Crystallographic Data Centre as supplementary publication number CCDC 1471130.
Compound 3 (C15H26O3, M = 254.36 g mol−1): monoclinic, space group P21 (no. 4), a = 10.0560(4) Å, b = 8.2456(4) Å, c = 17.0806(8) Å, V = 1416.28(11) Å3, Z = 2, Dcalcd = 1.193 g cm−3, μ (Cu Kα) = 0.643 mm−1, F(000) = 560, R (reflections) = 0.1302(3373), wR2 (reflections) = 0.3291(4420). The flack parameter was 0.0(4). Details of crystallographic data for 3 have been deposited with the Cambridge Crystallographic Data Centre as supplementary publication number CCDC 1863078.
3.5. Anti-DN activity tests
Cell proliferation was measured by 3-(4,5-dimethylthiazol-2-yl)-2,5-diphenyl tetrazolium bromide (MTT) assay. In brief, after treatment, 10 μL of MTT (5 mg mL−1; Sigma Chemical Co., St. Louis, MO, USA) was added to each well and incubation continued at 37 °C for 4 h. Then, 150 mL of DMSO (Sigma Chemical Co., St. Louis, MO, USA) was added into each well and the absorbance was measured at 570 nm using a microplate reader (Bio-Rad, Hercules, CA, USA).
:1000), including FN, Col IV and GAPDH, followed by incubation with horseradish peroxidase-conjugated goat anti-rabbit immunoglobulin G (Santa Cruz Biotechnology, Santa Cruz, CA, USA) diluted 1:5000 in the blocking buffer for 2 h. Bound proteins were visualized with the chemiluminescence (ECL) detection system (Amersham, Little Chalfont, UK). Relative protein band density was quantified by image J software.4. Conclusions
In summary, six undescribed sesquiterpenoids, including cyperane and eudesmane types, and one known sesquiterpenoid, were isolated from the Chinese liverwort Chiloscyphus polyanthus var. rivularis (Schrad.) Nees. Their structures were determined by their spectroscopic data, single-crystal X-ray diffraction, and ECD calculations.Biogenetically, the cyperane-type sesquiterpenoid is a kind of rearranged eudesmane-type sesquiterpenoid,16 that is relatively uncommon and has only been isolated from a handful of plants, such as Tritomaria quinquedentata,13 Achillea clypeolata,16 and Cyperus rotundu.24 Our study has enriched the chemical and biological diversity of this small group of natural sesquiterpenoids. Additionally, compound 2 is the first trans-cyperane-type sesquiterpenoid. The co-presence of 1 and 2 confirmed that cyperane-type sesquiterpenoids formed through the cleavage at C-4/C-5 and the linkage at C-3/C-5 on the basis of eudesmane skeleton.
Conflicts of interest
There are no conflicts exist.Acknowledgements
This work was supported financially by the National Natural Science Foundation of China (No. 81630093 and 81703375), and Natural Science Foundation of Shandong Province, China (ZR2017BH068).References
- J. L. Gross, M. J. de Azevedo, S. P. Silveiro, L. H. Canani, M. L. Caramori and T. Zelmanovitz, Diabetes Care, 2005, 28, 164–176 CrossRef PubMed.
- A. Y. Wu, N. L. F. Kong, C. Y. Pan, T. Y. Tai, V. T. Yeung, S. J. Yoo, A. Rouillon and M. R. Weir, Diabetologia, 2005, 48, 17–26 CrossRef CAS PubMed.
- R. Kikkawa, D. Koya and M. Haneda, Am. J. Kidney Dis., 2003, 41, 19–21 CrossRef PubMed.
- R. M. Mason and N. A. Wahab, J. Am. Soc. Nephrol., 2003, 14, 1358–1373 CrossRef CAS PubMed.
- K. R. Tuttle, J. Am. Soc. Nephrol., 2005, 16, 1537–1538 CrossRef PubMed.
- D. Fineberg, K. A. Jandeleit-Dahm and M. E. Cooper, Nat. Rev. Endocrinol., 2013, 9, 713–723 CrossRef CAS PubMed.
- J. B. He, J. Luo, L. Zhang, Y. M. Yan and Y. X. Cheng, Org. Lett., 2013, 15, 3602–3605 CrossRef CAS PubMed.
- Q. Q. Jia, J. C. Wang, J. Long, Y. Zhao, S. J. Chen, J. D. Zhai, L. B. Wei, Q. Zhang, Y. Chen and H. B. Long, Molecules, 2013, 18, 13061–13077 CrossRef CAS PubMed.
- T. F. Tzeng, S. S. Liou, C. J. Chang and I. M. Liu, Nutr. Metab., 2013, 10, 64 CrossRef PubMed.
- Y. M. Yan, P. Fang, M. T. Yang, N. Li, Q. Lu and Y. X. Cheng, J. Ethnopharmacol., 2015, 165, 141 CrossRef CAS PubMed.
- Y. Asakawa, Pure Appl. Chem., 2007, 79, 557–580 CAS.
- Y. Asakawa, A. Ludwiczuk and F. Nagashima, Phytochemistry, 2013, 91, 52–80 CrossRef CAS PubMed.
- S. Li, H. Shi, W. Chang, Y. Li, M. Zhang, Y. Qiao and H. Lou, Bioorg. Med. Chem., 2017, 25, 5764–5771 CrossRef CAS PubMed.
- J. Zhang, P. Fan, R. Zhu, R. Li, Z. Lin, B. Sun, C. Zhang, J. Zhou and H. Lou, J. Nat. Prod., 2014, 77, 1031–1036 CrossRef CAS PubMed.
- J. Z. Zhang, Y. N. Qiao, L. Li, Y. J. Wang, Y. Li, X. Fei, J. C. Zhou, X. Wang, P. H. Fan and H. X. Lou, Planta Med., 2016, 82, 1128–1133 CrossRef CAS PubMed.
- M. N. Todorova and E. T. Tsankova, Phytochemistry, 1999, 52, 1515–1518 CrossRef CAS.
- A. Baykal, S. Chakraborty, A. Dodoo and F. Jordan, Bioorg. Chem., 2006, 34, 380–393 CrossRef CAS PubMed.
- B. Ma, Z. Q. Lu, H. F. Guo and H. X. Lou, Helv. Chim. Acta, 2007, 90, 52–57 CrossRef CAS.
- J. P. Kutney and A. K. Singh, Can. J. Chem., 1982, 13, 1842–1846 CrossRef.
- H. Hikino, Y. Hikino and T. Takemoto, Chem. Pharm. Bull., 1965, 13, 1417–1421 CrossRef CAS PubMed.
- S. Li, H. Niu, Y. Qiao, R. Zhu, Y. Sun, Z. Ren, H. Yuan, Y. Gao, Y. Li, W. Chen, J. Zhou and H. Lou, Bioorg. Med. Chem., 2018, 26, 2392–2400 CrossRef CAS PubMed.
- O. V. Dolomanov, L. J. Bourhis, R. J. Gildea, J. A. K. Howard and H. Puschmann, J. Appl. Crystallogr., 2009, 42, 339–341 CrossRef CAS.
- G. M. Sheldrick, Acta Crystallogr., 2008, 64, 112–122 CrossRef CAS PubMed.
- H. Hikino, K. Aota, Y. Maebayashi and T. Takemoto, Chem. Pharm. Bull., 1967, 15, 1349 CrossRef CAS PubMed.
Footnote |
| † Electronic supplementary information (ESI) available. CCDC 1471130 and 1863078. For ESI and crystallographic data in CIF or other electronic format see DOI: 10.1039/c8ra08125e |
| This journal is © The Royal Society of Chemistry 2018 |