DOI:
10.1039/C8RA08027E
(Paper)
RSC Adv., 2018,
8, 36280-36285
XPS and Raman study of the active-sites on molybdenum disulfide nanopetals for photocatalytic removal of rhodamine B and doxycycline hydrochlride†
Received
27th September 2018
, Accepted 19th October 2018
First published on 25th October 2018
Abstract
Molybdenum disulfide (MoS2) nanopetals were successfully synthesized by hydrothermal method (sample without sintering) and then sintered at different temperature (sintered samples). The products were characterized by X-ray powder diffraction (XRD), scanning electron microscopy (SEM), transmission electron microscopy (TEM), nitrogen (N2) adsorption analyses for Brunauer–Emmett–Teller (BET) specific surface area measurements, X-ray photoelectron spectrum (XPS) and Raman spectrum. XRD pattern indicated that the samples can be indexed to hexagonal phase 2H-MoS2. SEM and TEM images showed that the sintered MoS2 nanopetals had sizes ranging from 150 to 300 nm with almost the same morphology. The pore structure and surface area were nearly the same for the three sintered MoS2 nanopetals. Interestingly, XPS and Raman spectra implied that there was a few 1T-phase in the MoS2 nanopetals which enhanced the photocatalytic performance greatly when sintered at low temperature.
Introduction
MoS2 with S–Mo–S sandwich layer structure1 has some applications including catalytic hydrodesulfurization of petroleum,2,3 wear resistance,4,5 energy storage6,7 and photocatalysis application.8,9 For all the above applications, the number of the active-sites plays a crucial role. In the conventional 2H phase MoS2 (2H-MoS2), the active-sites locate only in the exposed edges of the layers,10,11 while in the 1T phase MoS2 (1T-MoS2) they locate in both the surface and exposed edges of the layers.12,13 The more the active-sites, the better the adsorption ability, which results in better photocatalytic performance in 1T-MoS2 than that in 2H-MoS2 under the same conditions. However, 1T-MoS2 is a metastable state, which is hard to synthesize.12 Thus many researchers have focused on the synthesis of various morphologies of 2H-MoS2 to improve the number of the active-sites by constructing excessive exposed edges of the layers. MoS2 nanoflakes,14,15 nanosheets,16 nanowires,17,18 nanotubes,19 nanoribbons20 and nanoflowers21,22 were prepared to increase their active-sites and enhance their photocatalytic performance. Here we have prepared petal-spherical like MoS2 photocatalysts by hydrothermal method and some of the samples were then sintered at 573 K, 673 K and 773 K for 4 h, respectively. We studied four samples, the sample without sintering (as-prepared), and the samples sintered at 573 K, 673 K and 773 K, respectively. We found that the photocatalytic removal of Rhodamine B (RhB) and doxycycline hydrochloride (DCHC) in the sintered samples were better than that in the as-prepared sample. The sample sintered at 573 K could remove 99% of RhB and DCHC in 60 min. However, after sintered at higher temperature of 673 K and 773 K their photocatalytic performance decreased to some extent. We studied their XRD, SEM, TEM, BET specific surface area, XPS and Raman data to find the effect of the active-sites in the MoS2 nanopetals.
Results and discussion
Structure and morphology of MoS2 nanopetals
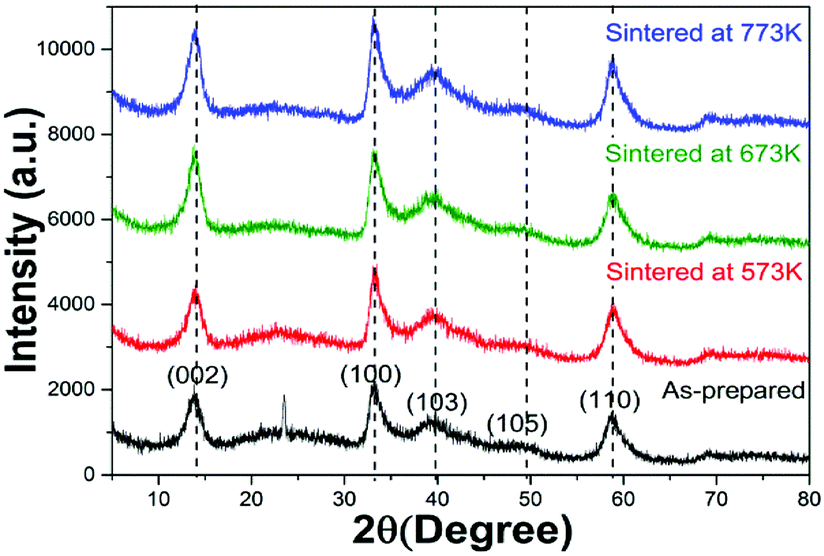
The XRD patterns of the four samples were shown in Fig. 1. The peaks located at around 13°, 34°, 39°, 50° and 58° corresponded to the (002), (100), (103), (105) and (110) reflections, respectively, which indicated that all the samples were 2H-MoS2 (JCPDS 37-1492)10,11 except for the as-prepared sample. For the as-prepared sample, there was an unknown peak located at about 24° which might be sort of organic substance. After sintered, the impurity disappeared. With the sintered temperature increasing, one could not observe obvious differences between the three samples. There was no sign of the existence of 1T-MoS2 since most of XRD peaks of 1T-MoS2 overlapped with 2H-MoS2.12
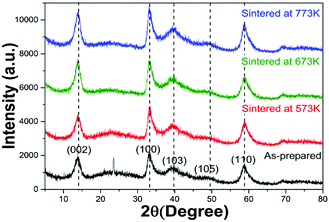 |
| | Fig. 1 XRD patterns of the four MoS2 samples. | |
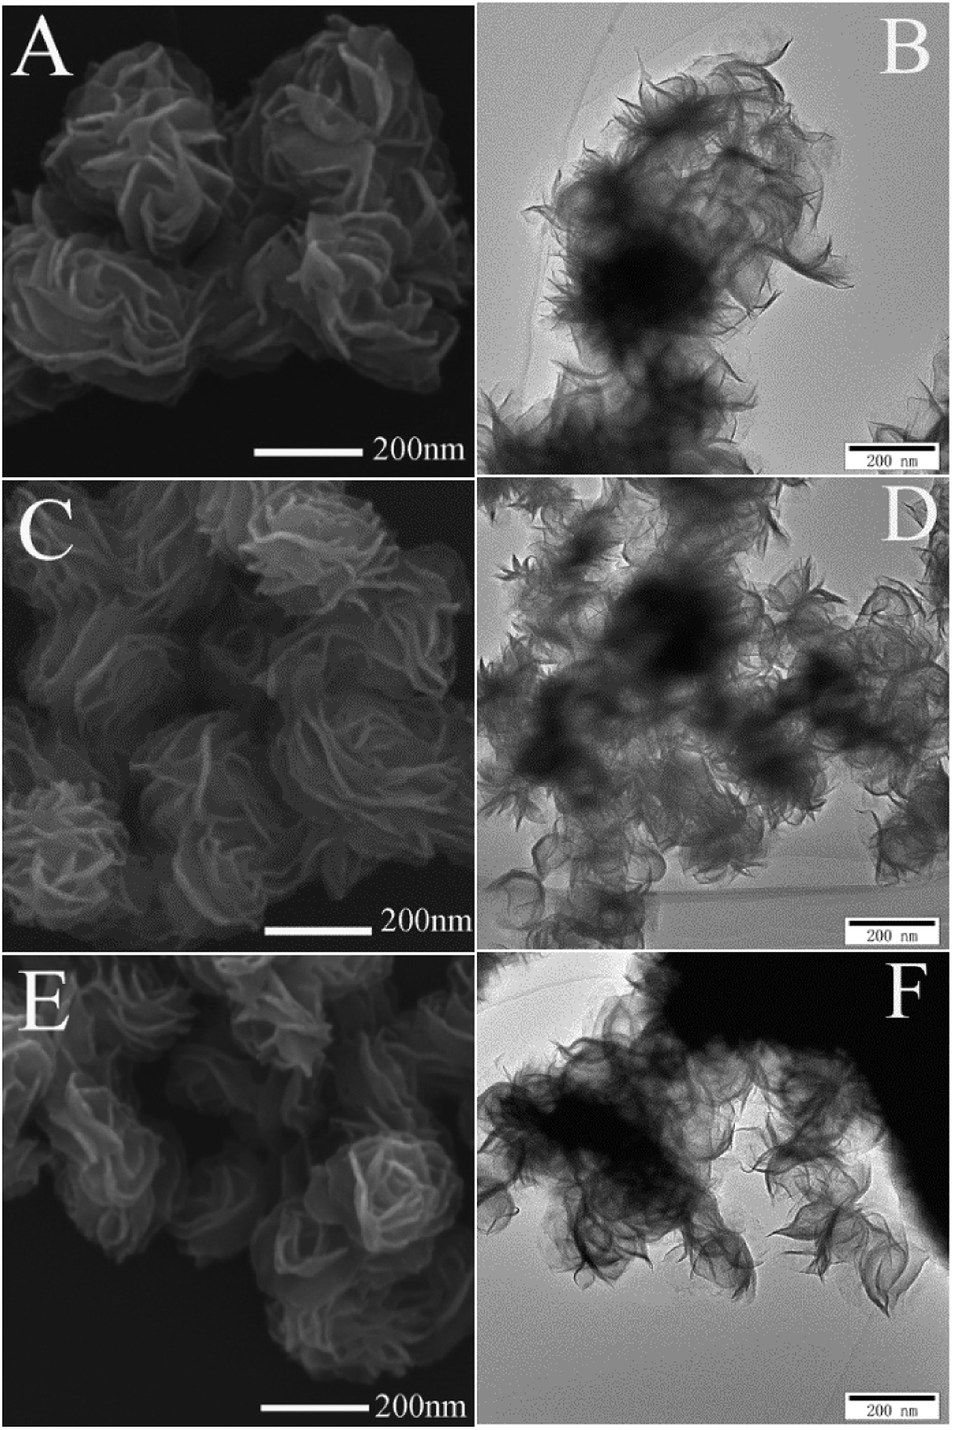
Fig. 2(A, C and E) showed the SEM images of the three sintered samples. They all had the similar shape of petal-spherical like and the diameter of the petals ranged from 150 to 300 nm. No obvious difference could be seen between them. Fig. 2(B, D and F) showed the corresponding TEM images. There was no apparent difference between the three samples either. Both the SEM and TEM images showed the sintered samples had indistinguishable morphology and the exposed petal edges of them varied little. Thus from XRD, SEM and TEM results, no distinguishable difference could be observed, which implied that the photocatalytic performance of the three samples sintered at different temperature would be similar.
 |
| | Fig. 2 SEM and TEM images of MoS2 nanopetals sintered at (A and B) 573 K, (C and D) 673 K and (E and F) 773 K. | |
Photocatalytic removal of RhB and DCHC
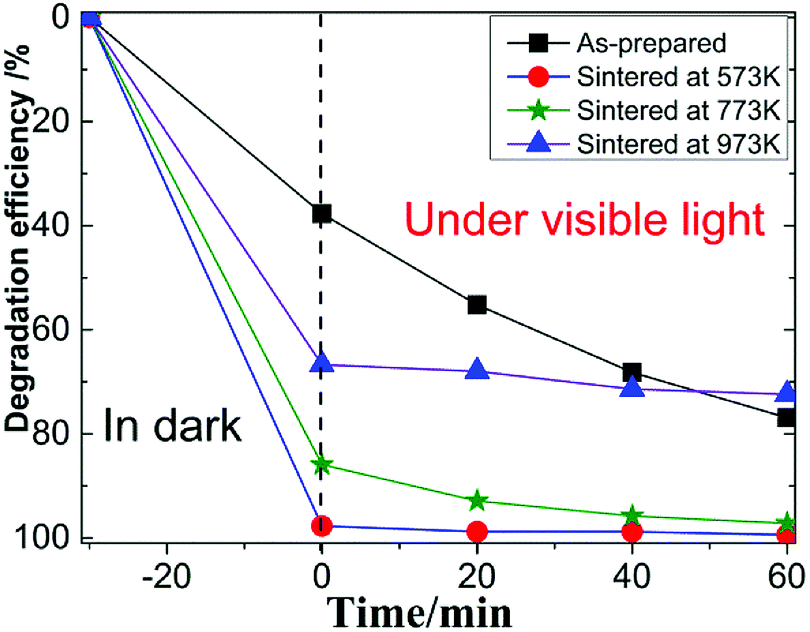
Fig. 3 showed the photocatalytic degradation of RhB by the four MoS2 nanopetals. It can be seen that after 30 min in dark, about 38% RhB were adsorbed by the as-prepared sample. Nearly 97%, 85% and 65% RhB were adsorbed by the sample sintered at 573 K, 673 K and 773 K, respectively. Since the as-prepared sample had a few organic impurities demonstrated in the above XRD section, the impurities would occupy some active-sites in the as-prepared sample, which weakened its ability to adsorb RhB. After sintered at different temperature, the other three samples all showed much better adsorption ability because the impurities would be removed after sintered. Under visible light, the final photocatalytic efficiency were 77%, 99%, 97% and 70% for the above four samples in 60 min.
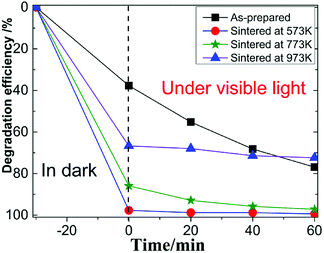 |
| | Fig. 3 Photocatalytic degradation of RhB. | |
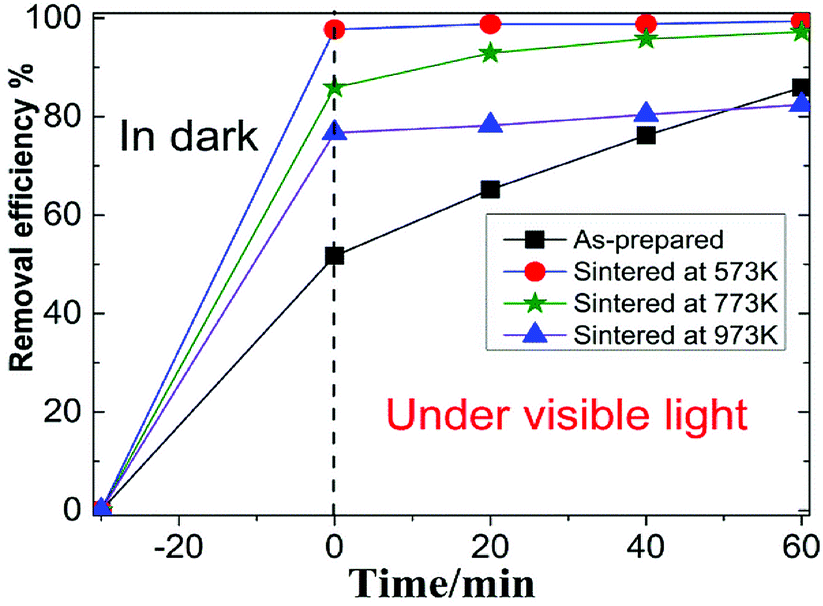
Fig. 4 showed the photocatalytic removal of DCHC by the four samples, which had similar phenomenon to that of photocatalytic of RhB demonstrated above. For the as-prepared sample, the whole process was nearly linear. While for the three sintered samples, the whole process would be divided into two types, excellent adsorption part in dark and ordinary photocatalytic degradation process under visible light. We focused our following research on the characteristics of the three sintered samples since they possessed similar process.23,24 The recycle performance of the sintered samples was tested and listed in Fig. S1 and S2.† After three cycles, the removal efficiency decreased about 30%. The decreasing of the adsorption ability of the three sintered samples implied that the specific surface area or the number of the active-sites in the three samples varied dramatically.
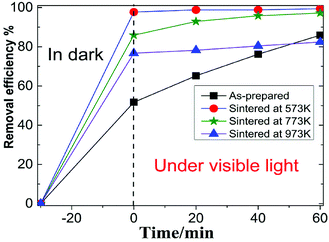 |
| | Fig. 4 Photocatalytic removal of DCHC. | |
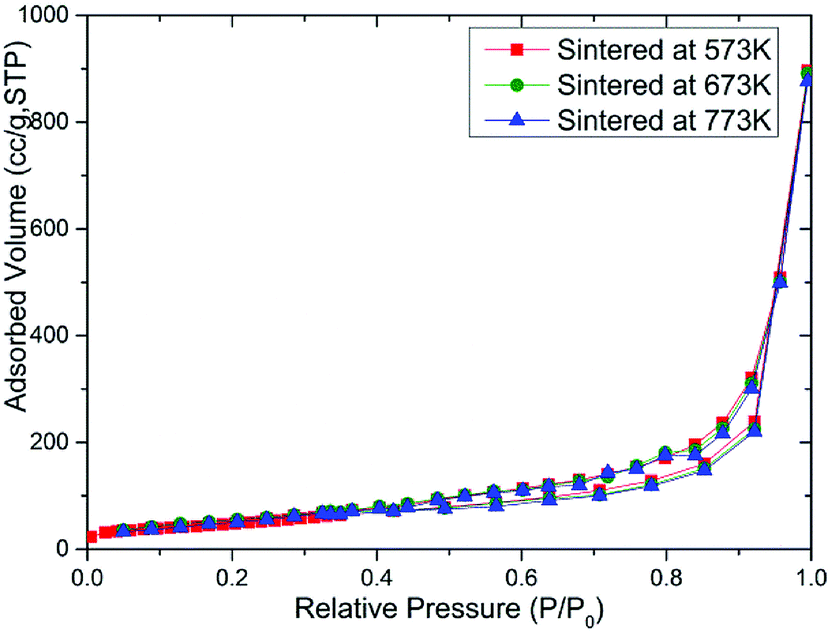
Pore structure and surface area determination
In order to study the effect of the specific surface area of the sintered MoS2 nanopetals, we had performed the N2 adsorption measurement on the above three samples. The BET isotherm data of the three sintered MoS2 samples were plotted in Fig. 5. According to the International Union of Pure and Applied Chemistry (IUPAC) classification, all the samples exhibited similar reversible type III isotherms,25,26 which demonstrated that the adsorption in the MoS2 nanopetals belonged to multilayer adsorption coincided with the morphology of the petal-spherical shown in the SEM images. The corresponding pore size distribution histograms of the three samples also showed almost the same pattern, which were plotted in Fig. S3.† The data summarized in Table S1† indicated that the BET specific surface area of the three sintered MoS2 samples were all around 140.00 m2 g−1. The similar pore size distribution and nearly the same specific surface area inferred that all the sintered samples should have similar adsorption ability without large difference. However it was contrary to the truth shown in Fig. 3 and 4. Thus, the effect of the active-sites in the sintered MoS2 nanopetals might be crucial.
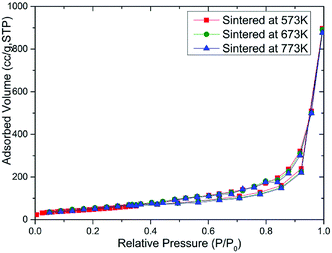 |
| | Fig. 5 BET isotherm of the sintered MoS2 samples. | |
Structural composition analysis of MoS2 nanopetals
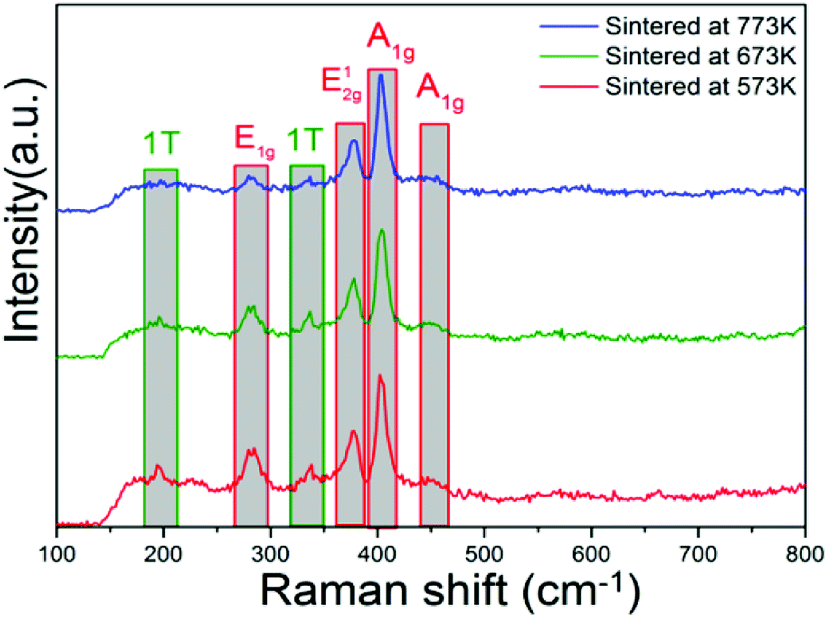
To find the variation of the active-sites in the MoS2 nanopetals with sintered temperature increasing, we performed the XPS and Raman measurements and explored the data in depth. Fig. 6 showed the Raman spectra of the above three sintered samples. The peaks located at around 282 cm−1 and 382 cm−1 corresponded to the E1g and E12g vibration modes of 2H-MoS2 and the peaks at about 403 cm−1 and 454 cm−1 corresponded to the A1g vibration modes of 2H-MoS2.12,13,27,28 Two small peaks at 197 cm−1 and 337 cm−1 corresponded to the phonon mode in 1T-MoS2.12,13,27,28 It could be observed that the intensity of the two 1T peaks decreased dramatically with the sintered temperature increasing. We calculated the ratios of the integral area of 1T peak at 197 cm−1 to 2H-A1g peak at 403 cm−1 and 1T peak at 337 cm−1 to 2H-A1g peak at 403 cm−1, respectively, the results were listed in Table 1. We assume that the active-sites played a crucial role for the photocatalytic removal of RhB and DCHC. Since the 1T-MoS2 possessed more active-sites than that in 2H-MoS2, the more 1T-MoS2, the more the active-sites in the nanopetals. With the sintered temperature increasing, more and more 1T-MoS2 transformed to 2H-MoS2, which resulted in the decreasing of the number of the active-sites in the sintered MoS2 nanopetals. Eventually, the photocatalytic removal of RhB and DCHC also decreased dramatically.
 |
| | Fig. 6 Raman spectra of the sintered MoS2 samples. | |
Table 1 The ratios of integral area of 1T peak to 2H-A1g peak in Raman spectra of the sintered MoS2 samples
| Sample |
1T (197 cm−1)/A1g (403 cm−1) |
1T (337 cm−1)/A1g (403 cm−1) |
| Sintered at 573K |
0.117 |
0.124 |
| Sintered at 673K |
0.064 |
0.123 |
| Sintered at 773K |
0.001 |
0.003 |
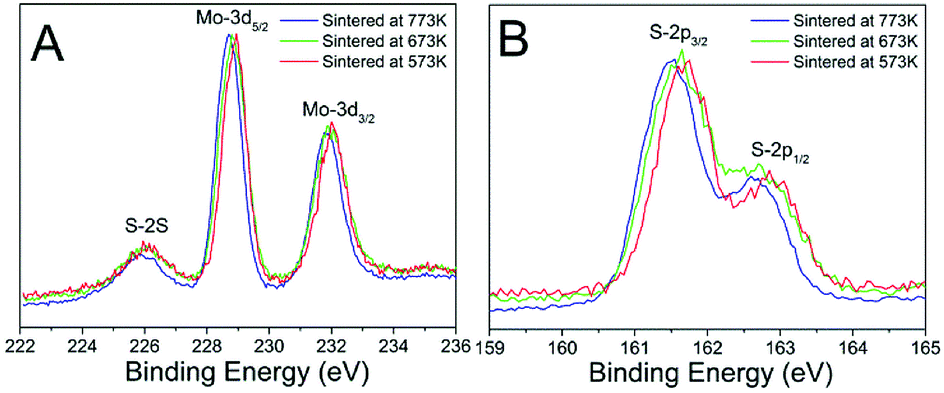
In order to confirm the above assumption, we carried out the XPS measurement of the Mo-3d and S-2p of the three sintered MoS2 samples and plotted the spectra in Fig. 7. It can be observed that the binding energy shifted to lower value for about 0.3 eV with the sintered temperature increasing, no other distinguishable difference could be observed. We deconvoluted the XPS data to analyse the phase contents of 1T-MoS2 and 2H-MoS2. The Mo-3d and S-2p peaks were deconvoluted to show the 1T-MoS2 and 2H-MoS2 contributions which were shown in Fig. S4.† Both the peaks of Mo-3d and the S-2p regions were shifted to lower energy of about 0.3 eV. The Mo-3d spectrum consisted of peaks at around 229.0 and 232.3 eV, which correspond to Mo4+-3d5/2 and Mo4+-3d3/2 components of the 2H-phase, respectively,13,23,24 and peaks at around 228.1 and 231.4 eV correspond to Mo4+-3d5/2 and Mo4+-3d3/2 components of the 1T-phase.13,23,24 The ratios of 1T-MoS2 in the three MoS2 samples were listed in Table 2.
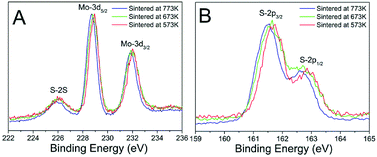 |
| | Fig. 7 XPS spectra of the MoS2 samples (A) Mo-3d; (B) S-2p. | |
Table 2 The contents of 1T-MoS2 in the sintered MoS2 samples
| Sample |
Mo4+-XPS |
S2+-XPS |
| Sintered at 573K |
12.19% |
11.40% |
| Sintered at 673K |
9.70% |
9.21% |
| Sintered at 773K |
3.61% |
3.70% |
It was clear that the content of 1T-MoS2 decreased from 12.19% to 4.60% with the sintered temperature increased from 573 K to 773 K, which coincided with the analysis of the above Raman spectra that 1T-MoS2 was unstable and reduced notably when sintered at high temperature.12,13,27,28 The analysis of the S-2p peaks also showed the similar results that the content of 1T-MoS2 decreased from 11.40% to 3.70%.
The crucial role of active-sites
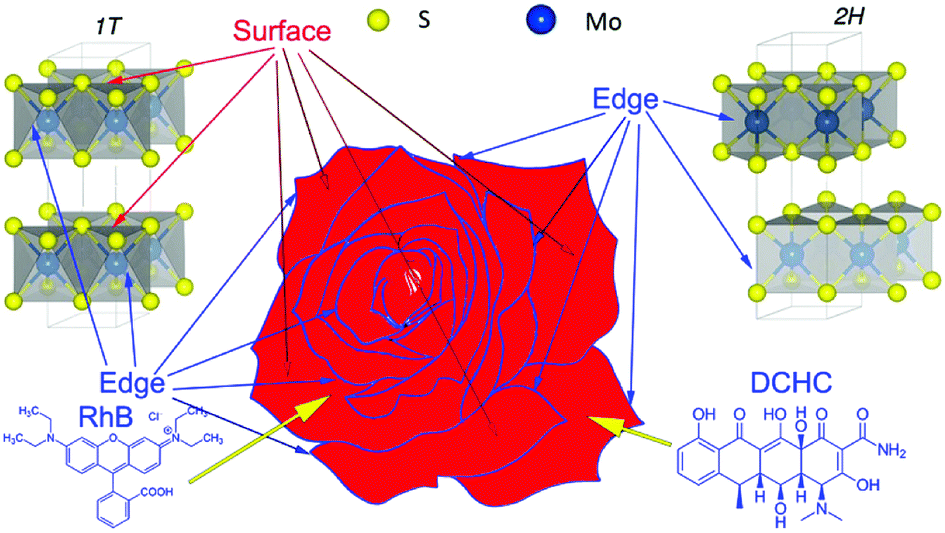
To demonstrate clearly the assumption that the active-sites in the 1T-phase played a crucial role for the photocatalytic removal of RhB and DCHC, we plotted Fig. 8 to show the active-sites distribution in the nanopetals. It could be observed that the petals stacked and formed the shape of rose-like and there were two kinds of active-sites on the petals, one located on the blue edges of the petals and the other located on the red surface of the petals. In the 2H-MoS2 there was only one kind of active-sites located on the blue edges of petals which corresponded to the edges of the S–Mo–S layers.12,13 While In the 1T-MoS2, both the blue edges and the red surface of the petals would be the active-sites,12,13 which corresponded to the surface of the S layers in MoS2.12,13 So for the three sintered samples, the active-sites located on the edges of the petals had an overall majority which would absorb RhB and DCHC as demonstrated by the blue arrows in Fig. 8. The active-sites located on the red surface of the petals would only work when the petals contained of 1T-MoS2. For the MoS2 nanopetals sintered at 573 K, besides the active-sites located on the blue edges of the petals, there would be a small amount of 1T-MoS2 nanopetals with active-sites located on tiny amounts of red surface of the petals, which made this sample have the best photocatalytic performance among the three samples. With the sintered temperature increased the 1T-MoS2 would transform to 2H-MoS2, which resulted in the content of the 1T-MoS2 decreased and the 2H-MoS2 increased. Although the number of petals and the active-sites located on the edges of the petals remained almost unchanged, the active-sites located on the surface of the 1T-MoS2 nanopetals decreased substantially, which resulted in the decrease of the photocatalytic performance for removal of RhB and DCHC. After absorbed by the active-sites on the petals, when under visible light, RhB and DCHC would be photodegraded by the superoxide radical and hydroxyl radical generated by the photogenerated electrons and holes, respectively.13,29
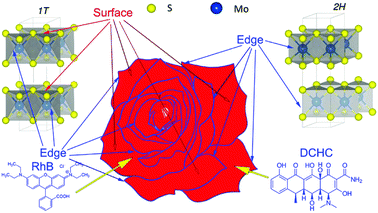 |
| | Fig. 8 Schematic diagram of photocatalytic removal of RhB and DCHC on MoS2 nanopetals. | |
Experimental
Synthetic procedures
The chemicals used in this paper were of analytic purity and used without further purification. According to the synthetic methods in the relevant ref. 21, 22, 30 and 31, 250 mg of Na2MoO4·2H2O and 200 mg of CH3CSNH2 were dissolved in 60 mL of distilled water. The resulted solution was transferred into a 100 mL Teflon-lined stainless autoclave and sealed tightly, which was kept at 473 K for 16 h. Then the autoclave was allowed to cool to room temperature naturally. The resulting products were filtered off, washed with absolute ethanol and distilled water for three times, and dried in vacuum at 333 K for 12 h to obtain the as-prepared MoS2. Then, some of the as-prepared MoS2 were calcined in a muffle furnace under an atmosphere of argon gas. The calcination temperatures were 573 K, 673 K and 773 K, respectively. The holding time is 4 h and the heating rate was 5 K min−1.
Characterization
The crystalline structure of samples was determined using X-ray diffraction (XRD MAC Science, MXP18, Japan). The morphology of the as-synthesized samples was characterized by field emission scanning electron microscopy (FESEM, JEOL JEM-2010HR) and transition electron microscope (TEM, JEOL JEM-2010HR). N2 adsorption isotherms were measured using an AUTOSORB-IQ (Quantachrome Instruments, USA). Raman spectra were measured on a Renishaw Raman confocal microscopy spectrometer (model 2000, Renishaw, London, UK). The X-ray photoelectron spectroscopy (XPS) was performed using an Al K monochromatized source (Thermo Fisher Scientific, Waltham, MA, USA) to acquire elemental information. The laser power was 40 mW, and the excitation wavelength was 514.5 nm. A tube furnace (OTF-1200X, Hefeikejing, Hefei, China) was used for the annealing. The heating rate was 5 K min−1.
Photocatalytic activity test
The photocatalytic performance of the MoS2 nanopetals was evaluated by the photocatalytic removal of RhB and DCHC aqueous solution. In the experiment, 50 mg of MoS2 nanopetals was dispersed in 50.0 mL of RhB and DCHC solution (10 mg L−1) in a 100 mL beaker, respectively. A 350 W Xe lamp equipped with a 420 nm cut-off filter was used as a light source, and there was a cooling device to eliminate thermal effect. The average light energy density was estimated to be 68 mW cm−2. The distance between the beaker containing the reaction mixture and the light source was fixed at 16 cm. First, the reaction mixture was mechanically stirred for 30 min in dark to ensure the adsorption/desorption equilibrium of the RhB and DCHC on the surface of the photocatalysts, respectively. The reaction solutions were sampled at 20 min illumination intervals, and the corresponding UV-vis spectra (measured in the range of 300–800 nm) were recorded to monitor the progress of the removal of RhB and DCHC by an UV-vis spectrophotometer. To investigate the recycle performance, the sintered samples were reused three times for the photocatalytic degradation of RhB and DCHC under the same condition.
Conclusions
The MoS2 nanopetals sintered at 573 K, 673 K and 773 K showed decreasing photocatalytic removal of RhB from 99% to 97% then 70% and removal of DCHC from 99% to 97% then 80%. Through analysing the XPS and Raman data, we found that it was the decreasing content of 1T-MoS2 from 12.19% to 9.70% then 3.7% which results in the decreasing of the active-sites and the adsorption ability dramatically.
Conflicts of interest
There are no conflicts to declare.
Acknowledgements
This research was funded by National Key Research and Development Program of China (Grant No. 2017YFF0108600, 2017YFF0108607), National Natural Science Foundation of China (Grant No. 61775081, 61475063, 61705079, 61605059, 61505067), Program for the development of Science and Technology of Jilin province (Item No. 20180519016JH, 20180520182JH, 20180414008GH), the Thirteenth Five-Year Program for Science and Technology of Education Department of Jilin Province (Item No. JJKH20180771KJ, JJKH20180780KJ) and the Graduate Innovation Research Fund at the Jilin Normal University (No. 201628).
References
- G. Zhang, H. Liu, J. Qua and J. Li, Energy Environ. Sci., 2016, 9, 1190–1209 RSC.
- Y. Okamoto, K. Tamura and T. Kubot, Chem. Commun., 2010, 46, 2748–2750 RSC.
- I. Nabouls, C. F. L. Aponte, B. Lebeau, S. Brunet, L. Michelin, M. Bonne and J. L. Blin, Chem. Commun., 2017, 53, 2717–2720 RSC.
- J. Y. Oh, J. H. Lee, S. W. Han, S. S. Chae, E. J. Bae, Y. H. Kang, W. J. Choi, S. Y. Cho, J.-O. Lee, H. K. Baik and T. I. Lee, Energy Environ. Sci., 2016, 9, 1696–1705 RSC.
- X. Huang, C. Tan, Z. Yin and H. Zhang, Adv. Mater., 2014, 26, 2185–2204 CrossRef CAS PubMed.
- J. H. Han, M. Kwak, Y. Kim and J. Cheon, Chem. Rev., 2018, 118, 6151–6188 CrossRef CAS PubMed.
- T. M. Gür, Energy Environ. Sci., 2018, 11, 2696–2767 RSC.
- L. Guo, Z. Yang, K. Marcus, B. L. Z. Li, L. Zhou, X. Wang, Y. Du and Y. Yang, Energy Environ. Sci., 2018, 11, 106–114 RSC.
- H. H. Shin, E. Kang, H. Park, T. Han, C.-H. Lee and D.-K. Lim, J. Mater. Chem. A, 2017, 5, 24965–24971 RSC.
- U. Maitra, U. Gupta, M. De, R. Datta, A. Govindaraj and C. N. R. Rao, Angew. Chem., Int. Ed., 2013, 52, 13057–13061 CrossRef CAS PubMed.
- U. K. Sen and S. Mitra, ACS Appl. Mater. Interfaces, 2013, 5, 1240–1247 CrossRef CAS PubMed.
- Y. Fang, J. Pan, J. He, R. Luo, D. Wang, X. Che, K. Bu, W. Zhao, P. Liu, G. Mu, H. Zhang, T. Lin and F. Huang, Angew. Chem., Int. Ed., 2017, 56, 1–5 CrossRef.
- S. Bai, L. Wang, X. Chen, J. Du and Y. Xiong, Nano Res., 2014, 8, 175–183 CrossRef.
- X. Yu, T. Shiraki, S. Yang, B. Ding and N. Nakashima, RSC Adv., 2015, 5, 86558–86563 RSC.
- S. S. Karade, D. P. Dubal and B. R. Sankapal, RSC Adv., 2016, 6, 39159–39165 RSC.
- W. Qiao, S. Yan, X. He, X. Song, Z. Li, X. Zhang, W. Zhong and Y. Du, RSC Adv., 2014, 4, 50981–50987 RSC.
- A. Chaudhari, T. Ghoshal, M. T. Shaw, J. O'Connell, R. A. Kelly, C. Glynn, C. O'Dwyer, J. D. Holmes and M. A. Morris, Adv. Mater. Interfaces, 2016, 6, 1500596 CrossRef.
- S. Han, C. Yuan, X. Luo, Y. Cao, T. Yu, Y. Yang, Q. Li and S. Ye, RSC Adv., 2015, 5, 68283–68286 RSC.
- W. Mengting, T. Yanase, F. Uehara, S. Watanabe, T. Miura, T. Nagahama and T. Shimada, CrystEngComm, 2017, 19, 3915–3920 RSC.
- S. Yu and W. Zheng, Phys. Chem. Chem. Phys., 2016, 18, 4675–4683 RSC.
- H. Zhu, M. Du, M. Zhang, M. Zou, T. Yang, Y. Fu and J. Yao, J. Mater. Chem. A, 2014, 2, 7680–7685 RSC.
- D. Lin, Y. Li, P. Zhang, W. Zhang, J. Ding, J. Li, G. Wei and Z. Su, RSC Adv., 2016, 6, 52739–52745 RSC.
- Q. Liu, Y. Tian and H. Ai, RSC Adv., 2016, 6, 20971–20978 RSC.
- Z. Zhang, Y. Zhu, H. Asakura, B. Zhang, J. Zhang, M. Zhou, Y. Han, T. Tanaka, A. Wang, T. Zhang and N. Yan, Nat. Commun., 2017, 8, 16100 CrossRef CAS PubMed.
- M. D. Donohue and G. L. Aranovich, Adv. Colloid Interface Sci., 1998, 76–77, 137–152 CrossRef CAS.
- M. Kruk and M. Jaroniec, Chem. Mater., 2001, 13, 3169–3183 CrossRef CAS.
- Y. Guo, D. Sun, B. Ouyang, A. Raja, J. Song, T. F. Heinz and L. E. Brus, Nano Lett., 2015, 15, 5081–5088 CrossRef CAS PubMed.
- X. Fan, P. Xu, D. Zhou, Y. Sun, Y. C. Li, M. A. T. Nguyen, M. Terrones and T. E. Mallouk, Nano Lett., 2015, 15, 5956–5960 CrossRef CAS PubMed.
- H. Fan, D. Chen, X. Ai, S. Han, M. Wei, L. Yang, H. Liua and J. Yang, RSC Adv., 2018, 8, 1398–1406 RSC.
- X. Zhang, R. Zhao, Q. Wu, W. Li, C. Shen, L. Ni, H. Yan, G. Diao and M. Chen, ACS Nano, 2017, 11, 8429–8436 CrossRef CAS PubMed.
- T. Xiong, M. Wen, F. Dong, J. Yu, L. Han, B. Lei, Y. Zhang, X. Tang and Z. Zang, Appl. Catal., B, 2016, 199, 87–95 CrossRef CAS.
Footnote |
| † Electronic supplementary information (ESI) available. See DOI: 10.1039/c8ra08027e |
|
| This journal is © The Royal Society of Chemistry 2018 |
Click here to see how this site uses Cookies. View our privacy policy here. 
 Open Access Article
 This Open Access Article is licensed under a Creative Commons Attribution-Non Commercial 3.0 Unported Licence
 *abc
*abc