 Open Access Article
The presence of a single-nucleotide mismatch in linker increases the fluorescence of guanine-enhanced DNA-templated Ag nanoclusters and their application for highly sensitive detection of cyanide†
Jun Pengab,
Jian Ling *a,
Qiu-Lin Wena,
Yu Lia,
Qiu-E. Cao*a,
Zhang-Jie Huang
 a and
Zhong-Tao Ding
 a
a
aFunctional Molecules Analysis and Biotransformation Key Laboratory of Universities in Yunnan Province, School of Chemical Science and Technology, Yunnan University, Kunming 650091, China. E-mail: lingjian@ynu.edu.cn; qecao@ynu.edu.cn
bHunan Province Geological Testing Institute, Changsha, 410007, China
First published on 12th December 2018
Abstract
Fluorescence of DNA-templated silver nanoclusters can be enhanced by more than 100-fold by placing the nanoclusters in proximity to guanine-rich DNA sequences after hybridization. We found that the fluorescence of the guanine-enhanced silver nanoclusters is not increased with the guanine-rich DNA sequence closer to the silver nanoclusters. By studying the different numbers of mismatches in the linker sequences, we found that the presence of a single-nucleotide mismatch in the linker increases fluorescence more than the complementary nucleotide. Further study indicated the mismatch position of the linker sequence also affects the fluorescence of the hybridized DNA-Ag NCs. The evidence reported here indicated that the mismatch of the linker sequence affects the fluorescence enhancement of guanine-enhanced silver nanoclusters. We also found that DNA-Ag NCs is an excellent fluorescence sensor for cyanide, as cyanide effectively quenches the fluorescence of NCs at a very low concentration with high selectivity. Cyanide in the range from 0.10 μM to 0.35 μM could be linearly detected, with a detection limit of 25.6 nM.
Introduction
Fluorescence DNA-templated silver nanoclusters (DNA-Ag NCs) have been considered a great alternative to the former standard fluorophores and newly developed fluorescent quantum dots due to their advantages of brighter and more stable fluorescence, lower toxicity, and less tendency to blinking.1–4 After report of the first DNA-templated silver nanoclusters in early 2004 by Dickson and co-workers,1 many studies concerning the synthesis and application of DNA-Ag NCs have been published in the past ten years.5–8 As the scaffold for preparing metal NCs, the bases, sequence, and length of DNA determine the fluorescence property of DNA-Ag NCs.9 Various DNA oligonucleotides have been widely studied for the preparation of different kinds of Ag NCs with fluorescence emission from the ultraviolet (UV) to near-infrared (NIR) regions.9–11 Varied applications of fluorescent DNA-Ag NCs probes have been found in screening the DNA/RNA sequence and nucleotide variation;12–19 sensing proteins;20,21 small organic molecules22,23 and metal ions;24–27 and imaging targets in cells.28,29The fluorescent properties of DNA-stabilized Ag NCs are influenced by not only the DNA sequence but also the hybridization behavior and surrounding environment.30–35 Amplification of the fluorescence of DNA-Ag NCs by placing the Ag NCs in proximity to guanine-rich DNA sequences is a case in point.36 This DNA-Ag NCs probe is double-stranded DNA composed of two strands of DNA with different functions. One strand contained a special C-rich sequence required to prepare the fluorescent DNA-Ag NCs and the other contained the G-rich sequence that could amplify the fluorescence of DNA-Ag NCs when they are brought close by hybridization sequence. With this strategy, the fluorescence of DNA-Ag NCs can be enhanced up to 500-fold. Based on this new phenomenon, new bio-sensing modalities such as DNA molecule beacons can be achieved by rationally designing DNA sequences combining molecular recognition, G-rich enhanced sequence, and NC-templating sequence.
The DNA-Ag NCs probe based on poly-G enhancement was named Nano-Cluster Beacon (NCB) and has been successfully used for screening single-nucleotide polymorphisms,37 identifying a single N6-methyladenine,38 bio-sensing thrombin and adenosine,39–42 and cellular imaging.43 To successfully construct an NCB based on a G-rich enhanced sequence, many factors that may affect the fluorescence enhancement of the NCs should be taken into consideration, for example, the number of guanines in proximity, the variation of guanine content, the sequence content, length for hybridization, and so on. In any circumstance, the poly-guanine must be close to the NCs to trigger the fluorescence enhancement of NCs. Normally, the hybridization sequences should be designed as two complementary sequences as a “linker” to ensure the proximity of poly-guanine to NCs. However, in this study, we found that a single-nucleotide mismatched “linker” increases fluorescence more than a complementary one. We further studied the effects of mismatched nucleotide quantity and mismatch position of the linker sequence on the fluorescence enhancement of two different NCs and ensured that the phenomenon is reproducible.
Moreover, as DNA-Ag NCs have found fewer applications in anion sensing, we studied the fluorescence response of DNA-Ag NCs to common anions and identified analytical applications. The results indicated that cyanide, a most concerning poisonous anion, could effectively quench the fluorescence of NCs. Currently, there are many sensing methods for fast, accurate detection of cyanide at regulated concentrations, such as chromatographic,44 electrochemical,45 colorimetric,46–48 and fluorescence49–60 methods. In this paper, single-nucleotide mismatched guanine-rich DNA-Ag NCs with brighter fluorescence were successfully used to detect cyanide for the first time. Results indicated the fluorescence quenching method is highly selective and reliable for cyanide sensing.
Experimental section
Chemicals and instruments
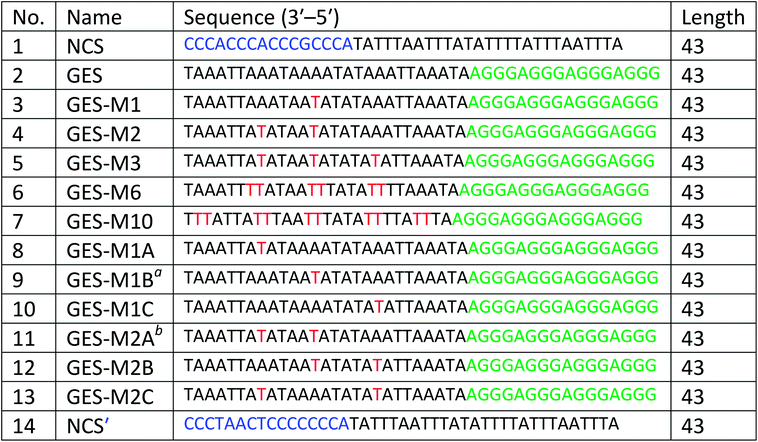
Silver nitrate (AgNO3, 99.9999%) was purchased from Alfa Aesar (USA). Sodium borohydride (NaBH4, 96%) was purchased from Sinopharm Chemical Reagent Co., Ltd (Shanghai, China). Potassium cyanide (KCN, 99.999%. Caution! Cyanide is highly toxic. Please handle with extreme care.) was supplied by Yunnan Gold Mining Group Co., Ltd (Kunming, China). All oligonucleotides used for the synthesis of silver nanoclusters were purchased from Shanghai Sangon Biotechnology Co., Ltd (Shanghai, China). The abbreviation names and sequences of the oligonucleotides are listed in Table 1. Phosphate buffer (PB, 20 mM, pH 7.0) was used for the synthesis of silver nanoclusters and detection of cyanide. Phosphate buffer saline (PBS, 20 mM, pH 7.4), prepared by dissolving 0.296 g NaH2PO4·2H2O, 2.90 g Na2HPO4·12H2O, 8.0 g NaCl, and 1.0 g KCl in one liter of ultra-pure water (18.2 MΩ), was used as the buffer for DNA hybridization. Anions used for selectivity studies, such as sulfate, chloride, and phosphate, were the sodium or potassium salts, which were of analytical reagent grade and were used without further purification. Ultrapure water (18.25 MΩ) was used throughout the experiment.Fluorescence and absorption spectra of silver nanoclusters were measured with an F-7000 spectrophotometer (Hitachi, Japan) and UV-2550 spectrophotometer (Shimadzu, Japan), respectively. The photos of DNA-Ag NCs were captured using a D7000 single-lens reflex digital camera (Nikon, Japan) under daylight or ultraviolet light. The fluorescence lifetime of DNA-Ag NCs was measured using a Fluorolog®-3 fluorescence spectrophotometer (Horiba Jobin Yvon Inc., France). Circular dichroism spectra of DNA-Ag NCs were measured by a Chirascan™ circular dichroism spectrometer (Applied Photophysics Ltd., UK). A QL-901 vortex mixer (Kylin-Bell Lab Instruments Co., Ltd, Haimen, China) was used for blending the solutions. The pH values of buffer were measured by a Leici PH-3C digital pH meter (Shanghai instrument electric science Co., Ltd, Shanghai, China).
Synthesis of DNA-Ag NCs
For the preparation of DNA-Ag NCs, 50 μM of DNA (details in Table 1) dissolved in 20 mM phosphate buffer (pH 7.0) was first prepared. Then, 1.0 mM of AgNO3 solution was mixed with the DNA solution with Ag+-to-DNA molar ratio of 16![[thin space (1/6-em)]](https://www.rsc.org/images/entities/char_2009.gif) :
:![[thin space (1/6-em)]](https://www.rsc.org/images/entities/char_2009.gif) 1. After 15–20 min, this mixture was reduced by quickly adding 40 μL NaBH4 (1 mM) under vigorous shaking. For the growth of DNA-Ag NCs, the reduced DNA/Ag solution was incubated at room temperature in the dark for 18 h. The fluorescence spectra of the as-prepared DNA-Ag NCs were recorded using a fluorescence spectrometer. For simplicity, the concentration of the as-prepared DNA-Ag NCs was calculated using DNA.
1. After 15–20 min, this mixture was reduced by quickly adding 40 μL NaBH4 (1 mM) under vigorous shaking. For the growth of DNA-Ag NCs, the reduced DNA/Ag solution was incubated at room temperature in the dark for 18 h. The fluorescence spectra of the as-prepared DNA-Ag NCs were recorded using a fluorescence spectrometer. For simplicity, the concentration of the as-prepared DNA-Ag NCs was calculated using DNA.
Fluorescence enhancement of DNA-Ag NCs by a guanine-rich DNA strand
For the fluorescence enhancement of the as-prepared DNA-Ag NCs, a guanine-rich DNA (details in Table 1) solution was prepared and mixed with the as-prepared DNA-Ag NCs solution at a molar ratio of 1![[thin space (1/6-em)]](https://www.rsc.org/images/entities/char_2009.gif) :
:![[thin space (1/6-em)]](https://www.rsc.org/images/entities/char_2009.gif) 1. The mixture was diluted to 380 μL by 20 mM phosphate buffer saline (PBS, pH 7.0) solution. After hybridization for 1.5 h at room temperature, the fluorescence-enhanced hybridized double-strand DNA-Ag NCs were used for further fluorescence studies.
1. The mixture was diluted to 380 μL by 20 mM phosphate buffer saline (PBS, pH 7.0) solution. After hybridization for 1.5 h at room temperature, the fluorescence-enhanced hybridized double-strand DNA-Ag NCs were used for further fluorescence studies.
General procedure for cyanide detection using DNA-Ag NCs
First, 24.60 μM of potassium cyanide (KCN) stock solution was prepared and diluted to aliquots with different concentrations. The hybridized double-strand DNA-Ag NCs were added to the aliquots of cyanide solution and further, diluted to a final volume of 1.0 mL with PB. The mixture was left at room temperature for 1 hour before transfer for the fluorescence measurement. The fluorescence spectrum of the DNA-Ag NCs was obtained by exciting at 480 nm and the fluorescence intensity for data analysis was taken at the maximum emission wavelength of 560 nm.Results and discussion
Fluorescence of DNA-Ag NCs after guanine-rich enhancement
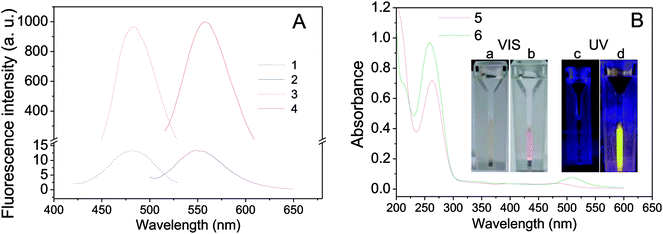
Two oligonucleotides strands, one for NCs-bearing (called nanoclusters strand, NCS) containing an NC-nucleation sequence (Table 1, NCS, blue color) and another for guanine-enhancement (called G-enhancer strand, GES) containing a guanine-rich sequence (Table 1, GES, green color), were designed. There is a linker sequence (Table 1, black color) in both NC and GES strands that brings the G-rich overhang close to Ag NCs after hybridization. The NC-nucleation sequence was selected according to Petty et al.,61,62 and the experimental conditions for preparation of DNA-Ag NCs were similar to our previous report.26 As shown in Fig. 1A (blue curves), the as-prepared DNA-Ag NCs have a fluorescence maximum emission peak at 550 nm under 480 nm excitation. The fluorescence property is different to literature reports that Ag NCs stabilized in the C3AC3AC3GC3A sequence show near-infrared emitting property.62–64 The result indicated that addition of the TnAn tail on C3AC3AC3GC3A sequence intensely affected the fluorescence property of DNA-Ag NCs.After hybridization with the GES, fluorescence of the hybridized DNA-Ag NCs increased more than 200-fold and the emission peak was slightly red-shifted to 558 nm (Fig. 1A, red curves). We also compared UV-vis absorption spectra and photos before and after hybridization. As shown in Fig. 1B, a clear peak appeared near 510 nm after hybridization and the color of the solution changed from colorless to pink (Fig. 1B(a and b)). A bright yellow fluorescence could be observed under 365 nm UV light (Fig. 1B(d)). The results indicated that the fluorescence enhancement of DNA-Ag NCs by G-rich sequence was successfully achieved.
Effects of guanine proximity on the fluorescence of DNA-Ag NCs
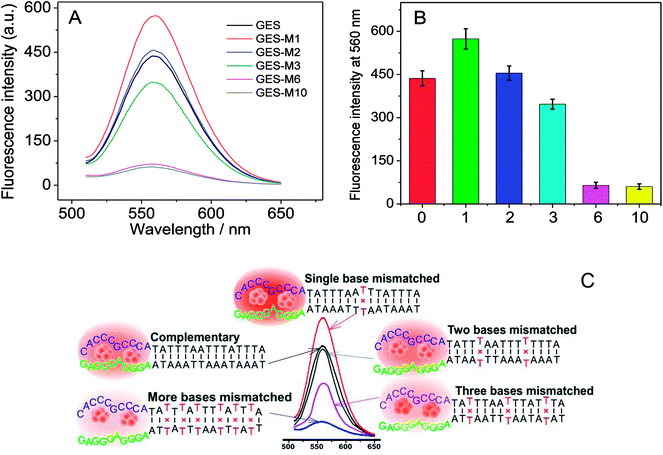
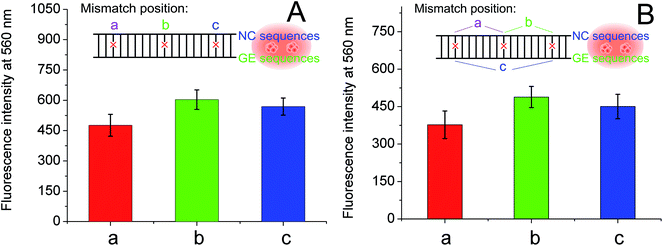
To further investigate the effect of guanine proximity on the fluorescence of DNA-Ag NCs, a series of G-rich enhancement strands with linker sequence not complementary to NC strand were designed. As shown in Table 1, single-nucleotide mismatched (named GES-M1), two-nucleotides mismatched (named GES-M2), three-nucleotides mismatched (named GES-M3), six-nucleotides mismatched (named GES-M6), and ten-nucleotides mismatched (named GES-M10) were used to enhance the fluorescence of Ag NCs. In general, to bring the G-rich sequence closer to Ag NCs, the GES which has a complementary linker sequence to that of NCS should have the highest fluorescence enhancement after hybridization. However, the results shown in Fig. 2A indicated that GES-M1 had the highest fluorescence intensity. GES has comparable fluorescence enhancement to GES-M2, but less than 80% of the enhancement of GES-M1. If the number of mismatched nucleotides is larger than 3 (GES-M3, GES-M6, GES-M10), the G-enhanced phenomenon is ignorable. After repeated experiments, the relationship between the fluorescence enhancement intensity and number of mismatches is shown in Fig. 2B and C.As the single- and two-nucleotide mismatched G-rich strands had unexpected fluorescence enhancement in DNA-Ag NCs, single- and two-nucleotide mismatched G-rich strands with different mismatching positions were designed to confirm the reliability and reproducibility of the fluorescence enhancement phenomenon. As shown in Table 1, single- and two-nucleotide mismatched G-rich strands with mismatch positions from the tail to the midpoint of the strand were designed and named GES-M1A, GES-M1B, GES-M1C, GES-M2A, GES-M2B, and GES-M2C. As expected, the phenomenon was repeatedly observed using strands with the same mismatching nucleotide at different mismatch positions. Interestingly, we found another new trend: the strands with mismatch position at the middle of the strand (position “b”) had greater fluorescence enhancement than those with mismatch position close to (position “c”) or far away from (position “a”) the G-rich sequence. A similar phenomenon can also be seen in two-nucleotides mismatched strands (Fig. 3B).
To test if the fluorescence enhancement phenomenon is specific to the NC-nucleation sequence or if it can also be found in a different NC-bearing strand, we designed another NC-bearing strand (Table 1, no. 14, named NCS′) for G-rich fluorescence enhancement. The NC-nucleation sequence was adapted from literature65 with slight modification to fit the GES fluorescence enhancement. The as-prepared DNA-Ag NCs have a fluorescence maximum emission peak at 540 nm under 480 nm excitation, which is slightly different than the previous one (see ESI, Fig. S1A†). After hybridization with the GES, similar fluorescence enhancement was observed (Fig. S1B†).
The difference in fluorescence enhancement when using complementary, single-nucleotide mismatched, and two-nucleotides-mismatched G-enhancement sequences was studied using the same procedure. As shown in Fig. S2,† a similar phenomenon occurred, where the single-nucleotide mismatched G-rich strand enhanced the highest fluorescence of nanoclusters prepared in NCS′. The fluorescence enhancements in NCS and NCS′ strands also had slight differences. First, the two-nucleotides-mismatched G-rich strand has better fluorescence enhancement than the complementary strand (Fig. S2B†). Second, for DNA-Ag NCs prepared in NCS′, mismatch position of the nucleotide in G-rich strand had a significant effect comparable to that of mismatch number of the nucleotide. As shown in Fig. S3,† at position “a”, there is only half the fluorescence enhancement from a mismatch at position “b”.
Overall, as the hybridization extent of the linker depends on the distance between the G-rich sequence and the Ag NCs core, the effect of G-rich sequence proximity on the fluorescence enhancement of DNA-Ag NCs requires more study. We do not know the definite cause of the phenomenon, however, we believe that our finding is an essential reference for designing an NCB based on G-rich fluorescence enhancement.
Fluorescence quenching of DNA-Ag NCs in the presence of cyanide
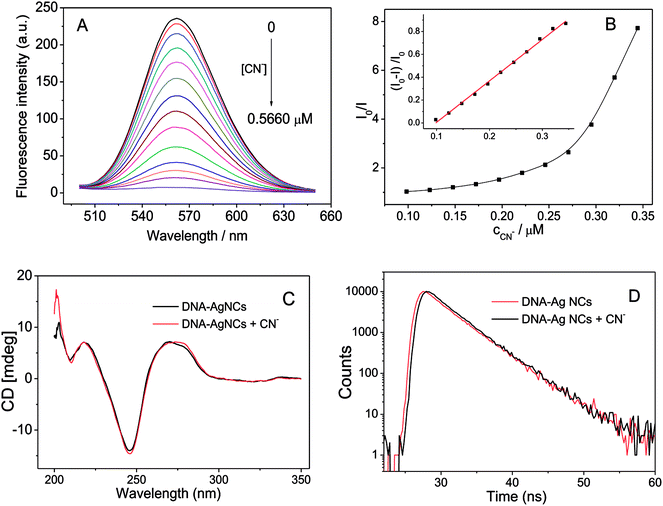
Besides studying the effect of linker sequence on the fluorescence of G-enhanced DNA-Ag NCs, we also attempted to find some analytical applications for the DNA-Ag NCs. Cyanide is a very important ligand for many transition metals. The high affinity of cyanide for metal ions can be attributed to its negative charge and ability to engage in π-bonding. The presence of cyanide in DNA-Ag NCs would greatly affect the fluorescence of the Ag NCs. As shown in Fig. 4A and B, the fluorescence emission of the DNA-Ag NCs started to quench when 0.1 μM of cyanide was added. The fluorescence was quenched up to 99% in the presence of 0.5 μM of cyanide.The possible mechanism of the fluorescence quenching was explored by circular dichroism (CD), UV-vis absorption spectroscopy, and fluorescence lifetime spectroscopy. First, the fluorescence of DNA-Ag NCs was enhanced 200-fold by hybridizing the G-rich sequence and release of the G-rich sequence resulted in the decrease in fluorescence. The circular dichroism (CD) spectra of the DNA-Ag NCs before and after reaction with cyanide (Fig. 4C) indicated that G-rich strand and DNA-Ag NCs were still hybridized. Second, the UV-vis absorption spectrum of KCN had no overlap with the fluorescence excitation or emission band (around 450–600 nm, Fig. 1A) of DNA-Ag NCs; thus, there is no fluorescence resonance energy transfer (FRET) or inner filter effect (IFE) between KCN and DNA-Ag NCs. Then, we compared the fluorescence decay time of DNA-Ag NCs after adding cyanide. As shown in Fig. 4D, there was no obvious change in the fluorescence lifetime of DNA-Ag NCs after the addition of cyanide; thus, the quenching of fluorescence of DNA-Ag NCs was a static fluorescence quenching caused by the interaction of cyanide. We studied the Stern–Volmer plot, which shows the relationship between the ratio of fluorescence intensity before and after reaction with cyanide (I0/I) and the concentration of cyanide (cCN). The Stern–Volmer plot (Fig. 4B) showed not a linear but an upward curvature. One possible reason is that DNA-Ag NCs is a biomolecule-stabilized fluorescence probe: one mole of DNA-Ag NCs would combine with n moles of cyanide. Another possible reason is that the quenching mechanism is not only static quenching but also contains other mechanisms in the fluorescence quenching process.
Detection of cyanide using DNA-Ag NCs
As the fluorescence intensity of the DNA-Ag NCs at 560 nm gradually reduced with the increase in cyanide concentration, we found that there was a good relationship between fluorescence quenching ratio [(I0 − I)/I0] of DNA-Ag NCs and the concentration of cyanide in a range from 0.10 μM to 0.35 μM. The linear regression equation can be expressed as (I0 − I)/I0 = −0.356 + 3.62c for cyanide (c, μM) with correlation coefficients (R2) of 0.9916 and detection limit of 25.6 nM (3σ). We also compared the published papers for cyanide detection using fluorescent nanocluster probes. As shown in Table 2, the guanine-enhanced DNA-Ag NCs probe had the lowest detection limit for the determination of cyanide.| Probes | Linear range (μM) | LOD (nM) | References |
|---|---|---|---|
| BSA-stabilized Au NCs | 0.20–9.6 | 200 | 48 |
| Lysozyme-stabilized gold NCs | 5.0–120.0 | 190 | 52 |
| L-Amino acid oxidase-Au NCs | 2.3–34.0 | 180 | 53 |
| BSA stabilized Ce/Au NCs | 0.1–15 | 50 | 54 |
| Cu phthalocyanine and GSH-Au NCs | 0.10–220 | 75 | 55 |
| Egg white stabilized Au/Ag NCs | 0.5–50 | 138 | 58 |
| Guanine-enhanced DNA-Ag NCs | 0.10–0.35 | 25.6 | This work |
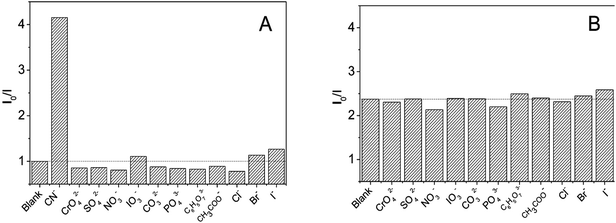
The selectivity of DNA-Ag NCs for common anions was studied to estimate possible application of DNA-Ag NCs in cyanide detection. As shown in Fig. 5A, common anions such as halide, sulfate, and phosphate ions, with concentration 100-fold greater than cyanide could not quench the fluorescence of the Ag-NCs. We also studied the interference of other anions for cyanide detection. The results shown in Fig. 5B indicated an ignorable interference such that the presence of other anions with concentrations 50 times higher than cyanide would not affect the fluorescence quenching of cyanide.
To evaluate the reliability of the proposed method for the detection of cyanide in natural waters, we analyzed three water samples from a local river in a different area by the standard addition method. The quantification results shown in ESI Table S1† indicated that our method has a detection recovery from 93.7% to 108.4% and relative standard deviation (RSD) less than 12.7%. The results indicated that the fluorescence quenching method for cyanide sensing by DNA-Ag NCs could be used in environmental monitoring or metallurgical industry.
Conclusion
In this study, we found that the fluorescence of guanine-enhanced silver nanoclusters does not increase with the guanine-rich DNA sequence closer to the silver nanoclusters. The presence of a single-nucleotide mismatch in the linker increased fluorescence more than the complementary sequence. If the number of mismatches is larger than 3, the fluorescence enhancement of the G-rich sequence is ignorable. The mismatch position on the linker also affected the fluorescence of Ag NCs. A mismatch position far from the G-rich sequence is not suitable for fluorescence enhancement. The evidence proposed here indicated the hybridization extent of the linker effects the G-rich sequence proximity on the fluorescence enhancement of DNA-Ag NCs and our finding is an essential reference for designing an NCB based on G-rich fluorescence enhancement. The as-prepared single mismatched DNA-Ag NCs also found an application for cyanide sensing at a very low concentration with high selectivity. Cyanide in the range from 0.10 μM to 0.35 μM could be linearly detected with a detection limit of 25.6 nM. Therefore, we believe that more undiscovered properties and applications of single or double stranded DNA-stabilized Ag NCs will be found in future research and DNA-Ag NCs have an excellent potential as fluorescence probe for sensing in many scientific research fields.Conflicts of interest
There are no conflicts to declare.Acknowledgements
This work was financially supported by the National Natural Science Foundation of China (No. 21565030, 21465025) and Cultivation Program for Key Young Teachers of Yunnan University.References
- J. T. Petty, J. Zheng, N. V. Hud and R. M. Dickson, J. Am. Chem. Soc., 2004, 126, 5207–5212 CrossRef CAS.
- C. M. Ritchie, K. R. Johnsen, J. R. Kiser, Y. Antoku, R. M. Dickson and J. T. Petty, J. Phys. Chem. C, 2007, 111, 175–181 CrossRef CAS PubMed.
- J. T. Petty, S. P. Story, J.-C. Hsiang and R. M. Dickson, J. Phys. Chem. Lett., 2013, 4, 1148–1155 CrossRef CAS PubMed.
- Z. Yuan, Y.-C. Chen, H.-W. Li and H.-T. Chang, Chem. Commun., 2014, 50, 9800–9815 RSC.
- S. Y. New, S. T. Lee and X. D. Su, Nanoscale, 2016, 8, 17729–17746 RSC.
- J. Li, J.-J. Zhu and K. Xu, TrAC, Trends Anal. Chem., 2014, 58, 90–98 CrossRef CAS.
- J. Liu, TrAC, Trends Anal. Chem., 2014, 58, 99–111 CrossRef CAS.
- S. Choi, R. M. Dickson and J. Yu, Chem. Soc. Rev., 2012, 41, 1867–1891 RSC.
- J. M. Obliosca, M. C. Babin, C. Liu, Y.-L. Liu, Y.-A. Chen, R. A. Batson, M. Ganguly, J. T. Petty and H.-C. Yeh, ACS Nano, 2014, 8, 10150–10160 CrossRef CAS.
- I. L. Volkov, R. R. Ramazanov, E. V. Ubyivovk, V. I. Rolich, A. I. Kononov and N. A. Kasyanenko, ChemPhysChem, 2013, 14, 3543–3550 CrossRef CAS.
- J.-L. Ma, B.-C. Yin and B.-C. Ye, RSC Adv., 2015, 5, 98467–98471 RSC.
- H.-Z. He, D. S.-H. Chan, C.-H. Leung and D.-L. Ma, Chem. Commun., 2012, 48, 9462–9464 RSC.
- P. Shah, A. Rørvig-Lund, S. B. Chaabane, P. W. Thulstrup, H. G. Kjaergaard, E. Fron, J. Hofkens, S. W. Yang and T. Vosch, ACS Nano, 2012, 6, 8803–8814 CrossRef CAS PubMed.
- J. M. Obliosca, C. Liu and H.-C. Yeh, Nanoscale, 2013, 5, 8443–8461 RSC.
- J. Park, J. Lee, C. Ban and W. J. Kim, Biosens. Bioelectron., 2013, 43, 419–424 CrossRef CAS.
- J. Peng, Y. Shao, L. Liu, L. Zhang, H. Liu and Y. Wang, Anal. Chim. Acta, 2014, 850, 78–84 CrossRef CAS.
- X. Tian, X.-J. Kong, Z.-M. Zhu, T.-T. Chen and X. Chu, Talanta, 2015, 131, 116–120 CrossRef CAS.
- L. Qi, Y. Huo, H. Wang, J. Zhang, F.-Q. Dang and Z.-Q. Zhang, Anal. Chem., 2015, 87, 11078–11083 CrossRef CAS PubMed.
- Y.-D. Ye, L. Xia, D.-D. Xu, X.-J. Xing, D.-W. Pang and H.-W. Tang, Biosens. Bioelectron., 2016, 85, 837–843 CrossRef CAS PubMed.
- J. Sharma, H.-C. Yeh, H. Yoo, J. H. Werner and J. S. Martinez, Chem. Commun., 2011, 47, 2294–2296 RSC.
- Q. Wen, Y. Gu, L.-J. Tang, R.-Q. Yu and J.-H. Jiang, Anal. Chem., 2013, 85, 11681–11685 CrossRef CAS PubMed.
- L. Zhang, R.-P. Liang, S.-J. Xiao, J.-M. Bai, L.-L. Zheng, L. Zhan, X.-J. Zhao, J.-D. Qiu and C.-Z. Huang, Talanta, 2014, 118, 339–347 CrossRef CAS PubMed.
- N. Enkin, E. Sharon, E. Golub and I. Willner, Nano Lett., 2014, 14, 4918–4922 CrossRef CAS.
- L. Deng, Z. Zhou, J. Li, T. Li and S. Dong, Chem. Commun., 2011, 47, 11065–11067 RSC.
- J. Yin, X. He, X. Jia, K. Wang and F. Xu, Analyst, 2013, 138, 2350–2356 RSC.
- J. Peng, J. Ling, X.-Q. Zhang, H.-P. Bai, L. Zheng, Q.-E. Cao and Z.-T. Ding, Spectrochim. Acta, Part A, 2015, 137, 1250–1257 CrossRef CAS PubMed.
- J.-L. Ma, B.-C. Yin and B.-C. Ye, Analyst, 2016, 141, 1301–1306 RSC.
- J. Yin, X. He, K. Wang, Z. Qing, X. Wu, H. Shi and X. Yang, Nanoscale, 2012, 4, 110–112 RSC.
- J. Zhu, L. Zhang, Y. Teng, B. Lou, X. Jia, X. Gu and E. Wang, Nanoscale, 2015, 7, 13224–13229 RSC.
- J. T. Petty, O. O. Sergev, A. G. Kantor, I. J. Rankine, M. Ganguly, F. D. David, S. K. Wheeler and J. F. Wheeler, Anal. Chem., 2015, 87, 5302–5309 CrossRef CAS.
- M. Ganguly, C. Bradsher, P. Goodwin and J. T. Petty, J. Phys. Chem. C, 2015, 119, 27829–27837 CrossRef CAS PubMed.
- J. T. Petty, D. A. Nicholson, O. O. Sergev and S. K. Graham, Anal. Chem., 2014, 86, 9220–9228 CrossRef CAS PubMed.
- W. Guo, J. Yuan and E. Wang, Chem. Commun., 2011, 47, 10930–10932 RSC.
- W. Guo, J. Yuan, Q. Dong and E. Wang, J. Am. Chem. Soc., 2009, 132, 932–934 CrossRef PubMed.
- S. Chakraborty, S. Babanova, R. C. Rocha, A. Desireddy, K. Artyushkova, A. E. Boncella, P. Atanassov and J. S. Martinez, J. Am. Chem. Soc., 2015, 137, 11678–11687 CrossRef CAS PubMed.
- H.-C. Yeh, J. Sharma, J. J. Han, J. S. Martinez and J. H. Werner, Nano Lett., 2010, 10, 3106–3110 CrossRef CAS PubMed.
- H.-C. Yeh, J. Sharma, I.-M. Shih, D. M. Vu, J. S. Martinez and J. H. Werner, J. Am. Chem. Soc., 2012, 134, 11550–11558 CrossRef CAS PubMed.
- Y.-A. Chen, J. M. Obliosca, Y.-L. Liu, C. Liu, M. L. Gwozdz and H.-C. Yeh, J. Am. Chem. Soc., 2015, 137, 10476–10479 CrossRef CAS PubMed.
- J. Li, X. Zhong, H. Zhang, X. C. Le and J.-J. Zhu, Anal. Chem., 2012, 84, 5170–5174 CrossRef CAS PubMed.
- M. Zhang, S.-M. Guo, Y.-R. Li, P. Zuo and B.-C. Ye, Chem. Commun., 2012, 48, 5488–5490 RSC.
- L. Zhang, J. Zhu, Z. Zhou, S. Guo, J. Li, S. Dong and E. Wang, Chem. Sci., 2013, 4, 4004–4010 RSC.
- W. Sylwia, M. Kiyoshi, A. Moin and L. Juewen, Nanotechnology, 2014, 25, 155501 CrossRef PubMed.
- J. Yin, X. He, K. Wang, F. Xu, J. Shangguan, D. He and H. Shi, Anal. Chem., 2013, 85, 12011–12019 CrossRef CAS PubMed.
- A. Ishii, H. Seno, K. Watanabe-Suzuki, O. Suzuki and T. Kumazawa, Anal. Chem., 1998, 70, 4873–4876 CrossRef CAS PubMed.
- Y. G. Timofeyenko, J. J. Rosentreter and S. Mayo, Anal. Chem., 2007, 79, 251–255 CrossRef CAS PubMed.
- W. C. Blackledge, C. W. Blackledge, A. Griesel, S. B. Mahon, M. Brenner, R. B. Pilz and G. R. Boss, Anal. Chem., 2010, 82, 4216–4221 CrossRef CAS PubMed.
- C. Zong, L. R. Zheng, W. He, X. Ren, C. Jiang and L. Lu, Anal. Chem., 2014, 86, 1687–1692 CrossRef CAS PubMed.
- M. M. Rhaman, A. Alamgir, B. M. Wong, D. R. Powell and M. A. Hossain, RSC Adv., 2014, 4, 54263–54267 RSC.
- Y. L. Liu, K. L. Ai, X. L. Cheng, L. H. Huo and L. H. Lu, Adv. Funct. Mater., 2010, 20, 951–956 CrossRef CAS.
- X. Huang, X. Gu, G. Zhang and D. Zhang, Chem. Commun., 2012, 48, 12195–12197 RSC.
- S.-C. Wei, P.-H. Hsu, Y.-F. Lee, Y.-W. Lin and C.-C. Huang, ACS Appl. Mater. Interfaces, 2012, 4, 2652–2658 CrossRef CAS PubMed.
- D. Lu, L. Liu, F. Li, S. Shuang, Y. Li, M. M. F. Choi and C. Dong, Spectrochim. Acta, Part A, 2014, 121, 77–80 CrossRef CAS PubMed.
- G. Zhang, Y. Qiao, T. Xu, C. Zhang, Y. Zhang, L. Shi, S. Shuang and C. Dong, Nanoscale, 2015, 7, 12666–12672 RSC.
- C.-W. Wang, Y.-N. Chen, B.-Y. Wu, C.-K. Lee, Y.-C. Chen, Y.-H. Huang and H.-T. Chang, Anal. Bioanal. Chem., 2016, 408, 287–294 CrossRef CAS PubMed.
- Z. Shojaeifard, B. Hemmateenejad and M. Shamsipur, ACS Appl. Mater. Interfaces, 2016, 8, 15177–15186 CrossRef CAS PubMed.
- S. Momeni, R. Ahmadi, A. Safavi and I. Nabipour, Talanta, 2017, 175, 514–521 CrossRef CAS PubMed.
- Y. Shiraishi, N. Hayashi, M. Nakahata, S. Sakai and T. Hirai, RSC Adv., 2017, 7, 32304–32309 RSC.
- L. Tian, Y. Li, T. Ren, Y. Tong, B. Yang and Y. Li, Talanta, 2017, 170, 530–539 CrossRef CAS PubMed.
- Q. Niu, L. Lan, T. Li, Z. Guo, T. Jiang, Z. Zhao, Z. Feng and J. Xi, Sens. Actuators, B, 2018, 276, 13–22 CrossRef CAS.
- P. Llano-Suárez, D. Bouzas-Ramos, J. M. Costa-Fernández, A. Soldado and M. T. Fernández-Argüelles, Talanta, 2019, 192, 463–470 CrossRef PubMed.
- J. T. Petty, B. Sengupta, S. P. Story and N. N. Degtyareva, Anal. Chem., 2011, 83, 5957–5964 CrossRef CAS PubMed.
- J. T. Petty, C. Fan, S. P. Story, B. Sengupta, M. Sartin, J.-C. Hsiang, J. W. Perry and R. M. Dickson, J. Phys. Chem. B, 2011, 115, 7996–8003 CrossRef CAS PubMed.
- J. T. Petty, S. P. Story, S. Juarez, S. S. Votto, A. G. Herbst, N. N. Degtyareva and B. Sengupta, Anal. Chem., 2012, 84, 356–364 CrossRef CAS PubMed.
- J. T. Petty, C. Fan, S. P. Story, B. Sengupta, A. St. John Iyer, Z. Prudowsky and R. M. Dickson, J. Phys. Chem. Lett., 2010, 1, 2524–2529 CrossRef CAS PubMed.
- C. I. Richards, S. Choi, J.-C. Hsiang, Y. Antoku, T. Vosch, A. Bongiorno, Y.-L. Tzeng and R. M. Dickson, J. Am. Chem. Soc., 2008, 130, 5038–5039 CrossRef CAS PubMed.
Footnote |
| † Electronic supplementary information (ESI) available. See DOI: 10.1039/c8ra07986b |
| This journal is © The Royal Society of Chemistry 2018 |

