DOI:
10.1039/C8RA07912A
(Paper)
RSC Adv., 2018,
8, 40395-40406
Effects of acylation and glycation treatments on physicochemical and gelation properties of rapeseed protein isolate†
Received
23rd September 2018
, Accepted 20th November 2018
First published on 4th December 2018
Abstract
The aim of this study was to improve the gelation property of rapeseed protein isolates (RPI) by means of acylation and glycation. The results showed that acylation and glycation within RPI occurred at Lys, and Lys, Met, Ile, Leu and Pro, respectively. Acylation and glycation both increased the surface hydrophobicity (So) and molecular weight of RPI, and decreased the free sulfhydryl (SH) content of RPI, while acylation resulted in a lower change of So and SH. The conformational structure of modified RPIs was changed, and acylated RPI (acylation degree, 38 ± 0.2%) possessed the highest ordered structure content among the modified RPIs. The thermal stability of the protein was improved after either acylation or glycation treatments. Furthermore, native RPI with moderate modification (low degree of acylation, 38 ± 0.2%) showed an overall improvement in the gelation and gel properties as evidenced by the reduced least gelation concentration and surface roughness, increased water-holding capacity, and better textural properties.
1. Introduction
The cultivation of rapeseed is performed all over China. The major global demand for rapeseed is for edible oils. However, once the oil is removed from the seeds, rapeseed meal remains. Rapeseed meal has been recognized as a rich potential alternative source of plant protein containing up to 50% protein on a dry weight basis. Rapeseed protein isolate (RPI) is usually produced from rapeseed meal and considered a suitable source of dietary protein for human consumption due to the high bioavailability and excellent balance of its essential amino acid composition.1 However, its use in food industry is limited mainly due to its inferior functionality compared to other commercially available protein isolates.2 Although it has been reported that the RPI had some favorable functional properties, including good water/oil absorption, as well as foaming and emulsification abilities,3,4 it was found that the gelation characteristics of RPI was poorer than that of other proteins, such as soy protein, which severely affected its applications as an ingredient in the food industry.3,5
Chemical modification of proteins has the advantages of high efficiency and strong controllability, which improves the function and physicochemical properties of proteins. For industrialization, chemical modification is easier to implement in large scale production than physical and enzymatic modifications.6 Acylation has been widely used in food processing as one of chemical modification methods of proteins. Currently, succinic anhydride is more commonly used as a safe food acylating agents.7 The nature of the acylation reaction is the nucleophilic substitution reaction between the acylating agent and the free amino or hydroxyl group in the protein molecule, resulting in changes in the functional properties of proteins.8 It was reported that gelation, emulsifying properties, and water solubility of oat protein could be improved by acylation process when compared to native protein.9,10
The glycation of the protein with reducing sugar by means of Maillard reaction has been shown to be a promising approach, which could improve the functional properties of proteins, such as emulsifying and gelation property, solubility, and thermal stability.11 Maillard reaction can be achieved under the wet or dry-heating conditions. Recently, wet-heating method, which shortened the reaction time of dry-heating method to only several hours, has been developed to reduce the adverse effects (insoluble aggregates) of Maillard reaction to ensure the production of functional protein–polysaccharide conjugates.12 The wet-heating method can change the molecular structure of proteins, which is conducive to the adsorption and reorganization of the protein on its interface, hence strongly affecting the interface properties of the protein.13 Several proteins, including egg white protein, soy protein, milk protein and whey protein, have been demonstrated to achieve improved emulsifying properties, water holding properties and gelation properties through glycation with saccharide.4,7,14 However, there are few studies on the physicochemical properties and gelation characteristics of rapeseed protein after modified by acylation and glycation.
The objective of this study was to improve the gelation properties of rapeseed protein by the mean of acylation and glycation and enhance its applicability in food industry. The amino acid compositions, surface hydrophobicities, free sulfhydryl, molecular weights and protein conformations of modified rapeseed proteins were analyzed. The effect of acylation and glycation on gel properties, water holding capacity, surface morphology and thermal properties of the rapeseed protein gels were investigated. Furthermore, the above indicators were analyzed by principal components.
2. Materials and method
2.1 Materials
The defatted rapeseed meal was provided by COFCO East Ocean Oils & Grains Industries Co., Ltd (Zhang Jiagang, China). Butanedioic anhydride, dextran, 5,5-dithiobis(2-nitrobenzoic acid) (DTNB), 8-anilino-1-naphthalenesulfonic acid ammonium salt for fluorescence (ANS), and ethylenediaminetetraacetic acid (EDTA) were purchased from Sigma-Aldrich (St. Louis, MO, USA). 2,4,6-Trinitrobenzene sulfonic acid (TNBS) was purchased from Beijing Ouhe Technology co., Ltd (Beijing, China).
2.2 Preparation of rapeseed protein isolates
Rapeseed protein isolates (RPI) were produced from defatted rapeseed meal according to a previously reported method1 with slight modifications. Briefly, defatted rapeseed meal was dispersed in deionized water (1![[thin space (1/6-em)]](https://www.rsc.org/images/entities/char_2009.gif) :15, w/v), adjusted to pH 11.0 by using 1 M NaOH with stirring at 40 °C for 2 h, and the slurry centrifuged at 10000g for 20 min at 4 °C. The supernatant was recovered, adjusted to pH 4.5 with 1 M HCl for 1 h, and centrifuged at 10000g for 30 min at 4 °C. The recovered precipitated proteins were then washed with anhydrous ethyl alcohol, redispersed in deionized water, and adjusted to pH 7.0 with 1 M NaOH. Finally, the protein solution was freeze-dried to acquire RPI.
:15, w/v), adjusted to pH 11.0 by using 1 M NaOH with stirring at 40 °C for 2 h, and the slurry centrifuged at 10000g for 20 min at 4 °C. The supernatant was recovered, adjusted to pH 4.5 with 1 M HCl for 1 h, and centrifuged at 10000g for 30 min at 4 °C. The recovered precipitated proteins were then washed with anhydrous ethyl alcohol, redispersed in deionized water, and adjusted to pH 7.0 with 1 M NaOH. Finally, the protein solution was freeze-dried to acquire RPI.
2.3 Protein modifications
RPI were modified by two processes: acylation with butanedioic anhydride (at 5, 10, and 15% w/w, respectively, protein basis) and glycation with dextran (at 1:1 ratio w/w, protein basis, heated at 95 °C for 1, 2, and 3 h, respectively). The modified and native proteins were then used to investigate the modifications (acylation and glycosylation) on effects of RPI gel properties.
Preparation of acylated RPI. Carboxyl-propionylated reactions were carried out on RPI using butanedioic anhydride based on previous method1 with slight modifications. Briefly, RPI solution (2% w/v, pH 10) was prepared in deionized distilled water with stirring for 30 min, and then butanedioic anhydride was added into the RPI solution (5, 10, and 15% w/w, respectively, protein basis), to obtain different degree of acylation samples RPI1, RPI2 and RPI3. During the acylation, the pH of mixture was maintained at 10 by adding 2 M NaOH. The mixture was dialyzed with deionized distilled water for 24 h (MWCO of 10 kDa) and then freeze-dried.
Preparation of glycated RPI. The glycated RPI was prepared by means of the Maillard reaction according to the method of Qu et al. with slight modifications.15 Brief, a 10 mg mL−1 RPI solution with pH 10 was prepared and fully mixed for 1 h. The RPI solution was mixed with dextran at 1:1 (w/w) ratio at room temperature for 30 min, and then the solution was adjusted to pH 10 with 1 M NaOH. The RPI–dextran mixture was then heated at 90 °C for 1, 2, and 3 h, respectively, and then immediately cooled in an ice-water bath to stop reaction. The reaction protein products (RPI4, RPI5, RPI6) were then freeze-dried.
2.4 Surface hydrophobicity (So)
The So of protein samples were determined using an aromatic fluorescence probe (ANS, 8-anilino-1-naphthalenesulfonic acid ammonium salt for fluorescence) based on previous method.16 Brief, samples stock solutions were successively diluted to final concentrations of 50–250 μg mL−1 using 0.01 M phosphate buffer (pH 8.0). Then, a 20 μL ANS (8 mM in 0.01 M phosphate buffer, pH 8.0) was added to 4 mL of each diluted sample solution. The fluorescence intensity of the mixture was tested by the fluorescent microtiter plate reader (SpectraMax Gemini™ XS, Molecular Devices, Inc., USA) at excitation and emission wavelengths of 390 nm and 470 nm, respectively. The initial slope of fluorescence versus sample concentration plot (calculated by linear regression analysis) was set as an index of So.
2.5 Determination of free sulfhydryl
The free sulfhydryl content was analyzed according to previous method of Beveridge et al.17 Ellman's reagent was prepared by dissolving 4 mg DTNB in 1 mL Tris–glycine buffer (pH 8.0). Then, 1 mL protein samples solution (1 mg mL−1, dissolved in Tris–glycine buffer that contain 8 M urea) was mixed evenly with 50 μL Ellman's reagent and then incubated for 30 min at room temperature. The mixture was then centrifuged for 20 min at 8000g. The absorbance of samples was tested by the microtiter plate reader (SpectraMax Gemini™ XS, Molecular Devices, Inc., USA) at 412 nm.
2.6 Amino acid analysis
Amino acid composition analysis of protein samples were performed based on the method of Hou et al. with slight modification.18 The 0.2 mg protein sample was added to 10 mL 6 M HCl and reacted under nitrogen at 110 °C for 24 h in the vial. The hydrolysate in the vials was cooled down, evaporated to dryness, and diluted to 50 mL using 0.02 M HCl. 100 μL solution was then further diluted to 1 mL using 0.02 M HCl and filtered (0.22 μm), and then placed in Hitachi Amino Acid Analyzer (L-8900, HITACHI, Japan). The analysis conditions were same as Hou's reported conditions. All results were repeated for three times.
2.7 FTIR analysis
FTIR spectrum analysis was carried out according to the method described by Wang et al.1 A tensor 27 infrared spectrophotometer (Bruker Optics, Ettlingen, Germany) was used to determine IR spectra of samples. The measurements were performed in a transmission mode using an IR cell, with KBr windows in the frequency region 400–4000 cm−1. Each protein spectrum was recorded at a resolution of 4 cm−1 and 64 scans. After background correction (KBr spectrum), all spectra were baseline corrected and obtained. The secondary structural changes (α-helix at 1650–1659 cm−1,β-sheet at 1618–1640 cm−1 and 1689–1698 cm−1, β-turn at 1660–1688 cm−1, unordered at 1641–1649 cm−1) of protein samples were analyzed by PeakFit software (v 4.12 Systat Software Inc., Point Richmond, CA) based on amide I (1600 to 1700 cm−1) region. The accuracy of the peak fitting procedure was evaluated by their correlation coefficients (R2 > 0.99), fit standard errors, and residual plots. Protein samples were analyzed in triplicates.
2.8 SDS-PAGE
The modified and native protein samples were resolved in 12% SDS-PAGE. In brief, 2 mg sample was added into 1 mL of deionized distilled water and mixed well. Then, the mixture was solubilized in a sample buffer (Bio-Rad, USA) and boiled for 10 min. After 10 min centrifugation at 10000 × g, 20 μL of the sample were loaded onto a 12% SDS-PAGE and then run at 70 V for stacking gel and 120 V for separating gel (Mini-protein unit, Bio-Rad, USA). The gel was stained in 0.1% Coomassie blue (R-250) solution comprising methanol (90 mL), DDI H2O (90 mL) and acetic acid (20 mL) for 2 h and de-stained in the same solution without the dye Coomassie blue.
2.9 Differential scanning calorimeter (DSC)
The thermal properties of protein samples were analyzed by a DSC-8000 instrument (Perkin Elmer, Shelton, USA). Nitrogen was used as a purge gas (20 mL min−1). 1 mg freeze dried sample and 10 mg deionized distilled water were weighted into an aluminum pan and hermetically sealed. The aluminum pan was heated from 30 to 150 °C at a rate of 10 °C min−1. An empty aluminum pan was used as reference. Denaturation temperature (Td) was calculated using Universal Analysis software. All experiments were performed in triplicate.
2.10 GEL preparation and characteristics
RPI gels were prepared based on previous method described by Aluko et al. with some modifications.19 The native and modified protein samples were suspended in deionized distilled water at concentrations of 10–18% (w/v) and placed into a cylindrical glass vials with a diameter of 28 mm and height of 57 mm. All mixtures in the vials were mixed evenly and heated at 95 °C in water bath for 30 min and then immediately cooled to room temperature in an ice bath followed by storing at 4 °C for overnight. The RPI samples concentration at which the formed gel didn't slip when the vial was inverted was taken as the least gelation concentration (LGC). The properties of formed gels were then analyzed by textural analyzer according to the method of He et al. (Stable Micro System TA. XTII plus, Surrey, UK).16 Gels were penetrated to 30% deformation with a P 0.5 (0.5 inch diameter of gel strength probe) probe at a constant rate of 0.2 mm s−1. The gels were analyzed directly within the vials in order to get the accurate information about the formed gels, and hardness, adhesiveness, springiness, cohesiveness, and chewiness were determined from the typical force–time curves by software (Exponent). Hardness was measured by peak force in the first compression cycle. Adhesiveness was measured by maximum negative force generated during upstroke of probe. Springiness was calculated as the distance of down stroke of the second compression. Cohesiveness was measured by the ratio of positive area during the second to that of the first compression cycle. Chewiness was then calculated as hardness × springiness × cohesiveness.
2.11 Water-holding capacity
The water-holding capacity (WHC) of RPI gels was measured according to the method of Valérie LeungSok Line et al. with slight modifications.20 The gels were weighted and placed into 1.5 mL centrifugal tubes, and then centrifuged at 9000 rpm for 20 min. The weight of overflow water in the tube was measured. Water-holding capacity was calculated as follows:| |
 | (1) |
where Wt is the total weight of gel and Wr is the weight of overflow water after centrifugation.
2.12 Surface morphology of gel by atomic force microscopy (AFM)
The surface morphology of RPI gels was analyzed by an AFM (Bruker Instruments, Madison, WI, USA) according to the method described by Wang et al. with some modifications. The RPI samples (150 mg mL−1) were prepared and deposited a drop onto mica, and then placed into a culture dish. The culture dish was heated at 95 °C in water bath for 30 min, subsequently, cooled to ambient temperature in an ice bath. Each sample was dried in air prior to AFM scanning. The surface morphology of gels was measured using ScanAsyst mode by AFM (probe model: TAP150). The scan area was 2 × 2 μm, and the scan frequency was 0.5. In both cases, the standard cantilever holders for operation in air were used. The average root mean square (Ra) of the roughness profile ordinates was calculated by NanoScope Analysis (Bruker) software.
2.13 Statistics
All experiments were replicated for at least 3 times (n ≥ 3). Values were expressed as the mean ± standard deviation (SD) and were analyzed by one-way factor analysis of variance (ANOVA). Tukey post hoc was applied for the differences between group means. SPSS 16.0 was used for all the statistical analyses. P < 0.05 was considered statistically significant.
3. Results and discussion
3.1 Acylation and glycation of RPI
To obtain the rapeseed protein with improved functional properties such as gelation, RPI was subjected to acylation and glycation modifications. Before the properties of modified RPI analysis, the degree of acylation and glycation of samples was determined firstly, which was shown in Table S1 (ESI).† The degree of acylation in the three acylated RPIs (RPI1, RPI2, RPI3) were determined to be 38.0 ± 0.2%, 47.0 ± 0.4%, and 56.0 ± 0.3%, respectively. The grafting degree of the three glycated RPIs (RPI4, RPI5, RPI6) were measured as 7.0 ± 1.8%, 12.0 ± 1.1%, and 17.0 ± 0.9%, respectively.
3.2 Amino acid composition analysis
Analysis of changes in amino acid compositions not only can determine the basic composition of the modified protein, but also can reflect the extent of modification. The amino acid composition for native RPI is shown in Table 1, where it was observed to have high levels of glutamic acid (19.9%), leucine (9.2%), aspartic acid (8.5%), lysine (6.7%) and glycine (5.9%). In addition, we found that the contents (57.1–58.6%) of hydrophilic amino acids in both native RPI and modified RPI were higher than those (41.4–43.3%) of hydrophobic amino acids.
Table 1 Amino acid compositions (%) of native RPI, acylated RPI (RPI1, RPI2, RPI3), and glycated RPI (RPI4, RPI5, RPI6)a
| Amino acid |
RPI |
Acylation |
Glycation |
| RPI1 |
RPI2 |
RPI3 |
RPI4 |
RPI5 |
RPI6 |
| The values in parenthesis were the change percentage points of amino acid compositions in modified RPI when compared to native RPI. |
| Hydrophilic amino acids |
| Asp |
8.5 |
8.5 |
8.3 |
10.0 (17.6↑) |
8.6 |
8.5 |
8.6 |
| Ser |
5.0 |
5.0 |
4.9 |
5.0 |
5.1 |
5.1 |
5.1 |
| Glu |
19.9 |
19.9 |
19.9 |
18.8 (5.5↓) |
20.4 |
20.5 |
20.5 |
| Gly |
5.9 |
5.8 |
5.8 |
5.9 |
5.9 |
5.8 |
5.9 |
| Cys |
0.1 |
0.1 |
0.1 |
0.1 |
0.1 |
0.1 |
0.1 |
| Tyr |
3.9 |
3.9 |
3.9 |
4.2 (7.7↑) |
3.8 |
3.7 (5.1↓) |
3.7 (5.1↓) |
| Lys |
6.7 |
6.3 (6.0↓) |
6.5 (3.0↓) |
5.7 (14.9↓) |
6.1 (9.0↓) |
6.2 (7.5↓) |
6.1 (9.0↓) |
| His |
3.6 |
3.6 |
3.6 |
3.3 (8.3↓) |
3.9 (8.3↑) |
4.0 (11.1↑) |
4.0 (11.1↑) |
| Arg |
4.1 |
4.1 |
4.1 |
3.7 (9.8↓) |
4.4 (7.3↑) |
4.5 (9.8↑) |
4.5 (9.8↑) |
| Total |
57.7 |
57.2 |
57.7 |
57.1 |
58.3 |
58.6 |
58.5 |
|
| Hydrophobic amino acids |
| Val |
5.5 |
5.4 |
5.1 (7.3↓) |
4.6 (16.4↓) |
5.5 |
5.3 (3.6↓) |
5.3 (3.6↓) |
| Met |
2.3 |
2.3 |
2.3 |
2.3 |
2.2 (4.3↓) |
2.1 (8.7↓) |
2.1 (8.7↓) |
| Ile |
4.9 |
4.9 |
4.8 |
5.0 |
4.7 (4.1↓) |
4.6 (6.1↓) |
4.6 (6.1↓) |
| Leu |
9.2 |
9.1 |
9.0 |
9.3 |
8.9 (3.3↓) |
8.8 (4.3↓) |
8.9 (3.3↓) |
| Thr |
4.9 |
4.9 |
4.9 |
5.0 |
5.0 |
4.9 |
5.0 |
| Ala |
5.3 |
5.2 |
5.2 |
5.4 |
5.3 |
5.2 |
5.3 |
| Pro |
4.9 |
4.9 |
4.9 |
4.9 |
4.7 (4.1↓) |
4.6 (6.1↓) |
4.6 (6.1↓) |
| Phe |
5.6 |
5.6 |
5.6 |
6.0 (7.1↑) |
5.6 |
5.7 |
5.7 |
| Total |
42.6 |
42.8 |
43.3 |
42.9 |
41.9 |
41.4 |
41.5 |
Acylation refers to the binding of succinyl groups to the free amino groups on protein. As shown in the Table 1, Lys, the main reactive amino acid during the acylation process, was reduced by 6.0%, 3.0% and 14.9% in its content in RPI1, RPI2 and RPI3, respectively. Increasing the degree of acylation of protein led to the reduced contents of Val, Arg, His and Glu, indicating Val, Arg, His and Glu could be involved in the acylation reaction. This might be attributed to the unfolding of protein structure by the high level of acylation that led to the exposure of reactive amino acids. It was worth noting that the change of the spatial structure of protein likely resulted in the exposure of other buried amino acids,15 which was confirmed by the increased content of Asp, Tyr and Phe shown in Table 1 in the RPI3 with high level of acylation degree.
The glycation of protein was mainly achieved by the Maillard reaction between amino groups of proteins and reducing sugars.21 Compared to the native RPI, the contents of Lys, Met, Ile, Leu and Pro in all glycated RPIs were decreased by glycation treatment, which is likely due to the wet-heating grafting reaction that induced the interaction of amino groups of RPI and dextran, indicating that Lys, Met, Ile, leu and Pro mighty be the glycation reaction sites of RPI and dextran. The reacted sites obtained in this study differed slightly from the those of Qu et al., reported earlier,15 which could be due to the slight difference in the process conditions, especially in the glycation method. Additionally, with increasing degree of glycation, Tyr and Val also were involved, indicating that high level of glycation could increase the exposure of reactive amino acids. The contents of His and Arg in all the glycated RPIs samples were increased, while the total contents of all amino acids did not significantly change, which is likely because that the loss of amines induced by Maillard reaction was offset by the increased exposure of other amine groups by inducing protein unfolding by modification.22 In addition, when the conformation around the Lys residues changed, it would affect the efficiency of other amino groups reacting with dextran, which in turn influenced the contents of amino groups.21
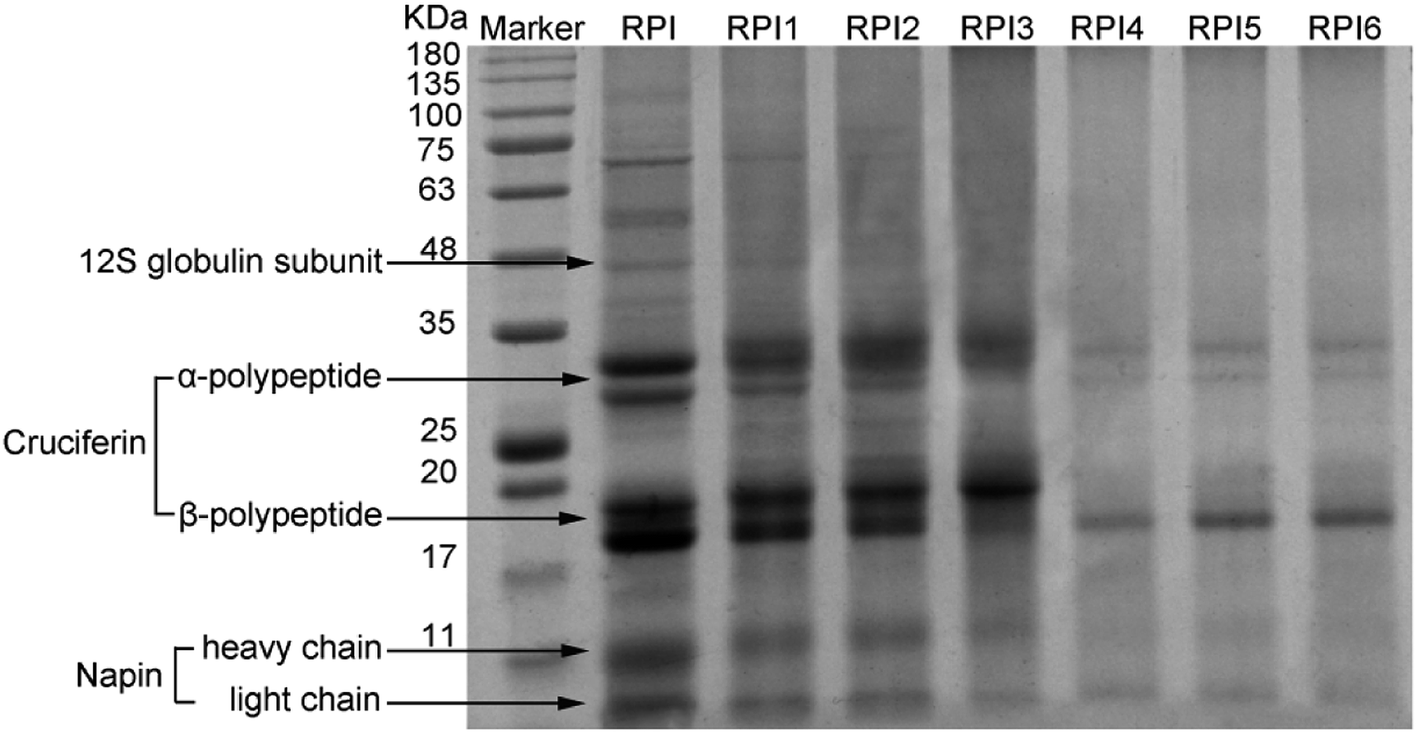
3.3 SDS-PAGE of modified RPI
SDS-PAGE patterns of native RPI and modified RPI were shown in Fig. 1. The pattern of native PRI showed the characteristic polypeptide bands including the 12S globulin subunit, α-polypeptide (∼30 kDa) and β-polypeptide (∼20 kDa) of cruciferin, and heavy (∼10 kDa) and light (∼4.5 kDa) chains of napin. This result was similar to the findings in the literatures.2,23 It was reported that acylation could increase the molecular weight of protein. Compared to the native RPI, by increasing the degree of acylation, the molecular weight of subunits in the acylated RPIs was gradually increased, which was likely due to the introduction of succinyl groups with high molecular weight during the acylation process.24 Moreover, high level of acylation caused significantly dissociation of high molecular of 12S globulin subunit and aggregates between 50 and 100 kDa shown in RPIs with lower degree of acylation and native RPI, while there were no significant changes at bands of the low molecular subunits (cruciferin and napin) in native and acylated RPIs (Fig. 1). These results are similar to those of Yin et al. and Wang et al. who also found that high molecular protein band of kidney bean protein and pea protein tended to dissociate with the increasing degree of the acylation.25,26 In addition, glycation treatment significantly reduced the intensity of RPI bands and the numbers of bands in the glycated RPI compared to those of both native RPI and acylated RPIs. It was observed that characteristic protein bands of 12S globulin subunit, α-polypeptide (∼30 kDa) and β-polypeptide (∼20 kDa) of cruciferin, and heavy (∼10 kDa) and light (∼4.5 kDa) of napin gradually became lighter with increasing degree of glycation. Moreover, the 12S globulin subunit and the α-polypeptide and β-polypeptide of cruciferin seemed to be the most affected in the glycated RPIs, indicating that globulin subunits were more involved in the glycation reaction. Thus it was implied that the Maillard reaction conjugated dextran to RPI likely by binding to globulin. This finding was in line with the previous finding from Safoura et al.2
 |
| | Fig. 1 SDS-PAGE pattern of molecular weight marker, acylated RPIs (RPI1, RPI2, RPI3), and glycated RPIs (RPI4, RPI5, RPI6). | |
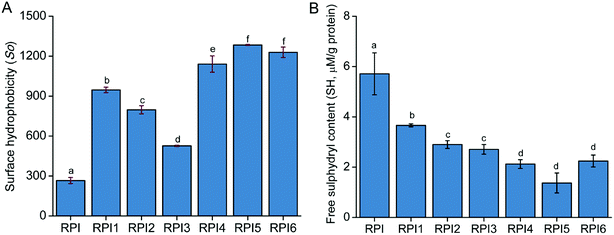
3.4 Surface hydrophobicity of native RPI and modified RPI
Surface hydrophobicity (So), measured by ANS probe, is an index of the number of hydrophobic groups exposed on the surface of the protein, which plays an important role in the functional properties of protein. As shown in Fig. 2A, So of RPI was significantly increased by the acylation and glycation treatments, indicating that native protein possessed the higher degree of folded structure compared to the modified proteins. Although both acylation and glycation treatments improved the So of RPI, the influence was significantly higher in the glycated RPIs than that of acylated RPIs. Additionally, we found that the So was partly dependent on glycation, where RPIs with GD of 12.0% and 17.0% (Table 1) have higher So than the RPI with 7.0% GD (especially at GD of 12.0%). This phenomenon could be attributed to that the disruption of organized RPI structures after covalent binding of sugar molecules by Maillard reaction, resulting in sterically unfolding of the proteins by weakening intra- and intermolecular interactions.27 It has been reported that the So of milk protein, soy protein isolate and β-conglycinin increased after modification by Maillard reaction with saccharide.28–30 Noteworthy, with increasing degree of glycation (from 12.0% GD to 17.0% GD), the So of protein decreased by ∼6%, which is in agreement with W. Li et al.31 who found that the higher the degree of glycation, the lower So protein possesses. Extensive studies reported that acylation could increase the surface hydrophobicity of protein by reducing the positive charge of protein and enhancing repulsion among protein subunits, and hence promoting the unfolding of protein structure, leading to the expose of hydrophobic groups.6,9 In this study, acylation of RPI significantly enhanced So of protein (especially RPI1, a acylation degree of 38%, Table 1). However, with the increasing degree of acylation, the So of RPI2 and RPI3 declined to 80% and 60% respectively when compared to the RPI1. This result was consistent with the finding of Zhao et al. who observed that the So of oat protein was decreased by the high degree of acylation.32 It was likely due to the excess amount of hydrophilic anionic succinyl group introduced into the RPI structure, leading to enhanced electronic repulsion by increasing electronegativity, which prevent ANS probe from binding to the exposed hydrophobic area, thus resulting in the decrease in So.8,33
 |
| | Fig. 2 Surface hydrophobicity (So) (A) and free sulfhydryl content (B) of native RPI, acylated RPIs (RPI1, RPI2, RPI3), and glycated RPIs (RPI4, RPI5, RPI6). Bars (mean ± SD) with different letters indicated a statistical difference between the mean values (P < 0.05). | |
3.5 Free sulfhydryl content
According to Fig. 2B, the amount of free SH groups in modified proteins were significantly decreased by the acylation and glycation treatments compared to that of the native RPI. The reduction in free SH content following acylation and glycation are consistent with previous reports for food proteins such as whey protein34 and pea protein.26 The reduction in the sulfhydryl groups can be attributed to the formation of disulfide linkages. High extent of acylation could also reduce the number of accessible free sulfhydryl groups by blocking the sulfhydryl groups of detection.26 Glycation led to even lower free SH content in RPI compared to acylation treatment, which could be ascribed to the heat treatment in Maillard reaction promoting the disulfide linkages formation in the glycated protein molecules compared to the mild condition (room temperature) used in acylation treatment.34 The reduction in SH content in RPI under high temperature was also reported by He et al. 2014.
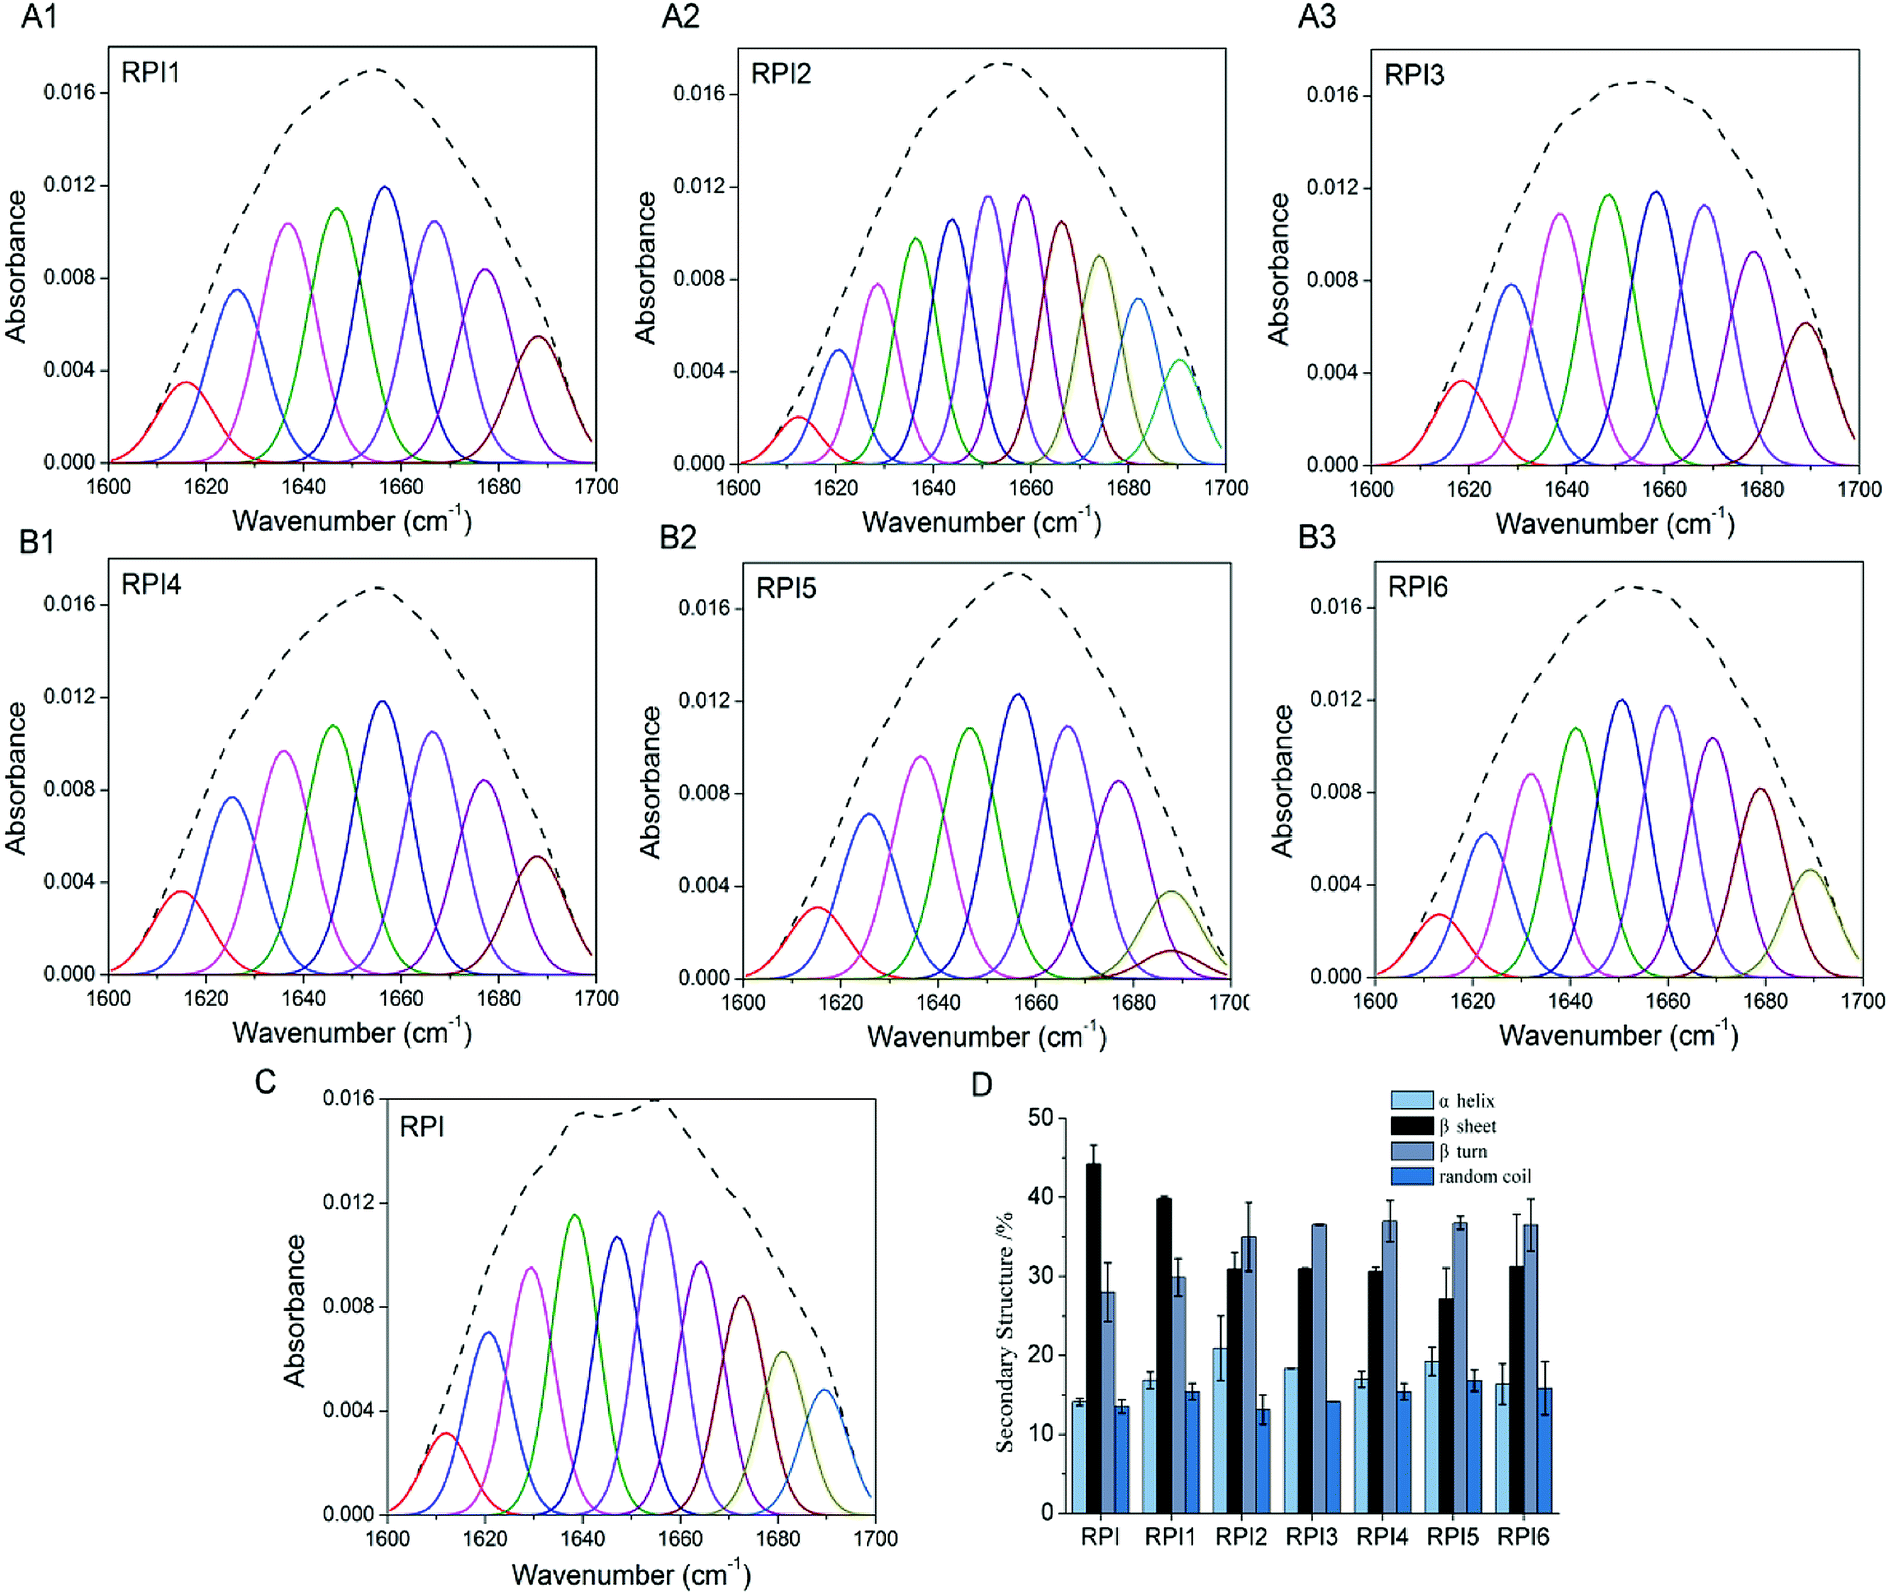
3.6 Protein conformational analysis
The secondary structures of RPIs were analyzed with FTIR in the amide I (1600–1700 cm−1) region, where the band assignments were as follows: α helix, β turn, β sheet and random coil. The quantitation of secondary structure contents was obtained by the fittings of Gaussian peaks and multiple peaks, which was summarized in Fig. 3A–C. As shown in Fig. 3D, compared to native RPI, the content of α helix and β turn increased (especially in RPI2 and RPI3) in the acylated RPIs, the content of β sheet decreased, and random coil was nearly unchanged with increasing extent of acylation. These results indicated that the structure of protein was significantly changed after the succinic groups were conjugated, and high level of acylation was prone to induce the transformation of β sheet to α helix and β turn. Similar findings have been reported in secondary structure of kidney bean protein.35 It was possible that acylation induced strong electrostatic repulsion interactions in combination with steric hindrance within RPI due to the conjugation of bulky anionic succinyl groups.36 The glycated RPIs showed an increase in content of α helix, β turn and random coil, while the β sheet content decreased (Fig. 3D). The alteration of secondary structure by glycation might be ascribed to multiple factors: (1) the conjugation of saccharide to RPI likely led to changes in spatial structure and unfolding of protein molecules, inducing random coil and β turn while reducing β sheet (generally located in the interior of the protein molecules);37 (2) the introduction of extensive hydroxyl groups from dextran could result in enhanced intermolecular interaction among the proteins, and therefore an increase in α-helix structure.38 It is well known that structure and functionality were closely related. Since the content of ordered structure (α helix and β sheet) of RPI1 was highest in the modified RPI (up to 56%), RPI1 likely possessed the better protein properties among the modified RPIs.
 |
| | Fig. 3 Fourier spectrum (upper) and Gaussian fitting curves (bottom) in the amide I region of modified RPI (A1–A3 and B1–B3) and native RPI (C). Secondary structure compositions of the native RPI, acylated RPIs (RPI1, RPI2, RPI3), and glycated RPIs (RPI4, RPI5, RPI6) (D). | |
3.7 DSC properties
In this study, DSC was conducted to evaluate the thermal properties of RPI samples. In the DSC spectra, the denaturation temperature and the denaturation enthalpy (ΔH) can be determined by the temperature and peak area corresponding to the maximum peak. As shown in Fig. 4, the denaturation temperature of native RPI is 132.47 °C. The denaturation temperature of acylation and glycation treated rapeseed protein (except RPI 3) in the range of 125.08–130.86 °C is slightly lower than that of native RPI, and the ΔH of acylated and glycated RPI was significantly higher than that of native RPI, suggesting that more energy was required for the denaturation of modified proteins and modifications improved the thermal stability of modified RPIs. The aggregation of proteins and disruption of hydrophobic bonds were exothermic reactions, which could reduce the enthalpy (ΔH) measured by DSC.39 Compared to low degree of acylation (RPI), there was a dramatic decrease of ΔH in the protein within high degree of acylation (RPI2 and RPI3). This is likely due to that strong electrostatic repulsive force introduced by the high amount of anionic succinyl groups disrupted protein molecular interactions, such as hydrophobic interactions, resulting in the reduced ΔH values.40 In addition, it has been reported that dextran molecules could enhance the steric spacers between protein molecules, protecting protein against aggregation by preventing the interactions of hydrophobic binding sites on its surface,39 which might explain the increase of ΔH in the glycated RPIs.
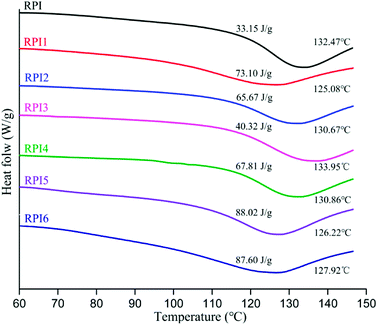 |
| | Fig. 4 DSC curves of rapeseed protein, acylated rapeseed protein, and glycosylated rapeseed protein. Insets show the denaturation temperature, Td (°C) and enthalpy, ΔH (J g−1) values. | |
3.8 Gelation and RPI gel properties
The gel properties of native RPI, acylated RPI, and glycated RPI are summarized in Table 2. As shown in Table 2, LGC (least gelation concentration) of RPI significantly (P < 0.05) decreased from 15% to 11% and 12% by slight acylation and glycation treatments, respectively. However, the high level of glycation-treated RPI resulted in an increase of LGC from 15% to 17%. These findings were consistent with data analysis of protein structure unfolding during acylation and glycation treatments (Fig. 2), which showed a significant increase in the So of modified RPI. The unfolded proteins were then able to interact through hydrophobic bonding to increase strength of gel networks and reduce the amount of proteins required to form gels, i.e., decreased LGC.41 Previous study found that hydrophobic interaction was a key factor during the formation of gel networks.42 However, the RPI5 and RPI6 (high extent of glycation protein) didn't reduce amount of proteins for forming gel even if they possessed of higher So than that of native RPI. This could be attributed to that the steric spacers between glycated protein molecules formed from the dextran coating, protected proteins against interaction by decreasing hydrophobic binding sites on its surface.39 As shown in Table 2, observed rheological properties of RPI gels were strongly related to types and extent of modifications. The hardness, springiness, cohesiveness and chewiness of the acylated RPI gel (RPI1) and the glycated RPI gels (RPI4 and RPI5) were significantly (P < 0.05) higher than those of the native RPI gel. The adhesiveness of all acylated RPI gels was lower than the native RPI gel and the glycated RPI gels. Gels prepared from RPI of low degree of acylation was shown to be relatively harder than gels obtained from the glycated RPI, or even transglutaminase-treated canola protein reported by Pinterits et al.,5 suggesting that superiority of acylation treatment when compared with enzymatic and glycation modifications. A certain degree of acylation modification not only increased the So (Fig. 2A), but also decreased the free SH content (Fig. 2B), and improved ordered secondary structure (Fig. 3). He et al. reported that the proportion of hydrophobic interactions, electrostatic interactions, disulfide bonds, and structural conformation can strongly influence protein gel properties.41 The observed better gel textural properties may be attributed to suitable proportion within the RPI after less extensive acylation process. The chewiness, which is expressed as the energy required to chew a solid prior to swallowing, were, 23.165 mJ and 15.491 mJ in RPI1 and RPI4, respectively, which further confirmed the capability of acylation treatment to induce formation of stronger RPI gels.
Table 2 The gelation properties of native RPI, acylated RPI, and glycated RPIa
| Sample |
LGC (%) |
Hardnessb (g) |
Adhesivenessb |
Springinessb |
Cohesivenessb |
Chewinessb (mJ) |
| Results were presented as mean ± SD. Different letters in the same column indicate a statistical difference between the mean values (P < 0.05). LGC = least gelation concentration. Test was completed at the 15% protein concentration. |
| RPI |
15a |
18.019 ± 1.314a |
−6.916 ± 0.745a |
0.686 ± 0.003a |
0.553 ± 0.004a |
6.830 ± 1.023a |
| RPI1 |
11b |
45.304 ± 0.568b |
−9.117 ± 0.324b |
0.858 ± 0.005b |
0.596 ± 0.004b |
23.165 ± 0.786b |
| RPI2 |
14c |
17.901 ± 1.021ac |
−16.109 ± 0.765c |
0.651 ± 0.004c |
0.442 ± 0.002c |
5.147 ± 0.653c |
| RPI3 |
15a |
16.250 ± 1.451c |
−15.023 ± 1.212c |
0.621 ± 0.004d |
0.578 ± 0.003d |
5.827 ± 0.896a |
| RPI4 |
12d |
27.747 ± 0.879d |
−4.023 ± 0.314d |
0.830 ± 0.006e |
0.672 ± 0.005e |
15.491 ± 1.360e |
| RPI5 |
15a |
20.562 ± 1.976a |
−0.638 ± 0.543e |
0.774 ± 0.004f |
0.603 ± 0.005f |
9.597 ± 1.431f |
| RPI6 |
17e |
— |
— |
— |
— |
— |
3.9 Water holding capacity of the gels
Water holding capacity is an important indicator of the interaction between protein and water.43 The water holding capacities of native RPI, and RPIs with different modification treatments were summarized in Fig. 5. The acylated RPI gels gained significantly better water holding capacity than the native RPI gel (P < 0.05). However, there was no significant difference among RPI1, RPI2 and RPI3, suggesting that the most robust network structure of gel to hold water could be formed under low degree of acylation. The acylation treatment has been demonstrated to improve the solubility of rapeseed protein, as well as the water holding capacity of the protein gel.44 The uniform spatial structure might also contribute to the increase of the gel holding capacity.45 After modification by glycation, the water holding capacity of RPI5 and RPI6 was higher than that of RPI4 (Fig. 5), which might be due to the high extent of glycation that introduced large amount of hydrophilic polysaccharides, enhancing the affinity among proteins and water molecules.46
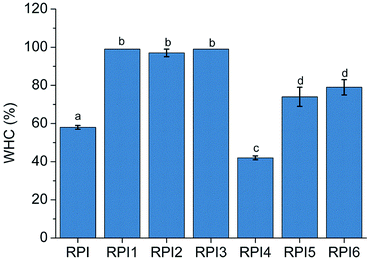 |
| | Fig. 5 Water holding capacity (WHC) of native RPI, and RPIs with different modification treatments. Bars (mean ± SD) with different letters indicated a statistical difference between the mean values (P < 0.05). Test was completed at the 15% protein concentration, while the RPI6 was completed at 17% protein concentration. | |
3.10 Surface morphology of the gels
Surface morphology is an important factor in understanding the characteristics of heat induced gels. The surface morphology of RPI gels was observed using AFM by 2D images, cross-section images, 3D images, and Ra values (Fig. 6). The degree of roughness of the gel surface could be visually observed from the 2D and 3D images. In addition, the straight lines on the 2D images are used to generate the cross-section images.47 Based on the 2D/3D images and cross-section images, the roughness of the gel surface decreased in the order of acylated RPI gels, glycated RPI gels and native RPI gel. Ra is a more accurate and quantitative indicator of the average roughness and was calculated from the height of all locations throughout the area. The Ra value decreased from 4.41 nm in the gel of original RPI to 1.10, 2.22 and 2.10 nm in the gels of acylated RPI1, RPI2 and RPI3, respectively. However, as the degree of glycation increases, glycation reduced Ra value to 2.95, 3.15, and 3.52 nm in the gels of RPI4, RPI 5 and RPI6, respectively. The acylated RPI gels had a lower Ra than that of the glycated protein gels, implying that interaction based on low level of acylation RPI could produce a smoother and flatter protein gel network than glycated RPI. The pictures of the RPI gels are shown in Fig. 7 further confirm the results obtained by AFM. In conclusion, slight modification with native RPI can reduce the roughness of the RPI gels and change the gels surface morphology to a more continuous and uniform gel network structure.
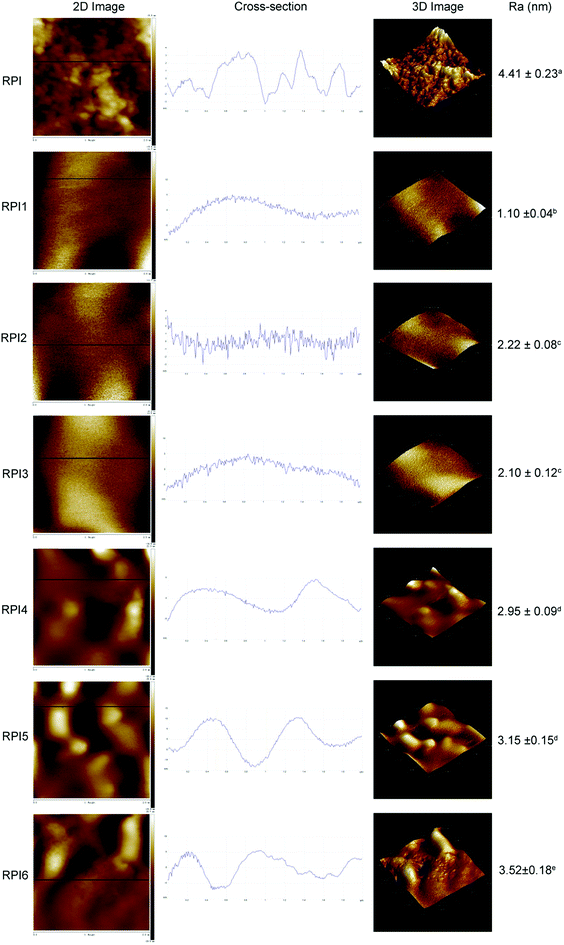 |
| | Fig. 6 AFM images of native RPI gel, acylated RPI (RPI1, RPI2, RPI3) gels, and glycated RPI (RPI4, RPI5, RPI6) gels (2 × 2 μm2 scan size). The images displayed on the left were the 2D image of different RPI gels. The image cross-sections corresponded to the section cut by the black straight line on the 2D image. This corresponded to the gel largest surface roughness. The average roughness values (Ra) displayed on the right were presented as mean ± SD with different letters, indicating statistical differences between the mean values (P < 0.05). | |
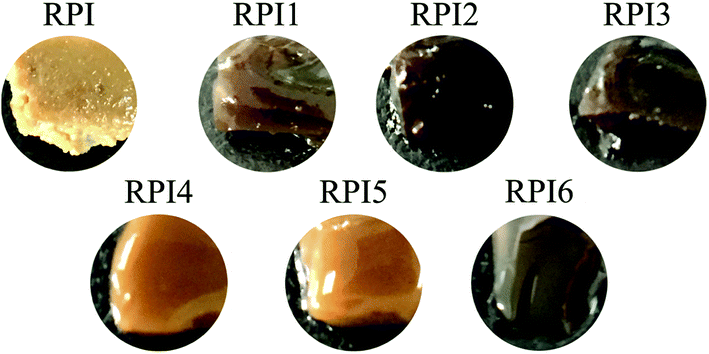 |
| | Fig. 7 The photos of native RPI gel, acylated RPI gels (RPI, RPI2, RPI3), and glycated RPI gels (RPI4, RPI5, RPI6). Gels were prepared at 15% (w/v) at 95 °C in water bath for 30 min, while RPI6 was prepared at 17% (w/v) at 95 °C in water bath for 30 min. | |
3.11 Principal component analysis of RPI samples
Principal component analysis (PCA) was conducted to investigate the associations among the protein gel properties (SH, So, WHC, secondary structure, hardness, springiness, denaturation enthalpies, cohesiveness, Ra) of native RPI, acylated RPIs and glycated RPIs samples.48 The factor loading plot and factor scores plot were shown in Fig. 8. As shown in the Fig. 8A, the first component (PC1), which showed 43.9% of the variance, was positively correlated to cohesiveness, hardness, springiness, denaturation enthalpies and Ra, but was negatively correlated to the SH, WHC and secondary structure. The secondary component (PC2), which showed 24.8% of the variance, was positively correlated with SH, WHC, secondary structure, hardness, springiness and denaturation enthalpies. However, So, cohesiveness, and Ra showed negative correlations with PC2 (Fig. 8A). The two principal components explained 68.7% of the total variation. The score plots shown in Fig. 8B enabled differentiations among samples with different modifications based on the placement of each sample. The RPI1 sample resided in the first quadrant, but RPI4 and RPI5 samples were clustered in the fourth quadrant. This indicated that acylated RPI with low acylation degree were negatively correlated based on PC2, but positively correlated based on PC1. In addition, we found that the RPI1 was negatively correlated with RPI, RPI2 and RPI3 based on the PC1, whereas it was positively correlated with RPI and RPI 2 based on PC2. Thus, according to the PCA modified RPI with low acylation degree tended to facilitate the protein gel properties with regards to hardness, springiness, denaturation enthalpies, secondary structure, SH and WHC.
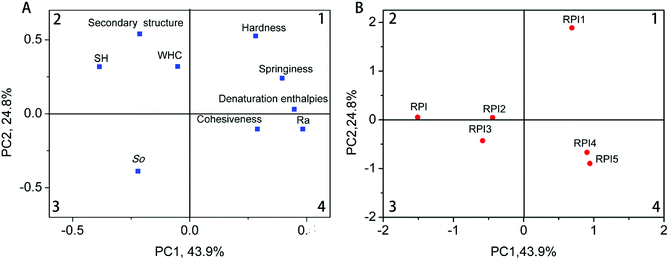 |
| | Fig. 8 The principal component analysis of native RPI and modified RPIs formed by PC1 and PC2: factor loading (A) and factor scores (B). Secondary structure is the percentage of ordered α-helix and β sheet contents. | |
4. Conclusion
In this study, the effect of acylation and glycation on the physicochemical and gelation properties of RPI was investigated. Amino acid composition analysis and SDS-PAGE demonstrated that acylated and glycated RPIs were likely formed by the conjugation of succinyl groups and dextran to Lys, and Lys, Met, Ile, leu and Pro, respectively. Both modifications increased the So of RPI and reduced the SH content of RPI. However, the magnitudes of change of So and SH in the acylated RPIs were significantly lower than those of the glycated RPI. FTIR analysis suggested the secondary structure of RPI was changed after the conjugation of succinic groups and dextran, where β sheet was transformed to α helix, β turn, and random coil. Notably, the content of the ordered structure (α helix and β sheet) of RPI1 was highest in the modified RPIs (up to 56%). DSC spectra indicated that acylation and glycation treatments improved thermal stability of modified proteins compared to that of native RPI. Furthermore, among the modifications RPI1 (low degree of acylation treatment) achieved the best overall improvement in the gelation and gel properties as evidenced by the reduced LGC values, Ra and adhesiveness, and increased WHC, hardness, springiness, cohesiveness and chewiness. Above results were consistent with the PCA, which indicated that moderate modification (especially low degree acylation) tended to facilitate the improvement of the protein gel properties with a more stable and homogeneous gel network. In conclusion, we believe that RPI with slight acylation process could be used as a potential functional food ingredient in food industry.
Conflicts of interest
No conflict of interest exits in the submission.
Acknowledgements
Funding for this work was provided by the National Natural Science Foundation of China (31501522, 31571767), Nanjing Agricultural Science and Technology Research project (Project No. 201505056) and a project funded by the Priority Academic Program Development of Jiangsu Higher Education Institutions (PAPD).
References
- Z. Wang, X. Ju, R. He, J. Yuan and L. Wang, Food Bioprocess Technol., 2015, 8, 1305–1318 CrossRef CAS.
- S. Pirestani, A. Nasirpour, J. Keramat and S. Desobry, Carbohydr. Polym., 2017, 155, 201–207 CrossRef CAS PubMed.
- A. Moure, J. Sineiro, H. Domínguez and J. C. Parajó, Food Res. Int., 2006, 39, 945–963 CrossRef CAS.
- W. W. Sun, S. J. Yu, X. Q. Yang, J. M. Wang, J. B. Zhang, Y. Zhang and E. L. Zheng, Food Res. Int., 2011, 44, 3259–3263 CrossRef CAS.
- A. Pinterits and S. D. Arntfield, LWT–Food Sci. Technol., 2008, 41, 128–138 CrossRef CAS.
- C.-B. Zhao, H. Zhang, X.-Y. Xu, Y. Cao, M.-Z. Zheng, J.-S. Liu and F. Wu, Process Biochem., 2017, 57, 117–123 CrossRef CAS.
- C. B. Zhao, L. Y. Zhou, J. Y. Liu, Y. Zhang, Y. Chen and F. Wu, J. Food Sci. Technol., 2016, 53, 2342–2351 CrossRef CAS PubMed.
- A. O. Matemu, H. Kayahara, H. Murasawa, S. Katayama and S. Nakamura, Food Chem., 2011, 124, 596–602 CrossRef CAS.
- L. Mirmoghtadaie, M. Kadivar and M. Shahedi, Food Chem., 2009, 114, 127–131 CrossRef CAS.
- C. Y. Ma and D. F. Wood, J. Am. Oil Chem. Soc., 1987, 64, 1726–1731 CrossRef CAS.
- S. Pirestani, A. Nasirpour, J. Keramat and S. Desobry, Carbohydr. Polym., 2017, 155, 201–207 CrossRef CAS PubMed.
- D. Zhu, S. Damodaran and J. A. Lucey, J. Agric. Food Chem., 2008, 56, 7113–7118 CrossRef CAS PubMed.
- S. Boostani, M. Aminlari, M. Moosavinasab, M. Niakosari and G. Mesbahi, Int. J. Biol. Macromol., 2017, 102, 297–307 CrossRef CAS PubMed.
- J. A. O'Mahony, K. P. Drapala, E. M. Mulcahy and D. M. Mulvihill, Int. Dairy J., 2017, 67, 16–34 CrossRef.
- W. Qu, X. Zhang, X. Han, Z. Wang, R. He and H. Ma, Food Hydrocolloids, 2018, 82, 329–337 CrossRef CAS.
- R. He, H.-Y. He, D. Chao, X. Ju and R. Aluko, Food Bioprocess Technol., 2014, 7, 1344–1353 CrossRef CAS.
- T. Beveridge, S. Toma and S. Nakai, J. Food Sci., 1974, 39, 49–51 CrossRef CAS.
- F. Hou, W. Ding, W. Qu, A. O. Oladejo, F. Xiong, W. Zhang, R. He and H. Ma, Food Chem., 2017, 218, 207–215 CrossRef CAS PubMed.
- R. E. Aluko, O. A. Mofolasayo and B. M. Watts, J. Agric. Food Chem., 2009, 57, 9793–9800 CrossRef CAS PubMed.
- V. L. S. Line, G. E. Remondetto and M. Subirade, Food Hydrocolloids, 2005, 19, 269–278 CrossRef.
- H. Chen, P. Wang, F. Wu, J. Xu, Y. Tian, N. Yang, A. I. Cissouma, Z. Jin and X. Xu, Int. J. Biol. Macromol., 2013, 55, 258–263 CrossRef CAS PubMed.
- X. Guo and Y. L. Xiong, LWT–Food Sci. Technol., 2013, 51, 397–404 CrossRef CAS.
- M. Aider and C. Barbana, Trends Food Sci. Technol., 2011, 22, 21–39 CrossRef CAS.
- S. J. Sheen, J. Agric. Food Chem., 1991, 39, 1070–1074 CrossRef CAS.
- S. W. Yin, C. H. Tang, Q. B. Wen and X. Q. Yang, J. Food Sci., 2010, 74, E488–E494 CrossRef PubMed.
- K. Wang and S. D. Arntfield, Food Hydrocolloids, 2016, 61, 567–577 CrossRef CAS.
- T. J. Wooster and M. A. Augustin, Food Hydrocolloids, 2007, 21, 1072–1080 CrossRef CAS.
- B. Hiller and P. C. Lorenzen, Food Res. Int., 2010, 43, 1155–1166 CrossRef CAS.
- J.-B. Zhang, N.-N. Wu, X.-Q. Yang, X.-T. He and L.-J. Wang, Food Hydrocolloids, 2012, 28, 301–312 CrossRef CAS.
- L. Mu, M. Zhao, B. Yang, H. Zhao, C. Cui and Q. Zhao, J. Agric. Food Chem., 2010, 58, 4494–4499 CrossRef CAS PubMed.
- W. Li, H. Zhao, Z. He, M. Zeng, F. Qin and J. Chen, Colloids Surf., B, 2016, 138, 70–77 CrossRef CAS PubMed.
- C. B. Zhao, H. Zhang, X. Y. Xu, Y. Cao, M. Z. Zheng, J. S. Liu and F. Wu, Process Biochem., 2017, 57, 117–123 CrossRef CAS.
- L. Gruener and M. Ismond, Food Chem., 1997, 60, 513–520 CrossRef CAS.
- Q. Wang and B. Ismail, Int. Dairy J., 2012, 25, 112–122 CrossRef.
- S.-W. Yin, C.-H. Tang, Q.-B. Wen, X.-Q. Yang and D.-B. Yuan, Food Res. Int., 2010, 43, 730–738 CrossRef CAS.
- J. Chakraborty, N. Das, K. P. Das and U. C. Halder, Int. Dairy J., 2009, 19, 43–49 CrossRef CAS.
- C. Li, H. Xue, Z. Chen, Q. Ding and X. Wang, Food Res. Int., 2014, 57, 1–7 CrossRef CAS.
- T. J. Wooster and M. A. Augustin, Food Hydrocolloids, 2007, 21, 1072–1080 CrossRef CAS.
- Y. Liu, G. Zhao, M. Zhaoa and B. Yang, Food Chem., 2012, 131, 901–906 CrossRef CAS.
- C. Yang, Y. Wang, T. Vasanthan and L. Chen, Food Hydrocolloids, 2014, 40, 225–236 CrossRef CAS.
- R. He, H.-Y. He, D. Chao, X. Ju and R. Aluko, Food Bioprocess Technol., 2013, 7, 1344–1353 CrossRef.
- F. E. O'Kane, J. M. Vereijken, H. Gruppen and V. M. A. J. S. Boekel, J. Food Sci., 2010, 70(2), 132–137 CrossRef.
- H. Hu, X. Fan, Z. Zhou, X. Xu, G. Fan, L. Wang, X. Huang, S. Pan and L. Zhu, Ultrason. Sonochem., 2013, 20, 187–195 CrossRef CAS PubMed.
- W. Wu, Y. Hua, Q. Lin and H. Xiao, Int. J. Food Sci. Technol., 2011, 46, 1891–1897 CrossRef CAS.
- F. J. Kao, A. Nanwei Su and M. H. Lee, J. Agric. Food Chem., 2003, 51, 6211–6216 CrossRef CAS PubMed.
- L. Mu, M. Zhao, B. Yang, H. Zhao, C. Cui and Q. Zhao, J. Agric. Food Chem., 2010, 58, 4494–4499 CrossRef CAS PubMed.
- H. Niu, X. Xia, C. Wang, B. Kong and Q. Liu, Food Chem., 2018, 242, 188–195 CrossRef CAS PubMed.
- P. Chen, Q. Zhang, H. Dang, X. Liu, F. Tian, J. Zhao, Y. Chen, H. Zhang and W. Chen, Food Control, 2014, 35, 65–72 CrossRef CAS.
Footnotes |
| † Electronic supplementary information (ESI) available. See DOI: 10.1039/c8ra07912a |
| ‡ These authors contributed equally to this work. |
|
| This journal is © The Royal Society of Chemistry 2018 |
Click here to see how this site uses Cookies. View our privacy policy here. 
 Open Access Article
 This Open Access Article is licensed under a Creative Commons Attribution-Non Commercial 3.0 Unported Licence
 a,
Cheng Zhang‡b,
Tian Zhangc,
Xingrong Ju*ab and
Rong He*b
a,
Cheng Zhang‡b,
Tian Zhangc,
Xingrong Ju*ab and
Rong He*b