 Open Access Article
Creative Commons Attribution 3.0 Unported Licence
One step synthesis of high-efficiency AgBr–Br–g-C3N4 composite catalysts for photocatalytic H2O2 production via two channel pathway
Yunke Wang,
Shaozheng Hu,
Qiang Li,
Guizhou Gu,
Yanfeng Zhao,
Hongyu Liang and
Wei Li *
*
College of Chemistry, Chemical Engineering, and Environmental Engineering, Liaoning Shihua University, Fushun 113001, China. E-mail: weililnpu@163.com
First published on 1st November 2018
Abstract
In this work, a two-component modified AgBr–Br–g-C3N4 composite catalyst with outstanding photocatalytic H2O2 production ability is synthesized. XRD, UV-Vis, N2 adsorption, TEM, XPS, EPR and PL were used to characterize the obtained catalysts. The as-prepared AgBr–Br–g-C3N4 composite catalyst shows the highest H2O2 equilibrium concentration of 3.9 mmol L−1, which is 7.8 and 19.5 times higher than that of GCN and AgBr. A “two channel pathway” is proposed for this reaction system which causes the remarkably promoted H2O2 production ability. In addition, compared with another two-component modified catalyst, Ag–AgBr–g-C3N4, AgBr–Br–g-C3N4 composite catalyst displays the higher photocatalytic H2O2 production ability and stability.
Introduction
Hydrogen peroxide (H2O2) is a highly efficient and green oxidant because it has a high content of active oxygen (47% w/w) and results in only H2O as a by-product.1,2 Industrially, H2O2 is produced by the anthraquinone method, in which energy consumption is high because of the multistep hydrogenation and oxidation reactions. Thus this method is unsuitable for the current new concept of being “green, energy saving, and environmentally friendly” in the chemical industry. Recently, the direct synthesis of H2O2 from H2 and O2 gases has been widely studied using noble metals as catalysts.3,4 It is considered to be an alternative and green chemical process. However, this method presents a potential explosion risk from H2/O2 mixtures. In contrast, photocatalytic H2O2 production requires only water, oxygen and visible light through two-electron reduction from the conduction band (reaction (1)). However, the H2O2 can be decomposed by reduction with e−, which has caused the H2O2 production rate of this photocatalytic reduction method to be unsatisfactory to date (reaction (2)).| O2 + 2H+ + 2e− → H2O2 | (1) |
| H2O2 + e− → ·OH + OH− | (2) |
Graphite phase carbon nitride (g-C3N4), as the darling of the catalytic community in recent years, has special physical and chemical properties, excellent chemical stability and adjustable electronic structure.5,6 Since its conduction band potential (−1.3 V) is more negative than the reduction potential of O2/H2O2 (0.695 V), g-C3N4 could reduce O2 to H2O2 under visible light thermodynamically.7 However, g-C3N4 also suffers from many disadvantages, such as the low visible-light utilization efficiency, high recombination rate and small BET surface area, which limit its practical application.
AgX (X = Cl, Br, I) is a kind of common photocatalyst. They have the moderate energy level which is very appropriate to combine with g-C3N4 for building heterojunction to resolve these disadvantages mentioned above.8–14 Feng et al. prepared g-C3N4/AgBr nanocomposite photocatalyst via a protonation pretreatment method.8 They found the efficient combination of g-C3N4 and AgBr leads to Z-scheme charge transfer in the composite system, and the photocatalytic activity is therefore enhanced significantly. Liu et al. prepared AgI@g-C3N4 hybrid core@shell structure by ultrasonication/chemisorption method.9 They suggested that the improved photocatalytic performance is due to synergistic effects at the interface of AgI and g-C3N4 which can effectively accelerate the charge separation and reinforce the photostability of hybrid composite. In addition of building heterojunction with silver halide, halogen doping and Ag loading are also efficient method to promote the visible-light utilization efficiency and separation rate of electrons–holes. Lan et al. prepared Br doped g-C3N4 for photoredox water splitting via one-pot co-condensation of urea with NH4Br.15 The optimal sample shows more than two times higher H2 evolution rates than pure g-C3N4 under visible light irradiation, with high stability during the prolonged photocatalytic operation. Bu et al. prepared Ag loaded mesoporous g-C3N4 with high photoelectric conversion performance.16 They suggested that modifying mesoporous g-C3N4 with Ag increases the conductivity and lowers the energy barrier of the interface reactions, thus enhances the separation efficiency of photogenerated electron–hole pairs.
Besides, two-component modification, such as Ag–AgX, are also used to promote the catalytic performance of g-C3N4.17,18 Wang et al. prepared a high-efficiency g-C3N4/Ag/AgCl plasmonic photocatalyst via a facile solvothermal method.17 The surface plasmon resonance effect of the Ag nanoparticles, the polarization field of AgCl and the g-C3N4/Ag/AgCl heterojunction all result in the improved photocatalytic degradation performance. Chen et al. prepared plasmonic photocatalyst Ag/AgBr/g-C3N4 by in situ ionic-liquid-assisted synthesis.18 The enhanced photocatalytic activity is assigned to the extended light-absorption range and efficient charge separation caused by the surface plasmon resonance effect of Ag0 and the well-matched overlapping band-structure between Ag/AgBr and g-C3N4. Interestingly, till now, few literature concerning silver halide–halogen–g-C3N4 catalyst is reported. F and I have been applied to dope g-C3N4. It was found that F dopant give much less promotional effect on the optical absorption of g-C3N4 than I.19 This is because the valence electrons in I atom with much less electronegativity are more delocalized to interact with the π electron system of g-C3N4. Such an extended conjugation system gives rise to the red-shift of the optical absorption of g-C3N4. However, the overlarge size of I atom is thermodynamically and geometrically difficult to dope into g-C3N4 to form stable structure. To this end, Br in the middle of F and I is a recommended choice to modify g-C3N4. In this work, AgBr–Br–g-C3N4 composite catalyst is prepared via one-pot synthesis. The as-prepared AgBr–Br–g-C3N4 composite catalyst is applied for photocatalytic H2O2 production under visible light irradiation. The effects of modification on the structural property, optical property, and photocatalytic performance of catalysts are discussed in detail. The possible reaction mechanism is proposed.
Experimental
Preparation and characterization
4 g of dicyandiamide and desired amount of AgNO3 were dissolved into 40 mL deionized water under stirring to obtain solution A. Then, NH4Br solution was added dropwise into solution A (molar ratio Ag/Br = 1). The obtained suspension was stirred for 2 h, and heated to 80 °C to remove the water. The solid was dried at 80 °C and followed by milling and annealing at 550 °C for 2 h (at a rate of 5 °C min−1). The obtained catalyst was denoted as AgBr/GCN(x), where x stands for the mass ratio of AgBr/dicyandiamide. Neat AgBr was prepared according to the method mentioned above in the absence of dicyandiamide. When excess NH4Br was added into solution A and followed the same procedure mentioned above, the prepared catalyst was denoted as AgBr/Br(y)–GCN(x), where y stands for the molar ratio of Ag/Br.The XRD patterns of the samples were recorded on a Rigaku D/max-2400 instrument using Cu-Kα radiation (λ = 1.54 Å). UV-Vis spectroscopy was carried out on a UV-Vis spectrophotometer (JASCO V-550) using BaSO4 as the reflectance sample. TEM images were taken on a Philips Tecnai G220 model microscope. Nitrogen adsorption was measured at −196 °C on a Micromeritics 2010 analyzer. The BET surface area (SBET) was calculated based on the adsorption isotherm. Elemental analysis was performed using a vario EL cube from Elementar Analysensysteme GmbH. ICP was performed on a Perkin-Elmer Optima 3300DV apparatus. The XPS results were obtained on a Thermo Escalab 250 XPS system. Al Kα radiation was used as the excitation source. The electron paramagnetic resonance (EPR) was determined with a Bruker ESR 300E, using the radical scavenger dimethyl pyridine N-oxide (DMPO). The photoluminescence (PL) spectra were measured with a fluorospectrophotometer (FP-6300) using Xe lamp as the excitation source.
Photocatalytic reaction
The photocatalytic H2O2 production ability of the samples was evaluated by the reduction of molecular oxygen. For these experiments, 0.2 g of photocatalyst was added to 200 mL of deionized water. The suspension was dispersed using an ultrasonicator for 10 min. During the photoreaction under visible light irradiation, the suspension was exposed to a 250 W high-pressure sodium lamp with main emission from 400 to 800 nm, and O2 was bubbled at 80 mL min−1 through the solution. The UV light portion of the sodium lamp was filtered by a 0.5 M NaNO2 solution. All runs were conducted at ambient pressure and 30 °C. At given time intervals, 5 mL aliquots of the suspension were collected and immediately centrifuged to separate the liquid samples from the solid catalyst. The H2O2 concentration was analyzed by the normal iodometric method.20,21Results and discussion
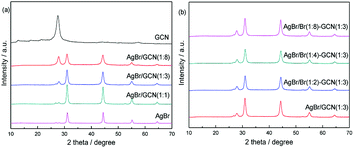
Fig. 1 shows the XRD patterns of GCN, AgBr and as-prepared composite catalysts. The characteristic peak of GCN around 27.5° could be clearly identified, which is attributed to the typical (0 0 2) interlayer-stacking peak corresponds to an interlayer distance of d = 0.33 nm. The peak at 13.1° represents in-plane structural packing motif with a d value of 0.675 nm.22 For AgBr, the sample shows several diffraction peaks at 31.0°, 44.4°, 55.1° and 64.6°, which are assigned to the (2 0 0), (2 2 0), (2 2 2) and (4 0 0) planes of AgBr crystal (JCPDS file: 6-438).8,18 In the case of as-prepared composite catalysts, the peak position does not shift but the intensity for AgBr (GCN) decreases (increases) gradually with increasing the amount of GCN, as shown in Fig. 1a. It is shown in Fig. 1b that, when excess Br was added, the peak intensity and position for both GCN and AgBr are not changed. In addition, the element analysis and ICP results indicate that, the AgBr concentrations in AgBr/GCN(1![[thin space (1/6-em)]](https://www.rsc.org/images/entities/char_2009.gif) :
:![[thin space (1/6-em)]](https://www.rsc.org/images/entities/char_2009.gif) 8), AgBr/GCN(1
8), AgBr/GCN(1![[thin space (1/6-em)]](https://www.rsc.org/images/entities/char_2009.gif) :
:![[thin space (1/6-em)]](https://www.rsc.org/images/entities/char_2009.gif) 3) and AgBr/GCN(1
3) and AgBr/GCN(1![[thin space (1/6-em)]](https://www.rsc.org/images/entities/char_2009.gif) :
:![[thin space (1/6-em)]](https://www.rsc.org/images/entities/char_2009.gif) 1) are 26 wt%, 42 wt% and 69 wt%, respectively. For AgBr/Br(1
1) are 26 wt%, 42 wt% and 69 wt%, respectively. For AgBr/Br(1![[thin space (1/6-em)]](https://www.rsc.org/images/entities/char_2009.gif) :
:![[thin space (1/6-em)]](https://www.rsc.org/images/entities/char_2009.gif) 2)–GCN(1
2)–GCN(1![[thin space (1/6-em)]](https://www.rsc.org/images/entities/char_2009.gif) :
:![[thin space (1/6-em)]](https://www.rsc.org/images/entities/char_2009.gif) 3), AgBr/Br(1
3), AgBr/Br(1![[thin space (1/6-em)]](https://www.rsc.org/images/entities/char_2009.gif) :
:![[thin space (1/6-em)]](https://www.rsc.org/images/entities/char_2009.gif) 4)–GCN(1
4)–GCN(1![[thin space (1/6-em)]](https://www.rsc.org/images/entities/char_2009.gif) :
:![[thin space (1/6-em)]](https://www.rsc.org/images/entities/char_2009.gif) 3) and AgBr/Br(1
3) and AgBr/Br(1![[thin space (1/6-em)]](https://www.rsc.org/images/entities/char_2009.gif) :
:![[thin space (1/6-em)]](https://www.rsc.org/images/entities/char_2009.gif) 8)–GCN(1
8)–GCN(1![[thin space (1/6-em)]](https://www.rsc.org/images/entities/char_2009.gif) :
:![[thin space (1/6-em)]](https://www.rsc.org/images/entities/char_2009.gif) 3), the doping Br concentrations are 0.25 wt%, 0.44 wt% and 0.72 wt%, respectively.
3), the doping Br concentrations are 0.25 wt%, 0.44 wt% and 0.72 wt%, respectively.
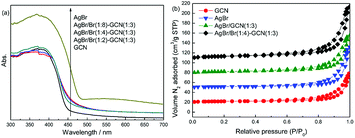
Fig. 2a displays the UV-Vis spectra of as-prepared catalysts. GCN shows the typical absorption spectrum of graphitic carbon nitride semiconductor with an absorption boundary at approximately 450 nm. For AgBr, the absorption in the whole region is stronger than that of GCN. Its absorption boundary is around 490 nm. In the case of as-prepared composite catalysts, compared with GCN, their absorption boundaries are shifted slightly to 460–470 nm. The higher Br/Ag molar ratio, the larger shift of absorption boundary. In addition, because of the presence of AgBr, the composite catalysts display the increased absorption in the whole visible light region. The band gaps of samples were calculated according to the method of Oregan and Gratzel.23 The result shows that the band gap for GCN, AgBr/Br(1![[thin space (1/6-em)]](https://www.rsc.org/images/entities/char_2009.gif) :
:![[thin space (1/6-em)]](https://www.rsc.org/images/entities/char_2009.gif) 2)–GCN(1
2)–GCN(1![[thin space (1/6-em)]](https://www.rsc.org/images/entities/char_2009.gif) :
:![[thin space (1/6-em)]](https://www.rsc.org/images/entities/char_2009.gif) 3), AgBr/Br(1
3), AgBr/Br(1![[thin space (1/6-em)]](https://www.rsc.org/images/entities/char_2009.gif) :
:![[thin space (1/6-em)]](https://www.rsc.org/images/entities/char_2009.gif) 4)–GCN(1
4)–GCN(1![[thin space (1/6-em)]](https://www.rsc.org/images/entities/char_2009.gif) :
:![[thin space (1/6-em)]](https://www.rsc.org/images/entities/char_2009.gif) 3), AgBr/Br(1
3), AgBr/Br(1![[thin space (1/6-em)]](https://www.rsc.org/images/entities/char_2009.gif) :
:![[thin space (1/6-em)]](https://www.rsc.org/images/entities/char_2009.gif) 8)–GCN(1
8)–GCN(1![[thin space (1/6-em)]](https://www.rsc.org/images/entities/char_2009.gif) :
:![[thin space (1/6-em)]](https://www.rsc.org/images/entities/char_2009.gif) 3) and AgBr is 2.75, 2.69, 2.65, 2.63 and 2.53 eV, respectively. This indicates that Br doping influence the energy band position of as-prepared catalysts. Fig. 2b displays the N2 adsorption–desorption isotherms of as-prepared catalysts. All the catalysts exhibit type IV isotherm. The specific surface area (SBET) of GCN, AgBr and AgBr/GCN(1
3) and AgBr is 2.75, 2.69, 2.65, 2.63 and 2.53 eV, respectively. This indicates that Br doping influence the energy band position of as-prepared catalysts. Fig. 2b displays the N2 adsorption–desorption isotherms of as-prepared catalysts. All the catalysts exhibit type IV isotherm. The specific surface area (SBET) of GCN, AgBr and AgBr/GCN(1![[thin space (1/6-em)]](https://www.rsc.org/images/entities/char_2009.gif) :
:![[thin space (1/6-em)]](https://www.rsc.org/images/entities/char_2009.gif) 3), calculated by the BET method, are 9.5, 13.2 and 10.9 m2 g−1, respectively. In the case of AgBr/Br(1
3), calculated by the BET method, are 9.5, 13.2 and 10.9 m2 g−1, respectively. In the case of AgBr/Br(1![[thin space (1/6-em)]](https://www.rsc.org/images/entities/char_2009.gif) :
:![[thin space (1/6-em)]](https://www.rsc.org/images/entities/char_2009.gif) 4)–GCN(1
4)–GCN(1![[thin space (1/6-em)]](https://www.rsc.org/images/entities/char_2009.gif) :
:![[thin space (1/6-em)]](https://www.rsc.org/images/entities/char_2009.gif) 3), its SBET is 11.4 m2 g−1, very close to that of AgBr/GCN(1
3), its SBET is 11.4 m2 g−1, very close to that of AgBr/GCN(1![[thin space (1/6-em)]](https://www.rsc.org/images/entities/char_2009.gif) :
:![[thin space (1/6-em)]](https://www.rsc.org/images/entities/char_2009.gif) 3). This hints Br doping does not influence the SBET of catalyst.
3). This hints Br doping does not influence the SBET of catalyst.
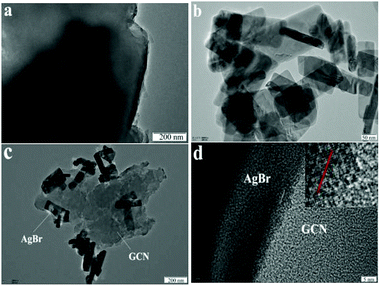
The morphologies of the representative samples were examined by TEM analysis. As shown in Fig. 3a, GCN shows sheet-like structure with no regular morphology. The morphology for AgBr is nanorod, as shown in Fig. 3b. In the case of AgBr/Br(1![[thin space (1/6-em)]](https://www.rsc.org/images/entities/char_2009.gif) :
:![[thin space (1/6-em)]](https://www.rsc.org/images/entities/char_2009.gif) 4)–GCN(1
4)–GCN(1![[thin space (1/6-em)]](https://www.rsc.org/images/entities/char_2009.gif) :
:![[thin space (1/6-em)]](https://www.rsc.org/images/entities/char_2009.gif) 3) (Fig. 3c), both plate-like structural GCN and AgBr nanorod are observed, confirming the presence of both GCN and AgBr. The two-dimensional ordering of GCN is very weak and hard to find the lattice fringe in HRTEM image (Fig. 3d). This is consistent with previous work.18 However, the clear lattice fringe is observed for AgBr, very close to the (400) crystal face with the d = 0.143 nm (Fig. 3d). This tight coupling is favorable for the charge transfer between GCN and AgBr and promotes the separation rate of electron–hole pairs.
3) (Fig. 3c), both plate-like structural GCN and AgBr nanorod are observed, confirming the presence of both GCN and AgBr. The two-dimensional ordering of GCN is very weak and hard to find the lattice fringe in HRTEM image (Fig. 3d). This is consistent with previous work.18 However, the clear lattice fringe is observed for AgBr, very close to the (400) crystal face with the d = 0.143 nm (Fig. 3d). This tight coupling is favorable for the charge transfer between GCN and AgBr and promotes the separation rate of electron–hole pairs.
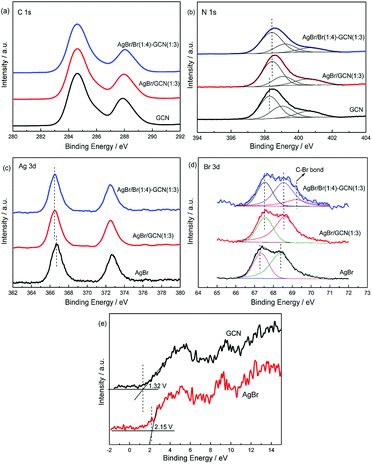
XPS spectra are used to investigate the structure of the as-prepared catalysts. In Fig. 4a, the spectra of three catalysts in C 1s region can be fitted with two contributions which located at 284.6 and 288.6 eV. The sharp peak around 284.6 eV is attributed to the pure graphitic species in the CN matrix. The peak with binding energy of 288.6 eV indicates the presence of sp2 C atoms bonded to aliphatic amine (–NH2 or –NH–) in the aromatic rings.24–26 For N 1s region (Fig. 4b), three contributions located at 398.3, 399 and 400.5 eV were assigned to the sp2 hybridized aromatic nitrogen atoms bonded to carbon atoms (C–N![[double bond, length as m-dash]](https://www.rsc.org/images/entities/char_e001.gif) C), tertiary nitrogen N–(C)3 groups linking structural motif or amino groups carrying hydrogen ((C)2–N–H) in connection with structural defects and incomplete condensation, and nitrogen atoms bonded three carbon atoms in the aromatic cycles.27,28 For AgBr/GCN(1
C), tertiary nitrogen N–(C)3 groups linking structural motif or amino groups carrying hydrogen ((C)2–N–H) in connection with structural defects and incomplete condensation, and nitrogen atoms bonded three carbon atoms in the aromatic cycles.27,28 For AgBr/GCN(1![[thin space (1/6-em)]](https://www.rsc.org/images/entities/char_2009.gif) :
:![[thin space (1/6-em)]](https://www.rsc.org/images/entities/char_2009.gif) 3) and AgBr/Br(1
3) and AgBr/Br(1![[thin space (1/6-em)]](https://www.rsc.org/images/entities/char_2009.gif) :
:![[thin space (1/6-em)]](https://www.rsc.org/images/entities/char_2009.gif) 4)–GCN(1
4)–GCN(1![[thin space (1/6-em)]](https://www.rsc.org/images/entities/char_2009.gif) :
:![[thin space (1/6-em)]](https://www.rsc.org/images/entities/char_2009.gif) 3), the obvious shifts to higher binding energies are observed in N 1s region compared with that of neat GCN. This is probably due to the change of chemical environment after coupling with AgBr.
3), the obvious shifts to higher binding energies are observed in N 1s region compared with that of neat GCN. This is probably due to the change of chemical environment after coupling with AgBr.
 | ||
| Fig. 4 XPS of as-prepared catalysts in the C 1s (a), N 1s (b), Ag 3d (c), Br 3d (d) and VB XPS (e) regions. | ||
In Fig. 4c, AgBr displays Ag 3d spectrum with two peaks at 366.8 eV and 372.8 eV, corresponding to the binding energies of Ag 3d5/2 and Ag 3d3/2 of Ag+ in AgBr, respectively.29 In Br 3d region (Fig. 4d), the peaks at ∼67.5 and 68.3 eV for AgBr are assigned to the Br 3d5/2 and Br 3d3/2 of Br− state.30 For AgBr/GCN(1![[thin space (1/6-em)]](https://www.rsc.org/images/entities/char_2009.gif) :
:![[thin space (1/6-em)]](https://www.rsc.org/images/entities/char_2009.gif) 3), the binding energies shift obviously in both Ag 3d and Br 3d regions compared with neat AgBr, which confirms the strong interaction between AgBr and GCN. AgBr/Br(1
3), the binding energies shift obviously in both Ag 3d and Br 3d regions compared with neat AgBr, which confirms the strong interaction between AgBr and GCN. AgBr/Br(1![[thin space (1/6-em)]](https://www.rsc.org/images/entities/char_2009.gif) :
:![[thin space (1/6-em)]](https://www.rsc.org/images/entities/char_2009.gif) 4)–GCN(1
4)–GCN(1![[thin space (1/6-em)]](https://www.rsc.org/images/entities/char_2009.gif) :
:![[thin space (1/6-em)]](https://www.rsc.org/images/entities/char_2009.gif) 3) displays the same peak position with AgBr/GCN(1
3) displays the same peak position with AgBr/GCN(1![[thin space (1/6-em)]](https://www.rsc.org/images/entities/char_2009.gif) :
:![[thin space (1/6-em)]](https://www.rsc.org/images/entities/char_2009.gif) 3) in both Ag 3d and Br 3d regions. Moreover, a new peak at 69.4 eV is observed for AgBr/Br(1
3) in both Ag 3d and Br 3d regions. Moreover, a new peak at 69.4 eV is observed for AgBr/Br(1![[thin space (1/6-em)]](https://www.rsc.org/images/entities/char_2009.gif) :
:![[thin space (1/6-em)]](https://www.rsc.org/images/entities/char_2009.gif) 4)–GCN(1
4)–GCN(1![[thin space (1/6-em)]](https://www.rsc.org/images/entities/char_2009.gif) :
:![[thin space (1/6-em)]](https://www.rsc.org/images/entities/char_2009.gif) 3). This binding energy should be assigned to the C–Br bond, which confirming that Br is doped into g-C3N4 lattice.31 The VB XPS spectra were employed to determine the electronic structure (Fig. 4e). It is obvious to see that the VB potentials for GCN and AgBr locate at +1.32 and +2.15 V. They are very close to the previous results.5,18 Combined with the UV-Vis results, the energy position of CB for GCN and AgBr locate at −1.43 and −0.38 V respectively. Obviously, the band structures of the two components are well-matched with each other. This facilitates the formation of heterojunction for charge transfer.
3). This binding energy should be assigned to the C–Br bond, which confirming that Br is doped into g-C3N4 lattice.31 The VB XPS spectra were employed to determine the electronic structure (Fig. 4e). It is obvious to see that the VB potentials for GCN and AgBr locate at +1.32 and +2.15 V. They are very close to the previous results.5,18 Combined with the UV-Vis results, the energy position of CB for GCN and AgBr locate at −1.43 and −0.38 V respectively. Obviously, the band structures of the two components are well-matched with each other. This facilitates the formation of heterojunction for charge transfer.
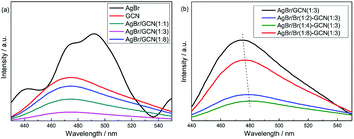
Fig. 5 shows the PL spectra of as-prepared catalysts under air atmosphere using excitation at 255 nm. For GCN (Fig. 5a), broad PL band around 460 nm is observed with the energy of light approximately equal to the band gap of g-C3N4. AgBr exhibits several emission peaks which intensities are higher than that of GCN. In the case of as-prepared heterojunction catalysts, the PL spectra show the similar shape to that of GCN, whereas the intensities are obviously decreased. AgBr/GCN(1![[thin space (1/6-em)]](https://www.rsc.org/images/entities/char_2009.gif) :
:![[thin space (1/6-em)]](https://www.rsc.org/images/entities/char_2009.gif) 3) shows the lowest PL intensity, hinting its most effective separation rate of electrons and holes. This is reasonable because, with this GCN/AgBr mass ratio, GCN and AgBr have the approximate SBET (9.5 and 13.2 m2 g−1 for GCN and AgBr, the yield for GCN is approximately 50 wt%). They can contact with each other as much as possible, leading to the formation of the maximum area of the heterojunction.
3) shows the lowest PL intensity, hinting its most effective separation rate of electrons and holes. This is reasonable because, with this GCN/AgBr mass ratio, GCN and AgBr have the approximate SBET (9.5 and 13.2 m2 g−1 for GCN and AgBr, the yield for GCN is approximately 50 wt%). They can contact with each other as much as possible, leading to the formation of the maximum area of the heterojunction.
In Fig. 5b, it is shown that, compared with AgBr/GCN(1![[thin space (1/6-em)]](https://www.rsc.org/images/entities/char_2009.gif) :
:![[thin space (1/6-em)]](https://www.rsc.org/images/entities/char_2009.gif) 3), the PL intensity is sharply decreased for AgBr/Br(1
3), the PL intensity is sharply decreased for AgBr/Br(1![[thin space (1/6-em)]](https://www.rsc.org/images/entities/char_2009.gif) :
:![[thin space (1/6-em)]](https://www.rsc.org/images/entities/char_2009.gif) 2)–GCN(1
2)–GCN(1![[thin space (1/6-em)]](https://www.rsc.org/images/entities/char_2009.gif) :
:![[thin space (1/6-em)]](https://www.rsc.org/images/entities/char_2009.gif) 3) and AgBr/Br(1
3) and AgBr/Br(1![[thin space (1/6-em)]](https://www.rsc.org/images/entities/char_2009.gif) :
:![[thin space (1/6-em)]](https://www.rsc.org/images/entities/char_2009.gif) 4)–GCN(1
4)–GCN(1![[thin space (1/6-em)]](https://www.rsc.org/images/entities/char_2009.gif) :
:![[thin space (1/6-em)]](https://www.rsc.org/images/entities/char_2009.gif) 3), accompanying with the obvious red-shift. This is probably due to that the doping Br atoms can induce strong spin–orbit interaction in GCN and result in the conversion of singlet-excited GCN into triplet-excited GCN. For AgBr/Br(1
3), accompanying with the obvious red-shift. This is probably due to that the doping Br atoms can induce strong spin–orbit interaction in GCN and result in the conversion of singlet-excited GCN into triplet-excited GCN. For AgBr/Br(1![[thin space (1/6-em)]](https://www.rsc.org/images/entities/char_2009.gif) :
:![[thin space (1/6-em)]](https://www.rsc.org/images/entities/char_2009.gif) 8)–GCN(1
8)–GCN(1![[thin space (1/6-em)]](https://www.rsc.org/images/entities/char_2009.gif) :
:![[thin space (1/6-em)]](https://www.rsc.org/images/entities/char_2009.gif) 3), its PL intensity is much higher than that of AgBr/Br(1
3), its PL intensity is much higher than that of AgBr/Br(1![[thin space (1/6-em)]](https://www.rsc.org/images/entities/char_2009.gif) :
:![[thin space (1/6-em)]](https://www.rsc.org/images/entities/char_2009.gif) 2)–GCN(1
2)–GCN(1![[thin space (1/6-em)]](https://www.rsc.org/images/entities/char_2009.gif) :
:![[thin space (1/6-em)]](https://www.rsc.org/images/entities/char_2009.gif) 3) and AgBr/Br(1
3) and AgBr/Br(1![[thin space (1/6-em)]](https://www.rsc.org/images/entities/char_2009.gif) :
:![[thin space (1/6-em)]](https://www.rsc.org/images/entities/char_2009.gif) 4)–GCN(1
4)–GCN(1![[thin space (1/6-em)]](https://www.rsc.org/images/entities/char_2009.gif) :
:![[thin space (1/6-em)]](https://www.rsc.org/images/entities/char_2009.gif) 3), but still lower than AgBr/GCN(1
3), but still lower than AgBr/GCN(1![[thin space (1/6-em)]](https://www.rsc.org/images/entities/char_2009.gif) :
:![[thin space (1/6-em)]](https://www.rsc.org/images/entities/char_2009.gif) 3). Such PL quenching is possible due to the non-radiative transition.
3). Such PL quenching is possible due to the non-radiative transition.
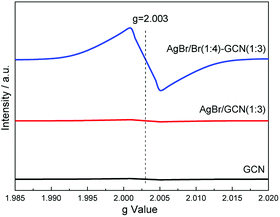
Room temperature electron paramagnetic resonance (EPR) was used to investigate the electronic property of the as-prepared catalysts. As shown in Fig. 6, GCN shows almost no EPR signal. After coupling with AgBr, the sample also displays no EPR signal for AgBr/GCN(1![[thin space (1/6-em)]](https://www.rsc.org/images/entities/char_2009.gif) :
:![[thin space (1/6-em)]](https://www.rsc.org/images/entities/char_2009.gif) 3). However, AgBr/Br(1
3). However, AgBr/Br(1![[thin space (1/6-em)]](https://www.rsc.org/images/entities/char_2009.gif) :
:![[thin space (1/6-em)]](https://www.rsc.org/images/entities/char_2009.gif) 4)–GCN(1
4)–GCN(1![[thin space (1/6-em)]](https://www.rsc.org/images/entities/char_2009.gif) :
:![[thin space (1/6-em)]](https://www.rsc.org/images/entities/char_2009.gif) 3) shows one single Lorentzian line centering at a g = 2.003, being originated from unpaired electrons on π-conjugated g-C3N4 aromatic rings after Br doping. This is probably due to that the delocalization of the valance electron of Br in the g-C3N4 conjugation system can widen the band distribution, which improves the charge migration.15 This is consistent with the PL result.
3) shows one single Lorentzian line centering at a g = 2.003, being originated from unpaired electrons on π-conjugated g-C3N4 aromatic rings after Br doping. This is probably due to that the delocalization of the valance electron of Br in the g-C3N4 conjugation system can widen the band distribution, which improves the charge migration.15 This is consistent with the PL result.
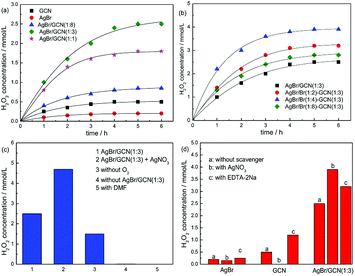
Fig. 7 displays the photocatalytic H2O2 production ability over as-prepared catalysts. It is clearly seen that the H2O2 concentration of as-prepared catalyst increases with time for about 5 h when it reaches a constant level. This level corresponds to the steady-state where the rate of H2O2 production is equal to the rate of decomposition.32 In Fig. 7a, GCN and AgBr display the H2O2 concentration of 0.5 and 0.2 mmol L−1. In the case of as-prepared heterojunction catalyst, the H2O2 production ability promotes obviously. After Br doping, the photocatalytic performance of as-prepared samples further increase, as shown in Fig. 7b. This is due to that the introduction of heteroatoms into the π-conjugated g-C3N4 can accelerate the charge carriers transfer rate and thus restrain the recombination of electron and hole. AgBr/Br(1![[thin space (1/6-em)]](https://www.rsc.org/images/entities/char_2009.gif) :
:![[thin space (1/6-em)]](https://www.rsc.org/images/entities/char_2009.gif) 4)–GCN(1
4)–GCN(1![[thin space (1/6-em)]](https://www.rsc.org/images/entities/char_2009.gif) :
:![[thin space (1/6-em)]](https://www.rsc.org/images/entities/char_2009.gif) 3) shows the highest H2O2 equilibrium concentration of 3.9 mmol L−1, which is 7.8 and 19.5 times higher than that of GCN and AgBr. The excess Br doping causes the decreased H2O2 production ability of AgBr/Br(1
3) shows the highest H2O2 equilibrium concentration of 3.9 mmol L−1, which is 7.8 and 19.5 times higher than that of GCN and AgBr. The excess Br doping causes the decreased H2O2 production ability of AgBr/Br(1![[thin space (1/6-em)]](https://www.rsc.org/images/entities/char_2009.gif) :
:![[thin space (1/6-em)]](https://www.rsc.org/images/entities/char_2009.gif) 8)–GCN(1
8)–GCN(1![[thin space (1/6-em)]](https://www.rsc.org/images/entities/char_2009.gif) :
:![[thin space (1/6-em)]](https://www.rsc.org/images/entities/char_2009.gif) 3). This is probably due to that the excess doping Br acts as recombination sites to accelerate the recombination of electrons and holes, which is consistent with PL result.
3). This is probably due to that the excess doping Br acts as recombination sites to accelerate the recombination of electrons and holes, which is consistent with PL result.
Fig. 7c shows the H2O2 production ability of AgBr/GCN(1![[thin space (1/6-em)]](https://www.rsc.org/images/entities/char_2009.gif) :
:![[thin space (1/6-em)]](https://www.rsc.org/images/entities/char_2009.gif) 3) under different reaction conditions. The addition of AgNO3 (10 mmol L−1) as an electron scavenger should suppress the H2O2 production ability. However, interestingly, the H2O2 production ability of AgBr/GCN(1
3) under different reaction conditions. The addition of AgNO3 (10 mmol L−1) as an electron scavenger should suppress the H2O2 production ability. However, interestingly, the H2O2 production ability of AgBr/GCN(1![[thin space (1/6-em)]](https://www.rsc.org/images/entities/char_2009.gif) :
:![[thin space (1/6-em)]](https://www.rsc.org/images/entities/char_2009.gif) 3) increases to 4.7 mmol L−1 when AgNO3 is added. Still 1.5 mmol L−1 H2O2 is obtained in the absence of O2. These results indicate that H2O2 is not only produced by O2 reduction over AgBr/GCN(1
3) increases to 4.7 mmol L−1 when AgNO3 is added. Still 1.5 mmol L−1 H2O2 is obtained in the absence of O2. These results indicate that H2O2 is not only produced by O2 reduction over AgBr/GCN(1![[thin space (1/6-em)]](https://www.rsc.org/images/entities/char_2009.gif) :
:![[thin space (1/6-em)]](https://www.rsc.org/images/entities/char_2009.gif) 3). The detailed explanation is given below. The H2O2 concentration is trivial in the absence of photocatalyst, indicating that H2O2 is produced via a photocatalytic process. No H2O2 is generated when using dimethylformamide (DMF, aprotic solvent) instead of water, confirming that H2O is necessary as the proton source for H2O2 production.
3). The detailed explanation is given below. The H2O2 concentration is trivial in the absence of photocatalyst, indicating that H2O2 is produced via a photocatalytic process. No H2O2 is generated when using dimethylformamide (DMF, aprotic solvent) instead of water, confirming that H2O is necessary as the proton source for H2O2 production.
| h+ + OH− → ·OH | (3) |
| ·OH + ·OH → H2O2 | (4) |
Besides the O2 reduction to form H2O2, another channel to produce H2O2 is reported by Dong et al.33 It is reported that photogenerated holes can oxidize OH− to ·OH thermodynamically, as shown in reaction (3). Two ·OH can form H2O2 though combination with each other, as shown in reaction (4). In order to investigate the reaction mechanism of as-prepared heterojunction catalyst, the influence of various scavengers on the H2O2 production ability is carried out and shown in Fig. 7d. AgNO3 and EDTA-2Na are used as the electrons (e−) and hole (h+) scavenger, respectively.34 When AgNO3 is added to trap the electrons, H2O2 is still formed with the concentration of 0.15 mmol L−1 over AgBr. It is known that the redox potential for ·OH/OH− is +1.99 V.35 Whereas the VB of AgBr is +2.15 V. The VB holes in AgBr is positive enough to generate ·OH. Therefore, H2O2 should be produced by reaction (4). When EDTA-2Na is added to trap the holes, although the utilization rate of electrons is promoted, the H2O2 equilibrium concentration is only increased to 0.45 mmol L−1 over AgBr. This is probably due to the poor reduction ability of CB electrons over AgBr. In the case of GCN, the CB and VB positions are −1.43 V and +1.32 V, respectively. Thus, when AgNO3 is added, no H2O2 is produced due to that the VB holes in g-C3N4 are not positive enough to generate ·OH. Without any doubt, the H2O2 production ability of g-C3N4 is obviously promoted by adding EDTA-2Na to trap the holes.
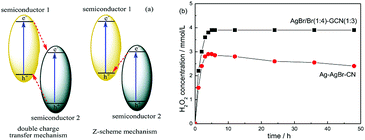
In general, there are two typical working mechanisms for heterojunction catalyst, double charge transfer mechanism and Z-scheme mechanism, as shown in Fig. 8a.36–38 If AgBr/GCN(1![[thin space (1/6-em)]](https://www.rsc.org/images/entities/char_2009.gif) :
:![[thin space (1/6-em)]](https://www.rsc.org/images/entities/char_2009.gif) 3) catalyst follows the double charge transfer mechanism, holes should be transferred to the VB of GCN. When CB electrons is trapped by AgNO3, VB holes in GCN are not positive enough to generate ·OH. Thus H2O2 should be not produced. However, the H2O2 with the concentration of 3.9 mmol L−1 is formed over AgBr/GCN(1
3) catalyst follows the double charge transfer mechanism, holes should be transferred to the VB of GCN. When CB electrons is trapped by AgNO3, VB holes in GCN are not positive enough to generate ·OH. Thus H2O2 should be not produced. However, the H2O2 with the concentration of 3.9 mmol L−1 is formed over AgBr/GCN(1![[thin space (1/6-em)]](https://www.rsc.org/images/entities/char_2009.gif) :
:![[thin space (1/6-em)]](https://www.rsc.org/images/entities/char_2009.gif) 3) when AgNO3 is added. Similarly, if AgBr/GCN(1
3) when AgNO3 is added. Similarly, if AgBr/GCN(1![[thin space (1/6-em)]](https://www.rsc.org/images/entities/char_2009.gif) :
:![[thin space (1/6-em)]](https://www.rsc.org/images/entities/char_2009.gif) 3) follows the double charge transfer mechanism, the electrons should be transferred to the CB of AgBr. The H2O2 production ability should be low by adding EDTA-2Na to trap the holes because of the poor reduction ability of CB electrons over AgBr. Whereas, the H2O2 equilibrium concentration over AgBr/GCN(1
3) follows the double charge transfer mechanism, the electrons should be transferred to the CB of AgBr. The H2O2 production ability should be low by adding EDTA-2Na to trap the holes because of the poor reduction ability of CB electrons over AgBr. Whereas, the H2O2 equilibrium concentration over AgBr/GCN(1![[thin space (1/6-em)]](https://www.rsc.org/images/entities/char_2009.gif) :
:![[thin space (1/6-em)]](https://www.rsc.org/images/entities/char_2009.gif) 3) is promoted to 3.2 mmol L−1 when EDTA-2Na is added. Based on the above results, it is deduced that not double charge transfer mechanism but Z-scheme mechanism with “two channel pathway” is proposed. Under visible light irradiation, the photogenerated electron–hole pairs are formed in both components. The electrons in the CB of AgBr combine with the holes in the VB of GCN at the interface of the heterojunction. Therefore, the holes tend to stay in the VB of AgBr and the electrons accumulate in the CB of GCN, leading to the enhanced separation rate of electron–hole pairs. The CB electrons in GCN can reduce O2 to form H2O2, as well as the VB holes in AgBr can oxidize OH− to form ·OH, which subsequently react with each other to form H2O2. Such “two channel pathway” causes the remarkably promoted H2O2 production ability. When AgNO3 (or EDTA-2Na) is added to trap the electrons (or holes), the separation efficiency of catalyst is promoted, leading to the enhanced H2O2 production ability (Fig. 7d).
3) is promoted to 3.2 mmol L−1 when EDTA-2Na is added. Based on the above results, it is deduced that not double charge transfer mechanism but Z-scheme mechanism with “two channel pathway” is proposed. Under visible light irradiation, the photogenerated electron–hole pairs are formed in both components. The electrons in the CB of AgBr combine with the holes in the VB of GCN at the interface of the heterojunction. Therefore, the holes tend to stay in the VB of AgBr and the electrons accumulate in the CB of GCN, leading to the enhanced separation rate of electron–hole pairs. The CB electrons in GCN can reduce O2 to form H2O2, as well as the VB holes in AgBr can oxidize OH− to form ·OH, which subsequently react with each other to form H2O2. Such “two channel pathway” causes the remarkably promoted H2O2 production ability. When AgNO3 (or EDTA-2Na) is added to trap the electrons (or holes), the separation efficiency of catalyst is promoted, leading to the enhanced H2O2 production ability (Fig. 7d).
In order to prove the advance of this AgBr–Br–GCN heterojunction catalyst, Ag–AgBr–CN was prepared according to the previous work.18 Fig. 8b compares the photocatalytic H2O2 production ability of AgBr/Br(1![[thin space (1/6-em)]](https://www.rsc.org/images/entities/char_2009.gif) :
:![[thin space (1/6-em)]](https://www.rsc.org/images/entities/char_2009.gif) 4)–GCN(1
4)–GCN(1![[thin space (1/6-em)]](https://www.rsc.org/images/entities/char_2009.gif) :
:![[thin space (1/6-em)]](https://www.rsc.org/images/entities/char_2009.gif) 3) and Ag–AgBr–CN. Ag–AgBr–CN shows the H2O2 concentration of 2.9 mmol L−1, much lower than that of AgBr/Br(1
3) and Ag–AgBr–CN. Ag–AgBr–CN shows the H2O2 concentration of 2.9 mmol L−1, much lower than that of AgBr/Br(1![[thin space (1/6-em)]](https://www.rsc.org/images/entities/char_2009.gif) :
:![[thin space (1/6-em)]](https://www.rsc.org/images/entities/char_2009.gif) 4)–GCN(1
4)–GCN(1![[thin space (1/6-em)]](https://www.rsc.org/images/entities/char_2009.gif) :
:![[thin space (1/6-em)]](https://www.rsc.org/images/entities/char_2009.gif) 3). In addition, the H2O2 production ability for AgBr/Br(1
3). In addition, the H2O2 production ability for AgBr/Br(1![[thin space (1/6-em)]](https://www.rsc.org/images/entities/char_2009.gif) :
:![[thin space (1/6-em)]](https://www.rsc.org/images/entities/char_2009.gif) 4)–GCN(1
4)–GCN(1![[thin space (1/6-em)]](https://www.rsc.org/images/entities/char_2009.gif) :
:![[thin space (1/6-em)]](https://www.rsc.org/images/entities/char_2009.gif) 3) keeps stable after 48 h reaction. Whereas, the activity for Ag–AgBr–CN decreases obviously with increasing the reaction time, hinting its poor photocatalytic stability. The element analysis and ICP results indicate that the content of each element in the AgBr/Br(1
3) keeps stable after 48 h reaction. Whereas, the activity for Ag–AgBr–CN decreases obviously with increasing the reaction time, hinting its poor photocatalytic stability. The element analysis and ICP results indicate that the content of each element in the AgBr/Br(1![[thin space (1/6-em)]](https://www.rsc.org/images/entities/char_2009.gif) :
:![[thin space (1/6-em)]](https://www.rsc.org/images/entities/char_2009.gif) 4)–GCN(1
4)–GCN(1![[thin space (1/6-em)]](https://www.rsc.org/images/entities/char_2009.gif) :
:![[thin space (1/6-em)]](https://www.rsc.org/images/entities/char_2009.gif) 3) remains almost unchanged before and after the reaction. However, for Ag–AgBr–CN, the Ag content decreases obviously (Br content does not change). This indicates the metal silver is not sturdy on the catalyst surface, which is probably lost during the reaction.
3) remains almost unchanged before and after the reaction. However, for Ag–AgBr–CN, the Ag content decreases obviously (Br content does not change). This indicates the metal silver is not sturdy on the catalyst surface, which is probably lost during the reaction.
Conclusions
In this work, a two-component modified AgBr–Br–g-C3N4 composite catalyst with outstanding photocatalytic H2O2 production ability is synthesized. Modification with Br and AgBr does not change the structural property of g-C3N4 but decreases the band gap and increases the visible light absorption. The formation of heterojunction with AgBr and introduction of heteroatoms Br into the π-conjugated g-C3N4 can accelerate the charge carriers transfer rate and thus restrain the recombination of electron and hole. AgBr/Br(1![[thin space (1/6-em)]](https://www.rsc.org/images/entities/char_2009.gif) :
:![[thin space (1/6-em)]](https://www.rsc.org/images/entities/char_2009.gif) 4)–GCN(1
4)–GCN(1![[thin space (1/6-em)]](https://www.rsc.org/images/entities/char_2009.gif) :
:![[thin space (1/6-em)]](https://www.rsc.org/images/entities/char_2009.gif) 3) shows the highest H2O2 equilibrium concentration of 3.9 mmol L−1, which is 7.8 and 19.5 times higher than that of GCN and AgBr. According to “Z-scheme” mechanism, not only the CB electrons of GCN reduce O2 to form H2O2, but the VB holes in AgBr can oxidize OH− to form ·OH, which subsequently react with each other to form H2O2. Such “two channel pathway” causes the remarkably promoted H2O2 production ability. In addition, compared with another two-component modified catalyst, Ag–AgBr–g-C3N4, AgBr/Br(1
3) shows the highest H2O2 equilibrium concentration of 3.9 mmol L−1, which is 7.8 and 19.5 times higher than that of GCN and AgBr. According to “Z-scheme” mechanism, not only the CB electrons of GCN reduce O2 to form H2O2, but the VB holes in AgBr can oxidize OH− to form ·OH, which subsequently react with each other to form H2O2. Such “two channel pathway” causes the remarkably promoted H2O2 production ability. In addition, compared with another two-component modified catalyst, Ag–AgBr–g-C3N4, AgBr/Br(1![[thin space (1/6-em)]](https://www.rsc.org/images/entities/char_2009.gif) :
:![[thin space (1/6-em)]](https://www.rsc.org/images/entities/char_2009.gif) 4)–GCN(1
4)–GCN(1![[thin space (1/6-em)]](https://www.rsc.org/images/entities/char_2009.gif) :
:![[thin space (1/6-em)]](https://www.rsc.org/images/entities/char_2009.gif) 3) displays the higher photocatalytic H2O2 production ability and stability.
3) displays the higher photocatalytic H2O2 production ability and stability.
Conflicts of interest
There are no conflicts to declare.Notes and references
- J. M. Campos-Martin, G. Blanco-Brieva and J. L. G. Fierro, Angew. Chem., Int. Ed., 2007, 45, 6962–6984 CrossRef.
- C. Samanta, Appl. Catal., A, 2008, 350, 133–149 CrossRef CAS.
- S. Yamazaki, Z. Siroma, H. Senoh, T. Ioroi, N. Fujiwara and K. Yasuda, J. Power Sources, 2008, 178, 20–25 CrossRef CAS.
- S. A. M. Shaegh, N. T. Nguyen, S. M. M. Ehteshami and S. H. Chan, Energy Environ. Sci., 2012, 5, 8225–8228 RSC.
- S. Z. Hu, X. Chen, Q. Li, F. Y. Li, Z. P. Fan, H. Wang, Y. J. Wang, B. H. Zheng and G. Wu, Appl. Catal., B, 2017, 201, 58–69 CrossRef CAS.
- S. Z. Hu, X. Y. Qu, J. Bai, P. Li, Q. Li, F. Wang and L. J. Song, ACS Sustainable Chem. Eng., 2017, 5, 6863–6872 CrossRef CAS.
- S. N. Li, G. H. Dong, R. Hailili, L. P. Yang, Y. X. Li, F. Wang, Y. B. Zeng and C. Y. Wang, Appl. Catal., B, 2016, 190, 26–35 CrossRef CAS.
- Y. Feng, J. C. Shen, Q. F. Cai, H. Yang and Q. H. Shen, New J. Chem., 2015, 39, 1132–1138 RSC.
- L. Liu, Y. H. Qi, J. Y. Yang, W. Q. Cui, X. G. Li and Z. S. Zhang, Appl. Surf. Sci., 2015, 358, 319–327 CrossRef CAS.
- T. T. Li, Y. M. He, H. J. Lin, J. Cai, L. Z. Dong, X. X. Wang, M. F. Luo, L. H. Zhao, X. D. Yi and W. Z. Weng, Appl. Catal., B, 2013, 138–139, 95–103 CrossRef CAS.
- Y. M. He, J. Cai, T. T. Li, Y. Wu, H. J. Lin, L. H. Zhao and M. F. Luo, Chem. Eng. J., 2013, 215–216, 721–730 CrossRef CAS.
- S. Y. Yang, W. Y. Zhou, C. Y. Ge, X. T. Liu, Y. P. Fang and Z. S. Li, RSC Adv., 2013, 3, 5631–5638 RSC.
- Z. Feng, L. Zeng, Y. J. Chen, Y. Y. Ma, C. R. Zhao, R. S. Jin, Y. Lu, Y. Wu and Y. M. He, J. Mater. Res., 2017, 32, 3660–3668 CrossRef CAS.
- Z. Wan, G. K. Zhang, X. Y. Wu and S. Yin, Appl. Catal., B, 2017, 207, 17–26 CrossRef CAS.
- Z. A. Lan, G. G. Zhang and X. C. Wang, Appl. Catal., B, 2016, 192, 116–125 CrossRef CAS.
- Y. Y. Bu, Z. Y. Chen and W. B. Li, Appl. Catal., B, 2014, 144, 622–630 CrossRef CAS.
- Y. L. Wang, M. Z. Xia, K. B. Li, X. L. Shen, T. Muhanmood and F. Y. Wang, Phys. Chem. Chem. Phys., 2016, 18, 27257–27264 RSC.
- D. M. Chen, Z. H. Wang, Y. Du, G. L. Yang, T. Z. Ren and H. Ding, Catal. Today, 2015, 258, 41–48 CrossRef CAS.
- Y. Wang, Y. Di, M. Antonietti, H. R. Li, X. F. Chen and X. C. Wang, Chem. Mater., 2010, 22, 5119–5121 CrossRef CAS.
- Y. Ding, W. Zhao, H. Hu and B. C. Ma, Green Chem., 2008, 10, 910–913 RSC.
- M. Saha, M. Das, R. Nasani, I. Choudhuri, M. Yousufuddin, H. P. Nayek, M. M. Shaikh, B. Pathak and S. Mukhopadhyay, Dalton Trans., 2015, 44, 20154–20167 RSC.
- X. C. Wang, K. Maeda, A. Thomas, K. Takanabe, G. Xin, K. Domen and M. Antonietti, Nat. Mater., 2009, 8, 76–80 CrossRef CAS.
- B. Oregan and M. Gratzel, Nature, 1991, 353, 737–740 CrossRef CAS.
- B. Chai, T. Y. Peng, J. Mao, K. Li and L. Zan, Phys. Chem. Chem. Phys., 2012, 14, 16745–16752 RSC.
- L. Ge and C. Han, Appl. Catal., B, 2012, 117/118, 268–274 CrossRef.
- W. Lei, D. Portehault, R. Dimova and M. Antoniettit, J. Am. Chem. Soc., 2011, 133, 7121–7127 CrossRef CAS.
- Z. X. Ding, X. F. Chen, M. Antonietti and X. C. Wang, Chemsuschem, 2011, 4, 274–281 CAS.
- Y. W. Zhang, J. H. Liu, G. Wu and W. Chen, Nanoscale, 2012, 4, 5300–5303 RSC.
- J. Jiang, H. Li and L. Z. Zhang, Chem.–Eur. J., 2012, 18, 6360–6369 CrossRef CAS.
- S. L. Lin, L. Liu, J. S. Hu, Y. H. Liang and W. Q. Cui, Appl. Surf. Sci., 2015, 324, 20–29 CrossRef CAS.
- A. Basagni, L. Ferrighi, M. Cattelan, L. Nicolas, K. Handrup, L. Vaghi, A. Papagni, F. Sedona, C. D. Valentin, S. Agnoli and M. Sambi, Chem. Commun., 2015, 51, 12593–12596 RSC.
- M. Teranishi, S. Naya and H. Tada, J. Am. Chem. Soc., 2010, 132, 7850–7851 CrossRef CAS.
- L. P. Yang, G. H. Dong, D. L. Jacobs, Y. H. Wang, L. Zang and C. Y. Wang, J. Catal., 2017, 352, 274–281 CrossRef CAS.
- S. Q. Zhang, Y. X. Yang, Y. N. Guo, W. Guo, M. Wang, Y. H. Guo and M. X. Huo, J. Hazard. Mater., 2013, 261, 235–245 CrossRef CAS.
- G. Liu, P. Niu, L. C. Yin and H. M. Cheng, J. Am. Chem. Soc., 2012, 134, 9070–9073 CrossRef CAS.
- K. Kondo, N. Murakami, C. Ye, T. Tsubota and T. Ohno, Appl. Catal., B, 2013, 142/143, 362–367 CrossRef.
- Y. M. He, L. H. Zhang, B. T. Teng and M. H. Fan, Environ. Sci. Technol., 2015, 49, 649–656 CrossRef CAS.
- Y. M. He, L. H. Zhang, M. H. Fan, X. X. Wang, M. L. Walbridge, Q. Y. Nong, Y. Wu and L. H. Zhao, Sol. Energy Mater. Sol. Cells, 2015, 137, 175–184 CrossRef CAS.
| This journal is © The Royal Society of Chemistry 2018 |

