DOI:
10.1039/C8RA07721E
(Paper)
RSC Adv., 2018,
8, 39710-39720
Isolation and characterization of biosurfactant-producing and diesel oil degrading Pseudomonas sp. CQ2 from Changqing oil field, China
Received
17th September 2018
, Accepted 20th November 2018
First published on 27th November 2018
Abstract
In the present research investigation, 13 indigenous bacteria (from CQ1 to CQ13) were isolated from soil collected from Changqing oil field of Xi'an, China. Four promising biosurfactant producers (CQ1, CQ2, CQ4, and CQ13) were selected through primary screening among these 13 strains, including via drop collapse and oil-spreading methods. However, only the strain CQ2 showed the best biosurfactant production and was further screened by hemolytic assay, cetyl trimethyl ammonium bromide (CTAB), surface tension and emulsifying activity. The bacterium CQ2 has the ability to produce about 3.015 g L−1 of biosurfactant using glucose as the sole carbon source without any optimization. The produced biosurfactant could greatly reduce surface tension from 72.66 to 24.72 mN m−1 with a critical micelle concentration (CMC) of 30 mg L−1 and emulsify diesel oil up to 60.1%. The cell-free broth was found to be stable in wide temperature (4–100 °C), pH (6–12) and salinity (2–20%) ranges for surface and emulsifying activity. This biosurfactant was preliminarily found to be of a glycolipid nature as evident from thin-layer chromatographic (TLC) and Fourier transform infra-red spectroscopic (FTIR) analyses. Moreover, CQ2 was able to degrade 54.7% of diesel oil, which surprisingly could form a substantial amount of bioflocculants during the degradation process. Furthermore, the 16S rDNA sequence using the Genbank BLAST tool revealed that isolated CQ2 was closely related to species of Pseudomonas genus and, thus, was entitled Pseudomonas sp. CQ2. The results of residual diesel oil contents measured by GC-MS showed that C7–C28 hydrocarbons could be degraded by Pseudomonas sp. CQ2. Thus, these findings revealed that CQ2 could be applied for remediation of diesel oil/petroleum-contaminated waters and soils on a large scale.
1. Introduction
Petroleum hydrocarbon contamination (PHC) is an alarming environmental issue, arising from industrialization. PHCs are usually derived from accidental spills, uncontrolled landfill, improper storage or leaking of underground storage tanks.1 Petroleum contains many toxic and harmful components, such as benzene, ethylbenzene, toluene, xylene and polycyclic aromatic hydrocarbons (PAHs),2–5 which have a great impact on the ecological environment and can cause great harm to human beings, such as growth retardation, metabolic disturbance, hormonal imbalance, and malignant tumors.6 As compared to physical and chemical remediation techniques, biological methods are attracting greater attention because they are environmentally-friendly, cost-effective and efficient.7,8 Biological methods are utilizing living organisms to detoxify pollutants. Such microorganisms could mitigate, degrade or reduce petroleum hydrocarbons to innocuous compounds such as CO2, CH4, H2O and biomass without adversely affecting the environment.9,10 Presently, the substantial effect of indigenous microorganisms applied to hydrocarbon degradation has been reported frequently.7,11,12 However, the lower bioavailability of petroleum hydrophobic organics (PHOS) to microorganisms would limit the biodegradation. The addition of surfactants to biodegradation systems at a concentration above their CMC values could reduce the surface tension and increase the solubility and bioavailability of PHOS, which boosts the biodegradation.13 Very few research investigations are available. Bezza and Chirwa14 used biosurfactants produced by bacterial consortium to biodegrade PAHs contaminated soil. Whang et al.15 applied biosurfactants, rhamnolipid, and surfactin to deal with the diesel-contaminated water and soil. Chirwa et al.16 utilized biosurfactant-producing bacteria to assist disposal of C5–C11 hydrocarbons of oily sludge. Another research group also worked with biosurfactant-producing bacterium Pseudozyma sp. NII 08165 or its culture broth to deal with the crude oil.17
Surfactants are chemicals and are divided into two groups, that is, synthetics and biosurfactants. Mainly belonging to the amphiphilic compounds, surfactants can reduce surface and interfacial tensions by accumulating at the interface immiscible fluids.16 The surface area of hydrophobic contaminants in soil or water can be increased by adding surfactants, which can also enhance aqueous solubility, and, consequently, the microbial degradation would also be increased.18 Furthermore, when chemical surfactants are used, secondary pollution will occur because of its residue, and the stability of temperature, pH and salinity of the chemical surfactant is not so good. Biosurfactants are more suitable for practical petroleum pollution remediation than chemical surfactants because of their biodegradability, environmental compatibility, higher ability to produce foaming, lower toxicity and greater stability under extreme conditions.19 In fact, biosurfactants are produced by a variety of microorganisms, which are either adhered to the cell surface or excreted extracellularly in the growth culture medium.20 Some Researchers have reported that biosurfactant-producing bacteria also possess hydrocarbon degradation abilities.21–23 Thus, the present study is designed to accomplish following core objectives: (i) to isolate an efficient biosurfactant-producing bacterial strain from diesel-contaminated soil samples collected from Changqing oil-field, China; (ii) to characterize and identify the isolated bacterial strains; (iii) to examine the properties of biosurfactants produced by the isolated bacterial strain; (iv) to estimate diesel oil degradation potential by the isolated bacterial strains and determine degradation components using GC-MS.
2. Materials and methods
2.1 Samples and materials
The petroleum-contaminated soil samples were collected from the surface layers (0–15 cm depth) of the Changqing oil field of Xian, China, located at a latitude of 36°50′71′′N and a longitude of 40°50′3′′E. The soil samples were stored in sterile wide-necked bottles at 4 °C until further use. Diesel oil used in this study was purchased from a gas station of Sinopec, China.
2.2 Enrichment and isolation
5 g of soil was inoculated into 100 mL sterilized minimal salt medium (MSM) containing 2% (v/v) diesel oil poured into a 250 mL conical flask and cultured at 35 ± 1 °C, 180 rpm for 7 days. The formula of MSM was followed as described in the literature.13 The MSM was sterilized at 121 °C for 20 min and the diesel oil was filtered by a 0.22 μm Millipore membrane. Then 5 mL of the first culture was transferred to a 100 mL fresh enrichment medium and cultured at the same conditions. After five (05) consecutive cycles of enrichment, the bacteria isolation was conducted by the enrichment culture solution with the surface tension less than 40 mN m−1 and the biosurfactant producing bacteria would be screened. 180 μL of enrichment suspension dilutions (up to 10−n) were spread on the Luria-Bertani agar plate. Thereafter, the strains of different morphologies were selected and screened to be the biosurfactant-producers. The isolated strains were conserved in 30% (v/v) glycerol at −80 °C for further use.
2.3 Screening of biosurfactant producing isolates
2.3.1 Primary screening.
2.3.1.1 Drop collapse method (DCM). The culture broth was centrifuged at 8000 rpm for 20 min and then filtered through a 0.22 μm Millipore membrane filter to obtain cell-free supernatant (CFS). DCM was carried out for evaluation of the biosurfactant activity, according to Sam et. al.24 Briefly, if the droplets are in a flat shape when the drops drip onto the seal film, the reactions are positive. But if the droplets are in a spherical shape, the reactions are negative.
2.3.1.2 Oil-spreading method (OSM). The oil-spreading test was also performed as described by Sam et al.24 Briefly, approximately 30 mL of the distilled water was poured into a Petri dish of 150 mm diameter, and then 30 μL of diesel oil was spread on the water surface forming a thin oil layer. About 10 μL of CFS was spotted on the center of the oil layer surface, gently, and the diameter of the oil-spreading area was measured.
2.3.2 Secondary screening.
2.3.2.1 Hemolytic assay (HA). After incubation for 36 h, the culture broth was spread on a blood agar plate and cultured in a constant incubator at 35 °C overnight. The indication of yellow transparent zones around colonies suggested the hemolysis of blood cells. No change in the color on the blood agar plates indicated the absence of hemolysis.
2.3.2.2 Cetyl trimethyl ammonium bromide (CTAB) agar test. First, a 50 mm diameter circle was cut in the CTAB-methylene agar plate, and then 20 μL of CFS was placed in the pre-cut circles. The plate was cultured at 35 °C, and the appearance of dark blue halo zones indicated a positive result with biosurfactant production.25
2.3.2.3 Emulsification activity test. The emulsification index (E24) is used to characterize the emulsifying activity of the biosurfactant. Two milliliters of CFS and diesel oil were injected into a 15 mL test tube and then vortexed vigorously for 5 min. The test tube was placed vertically at room temperature without disturbance for 24 h. The E24 is calculated according to Zhang et al.,26 as follows;
| E24 = (Height of the emulsification layer/total height of mixture) × 100% |
2.3.2.4 Surface tension (ST) measurement. Surface tension is an important parameter for evaluating surface activity. The surface tension of CFS was measured with an automatic digital surface tensiometer (BZY-2, Hengping, Shanghai, China) at room temperature, according to the principle of the Du Noüy ring method.27 About 10 mL of the measured sample is put into the sample pool, and the height of the sample pool is adjusted so that the platinum sheet is immersed under the liquid surface of the sample. The height of the sample pool is adjusted then, when the platinum plate has just left the liquid level, the value displayed is the surface tension of the sample. The non-inoculated medium was regarded as the control. All surface tension readings were taken in triplicates.
2.4 Molecular identification
DNA of the strain CQ2 was extracted by using a Roche kit (High Pure PCR Template Preparation Kit, Roche Applied Science, Germany). Then PCR analysis was carried out with two sets of universal primers: 27F (5′-AGA GTT TGA TCC TGG CTC AG)/1492R (5′-TAC GGT TAC CTT GTT ACG ACTT).28 A PCR reaction mixture (25 μL) containing 100 μM dNTP, 1.5 μM MgCl2, 1 × Taq buffer, 0.1 μM of each primer, and 1.5 U Taq DNA polymerase (MBI, USA) was amplified. The program was as followed: calefaction at 95 °C for 5 min, 35 cycles of denaturation at 95 °C for 30 s, annealing at 54 °C for 30 s, and 72 °C for 90 s and then a final extension step consisting of 72 °C for 10 min. The PCR products, which were stored at 4 °C, were loaded on a 1% agarose gel and examined by electrophoresis. The PCR products were sent to the Tsingke company (Qingdao, P. R. China) for 16S rDNA sequencing. The sequences were input in the NCBI site for blast, and the most homologous strains were identified. Multiple sequence alignment was performed using CLUSTAL W and finally, a phylogenetic tree was constructed using the neighbor-joining method.29 The phylogenetic tree was constructed using MEGA version 7.0.
2.5 Biosurfactant production kinetics
Biosurfactant production kinetics of Pseudomonas sp. CQ2 was determined by measuring biosurfactant yield, emulsification and surface activities at different contact times. First, the strain CQ2 preserved in the ultra-low temperature refrigerator was activated, and inoculated in the LB medium at 35 ± 1 °C, 180 rpm for 12 h. The bacterial culture was transferred into a sterile centrifuge tube and centrifuged at 3500 rpm for 5 min, and then the supernatant was discarded. The sterile deionized water was added to the centrifuge tube to make the suspension. The prepared suspension (optical density at 600 nm was 1.0, OD 600 1.0) was inoculated into a Bushnell Hass (BH) medium with 1% (w/v) glucose as carbon source. The BH medium contained (g L−1): KH2PO4 (1.0), K2HPO4 (1.0), NH4NO3 (1.0), MgSO4·7H20 (0.2), FeCl3 (0.05), and CaCl2 (0.02). The initial pH was 7.0. The biosurfactant yield, E24, surface tension, oil-spreading diameter and OD 600 were determined at 0, 12, 24, 36, 48, 60, 72, 84, 96, 108 and 120 h, respectively. The biosurfactant production yield was measured as described by Varjani et al.17,30 Crude biosurfactant was dried overnight in an oven at 70 °C and was measured gravimetrically. The oil-spreading diameter, E24 and surface tension were measured as explained in Section 2.3.1.2, 2.3.2.3 and 2.3.2.4.
2.6 Determination of critical micelle concentration (CMC)
The surface tension is often reduced with an increase in biosurfactant concentration and a sharp decrease appears at CMC. The CMC could be obtained by protracting the curve of surface tension at different concentrations following the protocol of Radzuan et al.31
2.7 Determination of the stability of surface activity and emulsification activity
The surface activity stability of CFS was determined by estimating the surface tension and emulsification index (E24) at different conditions, such as pH, temperature and salinity. The test tubes were placed at different temperatures of 4, 25, 50, 70 and 100 °C for 30 min, respectively, and then placed under room temperature. The different values of pH 2, 4, 6, 8, 10 and 12 of CFS were adjusted by using 1 N HCl or 1 N NaOH solution. Various concentrations of salinity, such as 0, 2, 4, 6, 8, 10 and 12%, were adjusted by adding different amounts of sodium chloride. Finally, the surface tension and emulsification index of the prepared test tubes were measured.
2.8 Extraction of the biosurfactant
The biosurfactant was produced by Pseudomonas sp. CQ2 under aerobic fermentation conditions at 35 °C and 180 rpm for 96 h. The CFS was acidified by adding 6 N HCl, and the pH was adjusted to 2, then placed at 4 °C overnight. Thereafter, CFS was centrifuged at 8000 rpm for 20 min to get the precipitation. The biosurfactant in the precipitation and supernatant was extracted by using a chloroform–methanol (2![[thin space (1/6-em)]](https://www.rsc.org/images/entities/char_2009.gif) :
:![[thin space (1/6-em)]](https://www.rsc.org/images/entities/char_2009.gif) 1, v/v) mixture. The aqueous layer was extracted several times and the organic layer was collected. The crude biosurfactant was obtained using a rotary evaporator under a vacuum.
1, v/v) mixture. The aqueous layer was extracted several times and the organic layer was collected. The crude biosurfactant was obtained using a rotary evaporator under a vacuum.
2.9 Characterization of the biosurfactant
2.9.1 Thin-layer chromatography (TLC). In order to confirm the composition of the biosurfactant, the purified biosurfactant was detected by TLC on silica gel plates (G60; Merck, Germany). The extracted biosurfactant was dissolved in methanol, then sucked by a glass capillary and spotted on the plate. The TLC solvent was mixed by chloroform: methanol: acetic acid (65![[thin space (1/6-em)]](https://www.rsc.org/images/entities/char_2009.gif) :
:![[thin space (1/6-em)]](https://www.rsc.org/images/entities/char_2009.gif) 15
15![[thin space (1/6-em)]](https://www.rsc.org/images/entities/char_2009.gif) :
:![[thin space (1/6-em)]](https://www.rsc.org/images/entities/char_2009.gif) 2, v/v/v), and the chromogenic agent compositions were as follows: (1) exposure to the reagent prepared by mixing 100 mL acetic acid, 2 mL sulfuric acid and 1 mL p-anisaldehyde for the sugar moieties detection; (2) exposure to iodine vapour for lipids; (3) exposure to 1% ninhydrin reagent for the detection of free amino groups, and the plates were heated at 110 °C for 5 min until glassy brown spots appeared.32
2, v/v/v), and the chromogenic agent compositions were as follows: (1) exposure to the reagent prepared by mixing 100 mL acetic acid, 2 mL sulfuric acid and 1 mL p-anisaldehyde for the sugar moieties detection; (2) exposure to iodine vapour for lipids; (3) exposure to 1% ninhydrin reagent for the detection of free amino groups, and the plates were heated at 110 °C for 5 min until glassy brown spots appeared.32
2.9.2 Fourier transform infra-red spectroscopy (FTIR). FTIR analysis of the biosurfactant produced by Pseudomonas sp. CQ2 was carried out on a Bruker Vertex 70 FTIR spectrophotometer by the KBr pellet method.33 Approximately 2 mg of the lyophilized biosurfactant was grinded with 100 mg of KBr in a mortar and pressed with a load into a pellet for several seconds. The scan wavelength range was from 400 to 4000 cm−1. The IR spectra was analysed by using OPUS 3.1 (Bruker Optics) software.
2.10 Evaluation of the diesel oil degradation potential
2.10.1 Degradation rate determination by using gravimetric method. The biodegradation rate of diesel oil was measured by a gravimetric method.24 First, the activated bacterium (OD600 1.0) was inoculated to the 100 mL of BH medium containing 2% (v/v) diesel oil in a 250 mL flask. The degradation conditions were 35 ± 1 °C and 180 rpm for two weeks. After 14 days of incubation, the culture broth was filtered with non-absorbent cotton to separate the oil from the growth medium. The diesel oil intercepted in the cotton and left in the flask was extracted with hexane. The anhydrous sodium sulphate was added to remove moisture. N-Hexane was removed by the rotary evaporator under vacuum. The quality of the diesel oil before and after degradation was weighed by the precision balance (MS-TS, METTLER TOLEDO, Zurich, Switzerland). The formula for the degradation rate is as followed:
| Degradation rate = (m0 − mi)/m0 × 100% |
where, m0 is the quality of diesel oil before degradation and mi is the quality of diesel oil before degradation.
2.10.2 Gas chromatography–mass spectrometric (GC-MS) analysis. One milliliter of control diesel and extracted residual diesel oil degraded by Pseudomonas sp. CQ2 was packed in chromatographic bottles for GC-MS analysis. The components of n-alkanes in the diesel oil were detected by a SCION-456 gas chromatography device. Nitrogen was used as the carrier gas, and the gas flow rate was 1 mL min−1. The injector type was S/SL. The injector and detector temperature was 320 °C. One microliter of diesel dissolved in dichloromethane (DCM) was automatically sampled. The column temperature program was kept at 35 °C for 5 min and then increased at the rate of 7 °C per min to 300 °C for 15 min. The formula used for calculating the content of n-alkanes in diesel oil is as followed:
| Content of n-alkanes = PA/PA′ × Mi |
where, PA is the peak area of n-alkanes in sample solutions; PA′ is the whole peak area of the sample solutions; Mi is the weight of the detected diesel oil. The n-alkanes degradation rate was calculated using following equation:
| n-alkanes degradation rate (%) = (C0 − Ci)/C0 × 100% |
where, C0 is the content of n-alkanes in the control diesel oil and Ci is the content of n-alkanes in the residual diesel oil.
2.11 Statistical analysis
All the results are expressed as the mean ± standard error (SE), the parallel experiments were repeated three times. Analyses were performed by STATISTICA 10.0 software (StatSoft Inc., Tulsa, Oklahoma, USA). Graphs were prepared using Origin 8.0 (OriginLab, MA, USA).
3. Results and discussions
3.1 Isolation, identification and screening of biosurfactant-producing bacteria
A total of 13 strains of bacteria (CQ1, CQ2, CQ3, CQ4, CQ5, CQ6, CQ7, CQ8, CQ9, CQ10, CQ11, CQ12 and CQ13) were isolated from the petroleum-polluted soil in the Changqing oil field. Primary and secondary tests were carried out for screening biosurfactant producers from these 13 isolated bacteria. Primary screening experiments include the drop collapse method (DCM) and the oil-spreading method (OSM). DCM relies on the basis that as the surface tension between the droplet and the sealing film reduces, the droplets on the film would collapse. So, if the droplets are flat in shape, the reactions are positive while if the droplets are spherical in shape, the reactions are negative.34 As biosurfactants have the ability of oil displacement, if there are biosurfactants produced, it will form an oil spreading circle on the oil film.35 Four isolates (CQ1, CQ2, CQ4, and CQ13) showed positive results in the initial biosurfactant-production screening assays as indicated in Table 1. Further screening tests were conducted on these four strains. In 1996, P. G. Carrillo et al.36 found the blood agar plate could be used to screen biosurfactant producing bacteria, and this method was widely applied to various biosurfactant producing bacteria screenings. CTAB agar test is a specific way to detect anionic surfactants. The test is based on the fact that anionic surfactants in aqueous solutions can be determined by formation of an insoluble ion pair with various cationic substances.37 All these four strains are positive for HA and CTAB tests (Table 2). Moreover, there was very obvious hemolytic phenomenon (almost transparent) when CQ2 culture broth was spread on a blood agar plate (Fig. 1). The hemolysis of biosurfactants may be because that biosurfactant molecules and phospholipid bilayers on cell membranes form the mixed micelles, resulting in the fracture of cell membranes.38 Therefore, the stronger the hemolysis is, the higher the surface activity of biosurfactants is. Therefore, this phenomenon indicated the formation of the excellent biosurfactant produced by CQ2. Emulsifying activity is an important property for the performance of biosurfactants. E24 is a parameter to measure the emulsifying ability. The E24 of CQ2 is the highest among the four strains, which could reach up to 61.5 ± 1.07%. Cooper et al.39 reported that the surface tension could be reduced to less than 40 mN m−1, which might be a promising biosurfactant producer. These four strains all could reduce the surface tension to less than 40 mN m−1, while the least the surface tension could be reduced to is 24.67 ± 0.53 mN m−1 by CQ2. From the above results, it could be concluded that the strain CQ2 is the best biosurfactant producer from all the isolated strains. Furthermore, the strain CQ2 could surprisingly produce excessive foam, with the medium turning to black in the process of fermentation (Fig. 2). Similar phenomenon has been reported during the biosurfactant production by strain P. aeruginosa MR01.40 Some studies have indicated that the foaming action of biosurfactants was related to their ability to reduce the surface tension of liquids. The lower the surface tension, the stronger the foaming effect.41,42
Table 1 Primary screening of biosurfactant producersa
| |
CQ1 |
CQ2 |
CQ3 |
CQ4 |
CQ5 |
CQ6 |
CQ7 |
CQ8 |
CQ9 |
CQ10 |
CQ11 |
CQ12 |
CQ13 |
| Key: DCM: (—) completely spherical; (+) flat; (++) moderately flat; (+++) completely flat. OSM: (—) no displacement; (+) 3 cm < the diameter < 5 cm; (++) 5 cm < the diameter < 7 cm; (+++) 7 cm < the diameter < 9 cm; (++++) 9 cm < the diameter. |
| DCM |
++ |
+++ |
+ |
+++ |
— |
+ |
— |
— |
— |
— |
— |
+ |
+++ |
| OSM |
+++ |
++++ |
+ |
+++ |
— |
— |
— |
+ |
— |
+ |
— |
— |
+++ |
Table 2 Secondary screening of biosurfactant producersa
| Isolates |
HA |
CTAB |
OSM (cm) |
E24 (%) |
SF (mN m−1) |
| Key: Results are expressed as the mean ± standard error (SE) of three independent experiments. |
| CQ1 |
+ |
+ |
7.9 ± 1.21 |
45.7 ± 1.17 |
30.23 ± 1.72 |
| CQ2 |
+ |
+ |
11.7 ± 0.67 |
61.5 ± 1.07 |
24.67 ± 0.53 |
| CQ4 |
+ |
+ |
8.8 ± 1.42 |
56.8 ± 0.53 |
31.56 ± 0.96 |
| CQ13 |
+ |
+ |
8.5 ± 0.89 |
52.4 ± 2.16 |
27.47 ± 1.84 |
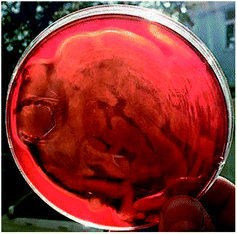 |
| | Fig. 1 Pseudomonas sp. CQ2 grown on the blood agar plate after incubation at 35 °C for 36 h. | |
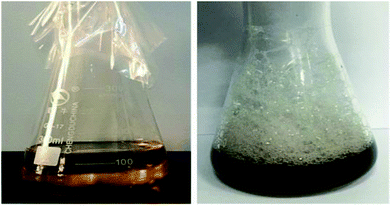 |
| | Fig. 2 Excessive foam produced by Pseudomonas sp. CQ2. Left: un-inoculated control; right: Pseudomonas sp. CQ2 grown in the glucose-containing BH medium. | |
3.2 Molecular identification
The 16S rDNA sequence of the isolate CQ2 has been submitted to the Genbank database under the accession number MG742217. The results of 16S rDNA sequence using the Genbank BLAST tool revealed that the isolate CQ2 was closely related to the species of Pseudomonas genus and showed 100% similarity to Pseudomonas aeruginosa. Accordingly, the bacterium was entitled Pseudomonas sp. CQ2. The 16S rRNA sequence of strain CQ2 was aligned automatically to the reference sequences submitted to the Genbank by MEGA version 7.0, and a phylogenetic tree was constructed (Fig. 3).
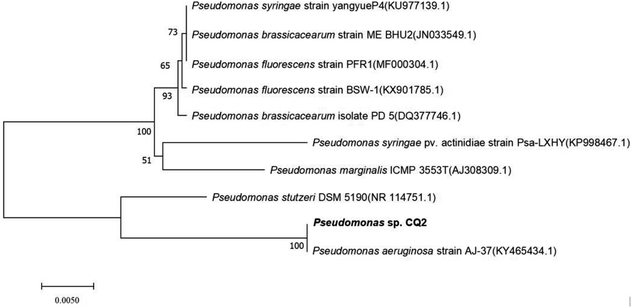 |
| | Fig. 3 Consensus neighbor-joining phylogenetic tree of Pseudomonas sp. CQ2 based on 16S rRNA gene sequences. | |
3.3 Determination of the critical micelle concentration (CMC)
CMC is the lowest concentration of surfactant molecules associating micelles, which is a crucial parameter to the biosurfactant.43 Upon reaching the CMC, the surface tension remains unchanged due to the surfactant molecule saturation at the interface.44 The surface tension varying with the biosurfactant concentrations is shown in Fig. 4. The curve shows that the surface tension decreased rapidly from 72.66 to 24.72 mN m−1 at a concentration of 30 mg L−1, and the surface tension remained almost constant while the concentration of biosurfactant increased, indicating that the CMC value is 30 mg L−1. The smaller the CMC, the lower the saturated concentration adsorbed on the surface. That is to say, the surfactants possessed higher adsorption forces and surface activities.43 The value of CMC obtained in this study was less than those biosurfactants reported by various investigators.32,45 Furthermore, the CMC value for CQ2 could bear comparison with those for common chemical surfactants, such as Tritone X-100, Tween 20, and Tween 80, whose values vary from 16 to 110 mg L−1.46–49
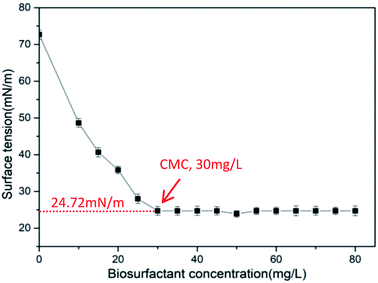 |
| | Fig. 4 Variation of surface tension at different concentrations of biosurfactant produced by Pseudomonas sp. CQ2. | |
3.4 Stability analysis of the biosurfactant
The stability of biosurfactant under different conditions directly influences its application to environmental and other fields. In this study, pH, temperature and salinity were selected to investigate whether the surface and emulsification activities affected the stability. As shown in Fig. 5(A), there was a negligible influence on the surface tension and E24 under a wide range of temperatures (4–100 °C). The surface tension rapidly increased at pH values from 6 to 2 as depicted in Fig. 5(B), while a sharp decrease in emulsifying property was observed at a pH value of less than 6. Meanwhile, the surface tension and E24 were hardly altered in the pH range of 6–12. The salinity (0–20%) stability was tested, and the results illustrated that the performance of biosurfactant was less affected by the salinity, as shown in Fig. 5(C). In general, the biosurfactant produced by Pseudomonas sp. has good stability, regardless of extreme temperature, salinity and pH conditions. At present, many saline-alkali lands are contaminated by petroleum.50 Moreover, the soils in cold areas are polluted by oil.51,52 Therefore, under such extreme conditions, the excellent stability of biosurfactants produced by CQ2 can be advantageous to its application in the remediation of oil pollution.
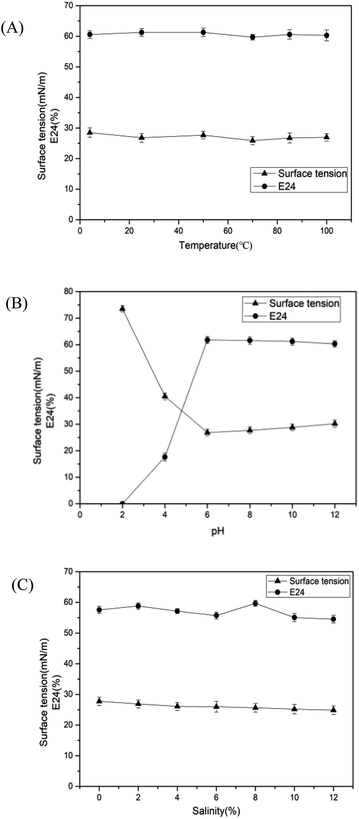 |
| | Fig. 5 Stability of the surface activity and emulsification ability of biosurfactant produced by Pseudomonas sp. CQ2 under different conditions, (A) temperature; (B) pH and (C) salinity. | |
3.5 Biosurfactant production kinetics of Pseudomonas sp. CQ2
The biosurfactant was produced by Pseudomonas sp. CQ2 in glucose containing mineral salt medium under aerobic conditions. The evolution of cell growth, surface activities and biosurfactant production are shown in Fig. 6. The surface tension reached a minimum value of 24.4 from 72.68 mN m−1 at 60 h during the stationary phase, and subsequently remained almost constant until the end of fermentation. The parameters E24 and oil-spreading diameter were increased rapidly in the exponential growth phase and remained almost constant in the stationary phase. The maximum yield of biosurfactant with glucose as carbon source was 3.015 g L−1 at the stationary phase of bacterial growth while the parameters, such as surface tension, E24 and the diameter of the oil-spreading circle, were almost unchanged with the biosurfactant production synchronously.
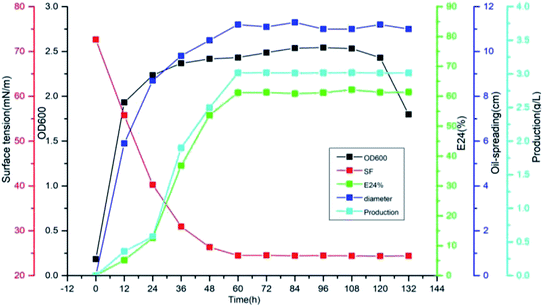 |
| | Fig. 6 The emulsifying property, surface tension, diameter of the oil-spreading area and production of biosurfactant by Pseudomonas sp. CQ2 cultivated in the BH medium with 1% (w/v) glucose as the carbon source at 35 °C at different fermentation times. | |
Pseudomonas sp. CQ2 could produce 3.015 g L−1 biosurfactants utilizing glucose as the substrate. This yield is higher than that of many other biosurfactant producers with glucose as the substrate. For example, Bacillus sp. produced 1–2.46 g L−1 at initial glucose concentrations of 10–70 g L−1.53 The production yield of Pseudomonas aeruginosa TMN was 0.3 g L−1 taking glucose as the substrate.54 Numerous water-soluble and hydrophobic carbon sources could be used as substrates for producing biosurfactants. The glucose and glycerol are the most important substrates that have been widely reported for biosurfactant production among all the water-soluble carbon sources.55,56 The vegetable oils, such as sunflower, peanut, corn, coconut, palm, soybean and olive oil, have been extensively utilized for biosurfactant production.57–59 Reports indicated that the yield of biosurfactant was greatly affected by fermentation substrates.60 Not only the substrates, but also the fermentation conditions will improve the production.61 So, in order to achieve higher production, the fermentation substrate and conditions will be effectively optimized.
3.6 Preliminary identification of biosurfactant chemical structure
The chemical component characteristic of the biosurfactant was evaluated using TLC. The result of TLC analysis (Fig. 7) revealed that two yellow spots emerged after being sprayed with the p-anisaldehyde reagent, whose Rf values were 0.53 and 0.85, respectively, demonstrating the presence of sugar moieties. Additionally, there was a positive reaction of iodine vapors, indicating the presence of lipids. There were no spots viewed when sprayed with ninhydrin, suggesting the absence of amino acids. These TLC results indicated that the biosurfactant via fermentation when grown on the glucose was of glycolipid nature.32 The molecular composition of the freeze dried biosurfactant produced by strain CQ2 was evaluated by FTIR (Fig. 7). The stretching peak at 3610.5 and 3327.2 cm−1 suggested the presence of the hydroxyl group. The presence of an aliphatic chain was demonstrated by the –CH2 and –CH3 stretching mode at 2933.5 cm−1. There were strong absorption peaks at 1731.9 and 1404.1 cm−1 directing the occurrence of ester groups, while, the absorption peak at 1058.8 cm−1 indicated the presence of polysaccharides or polysaccharide-like substance. Based on the above results, the produced biosurfactant was associated with a glycolipid nature.35
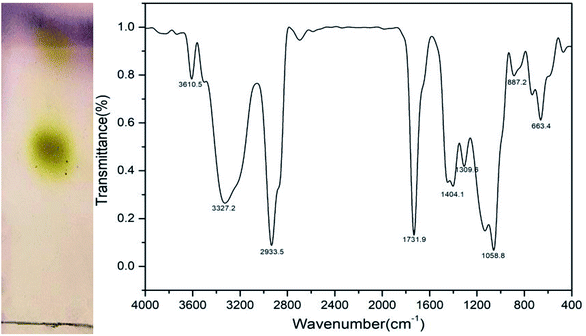 |
| | Fig. 7 Left: thin-layer chromatography (TLC) analysed by exposure to a p-anisaldehyde reagent; right: Fourier transform infrared spectrum (FTIR) of lyophilized biosurfactant produced by Pseudomonas sp. CQ2 cultivated in 1% (w/v) glucose-containing BH medium. | |
3.7 Diesel oil degradation
The diesel oil hydrocarbon biodegradation rates of four biosurfactant-producers (CQ1, CQ2, CQ4 and CQ13) were tested by the gravimetric method. After 14 days of incubation, four strains degraded 2% diesel oil by 52.74 ± 0.27 to 55.72 ± 0.37% (Fig. 8). The diesel oil degradation of the four isolates after 2 weeks of incubation is shown in Fig. 9. The diesel oil in the blank flask was hardly degraded while floating on the achromatous and transparent medium. In comparison, there was very few oil left when inoculated bacteria, meanwhile, many white granular substances were floating on the culture broth or sticking to the bottle wall. Su et al.62 previously reported that the similar phenomena occurred in the process of motor oil degradation by Pseudomonas aeruginosa SU-1, this white particles may be bioflocculants. The strain CQ2 also belonged to Pseudomonas aeruginosa according to the results of 16S rDNA sequencing, so we speculated that these white granular substances produced were also bioflocculants. In the next step, we will isolate and identify this white granular substances, and analyze its role in diesel oil degradation in depth.
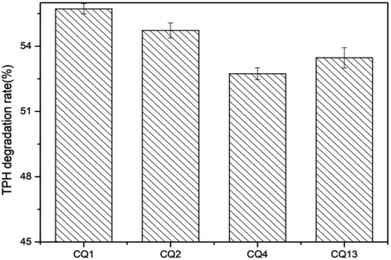 |
| | Fig. 8 The total petroleum hydrocarbon (TPH) degradation rate of isolates CQ1, CQ2, CQ4 and CQ13, respectively, inoculated in 2% diesel oil (v/v). | |
 |
| | Fig. 9 The diesel oil degradation by isolated bacterial strains for 14 days of incubation, (A) control, (B) CQ1, (C) CQ2, (D) CQ4, and (E) CQ13. | |
The degradation rate of CQ2 could reach up to 54.73 ± 0.43%, just inferior to CQ1. Therefore, CQ2 is not only the best biosurfactant producer, but also a good hydrocarbon degrader. Analysis of n-alkane degradation of diesel oil by Pseudomonas sp. CQ2 was investigated using GC-MS. Fig. 11 illustrates total ion currents (TIC) of diesel oil biodegradation before and after for 2 weeks of inoculation. Almost all the n-alkanes had been biodegraded in this time. Lower alkanes C7–C11 were biodegraded completely, and removal rates for different hydrocarbon components were observed (Fig. 10). Among various hydrocarbon components of diesel oil, the lowest biotic removal (15.46%) was noticed for C28, and the highest biodegradation rates (81.87–89.48%) were observed for C12–C14 and C17 hydrocarbons. The biotic removal for C15, C16, C18, and C21–C25 was in the range of 49.88–76.47% (Fig. 10). Studies showed that the degradation degree of different hydrocarbons in diesel oil was related closely to its molecular structure and the degradation rate declined when the molecular structure became complicated.63–65 The general trend of n-alkane degradation by Pseudomonas sp. CQ2 is that the degradation rate is gradually decreased with the increasing carbon numbers of n-alkane, which is consistent with this statement. In addition, many studies have indicated that bacteria are always preferentially degrading the short-chain components in diesel oil. By degrading and assimilating the short-chain components first, bacteria can grow and proliferate, which makes the degradation rates of short-chain alkanes higher. At the same time, more hydrolytic enzymes could be secreted to degrade complicated components, but during this process, toxic intermediate products will be produced, hindering continued degradation, result in the low degradation rates of long chain n-alkanes.66,67 Moreover, the hydrocarbon degradation process of microorganisms was controlled by an enzymatic reaction, and the enzymes controlling the reaction vary with the length of carbon chain.68 It is also possible that the amount of enzyme expression that control hydrocarbons with different carbon chains in bacteria is different. Overall, the more carbon numbers of n-alkanes in diesel oil, the lower the degradation rates by Pseudomonas sp. CQ2.
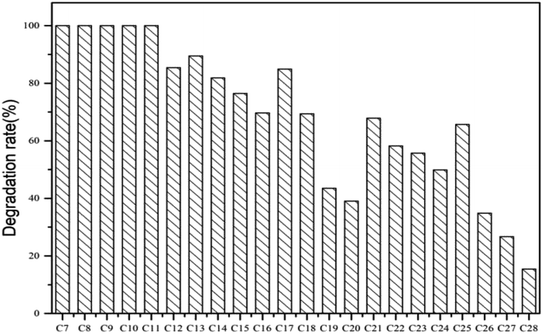 |
| | Fig. 10 Degradation rates of n-alkane in diesel oil by Pseudomonas sp. CQ2 incubated in BH medium at 35 °C, 180 rpm for 14 days. | |
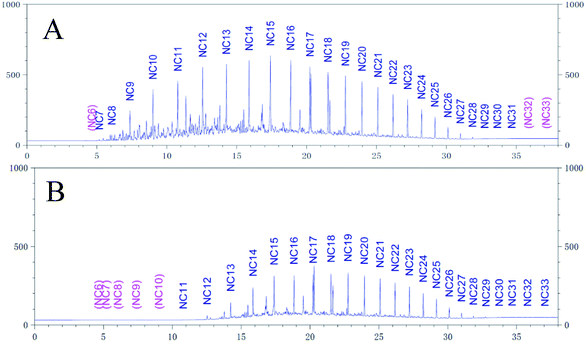 |
| | Fig. 11 Total ion currents (TIC) of GC-MS before (A) and after (B) degradation by Pseudomonas sp. CQ2. | |
4. Conclusions
Four strains of bacteria have been screened out to produce biosurfactants and degrade diesel oil from petroleum-contaminated soil samples of the Changqing oil field, China. Through biosurfactant screening experiments, including primary screening and secondary screening tests, and diesel oil degradation experiments, it can be concluded that CQ2 is the best biosurfactant-producer and diesel oil-degrader. Therefore, the properties of biosurfactant production and hydrocarbon biodegradation by Pseudomonas sp. CQ2 were investigated in detail. The results showed that: (1) the strain CQ2 could produce about 3.015 g L−1 of biosurfactant using glucose as the sole carbon source without any optimization. The biosurfactant could reduce surface tension from 72.66 to 24.72 mN m−1 with a critical micelle concentration (CMC) of 30 mg L−1 and emulsify 60.1% of diesel oil. The biosurfactant was found to be stable even at a wide range of temperatures (4–100 °C), pH (6–12) and salinity (2–20%) for surface and emulsification activity. The biosurfactant was preliminarily characterized to be a glycolipid nature as evident by TLC and FT-IR analyses. (2) Pseudomonas sp. CQ2 could degrade diesel oil with the degradation rate up to 54.73%, which surprisingly could produce the excessive bioflocculant during the degradation process, and GC-MS showed that C7–C28 hydrocarbons could be biodegraded by CQ2. Moreover, the degradation rates of short chains are higher than that of long chains. In view of the excellent performance in biosurfactant production and diesel oil degradation, Pseudomonas sp. CQ2 showed a promising application prospect in the remediation of petroleum hydrocarbon contaminations (PHCs).
Author contributions
All authors contributed to the analysis of data and preparation of the manuscript.
Conflicts of interest
The authors declare no conflict of interest.
Acknowledgements
The authors acknowledge the support of the State Key Laboratory of Environmental Criteria and Risk Assessment (SKLECRA2013FP12), the Shandong Province Key Research and Development Program (2016GSF115040) and the National Nature Science Foundation of China (41406060).
References
- P. V. O. Trindade, L. G. Sobral, A. C. L. Rizzo, S. G. F. Leite and A. U. Soriano, Chemosphere, 2005, 58, 515–522 CrossRef CAS PubMed
 .
. - X. Zhang, D. Xu, C. Zhu, T. Lundaa and E. S. Kerstin, Chem. Eng. J., 2012, 209, 138–146 CrossRef CAS
 .
. - S. B. Henderson, S. J. W. Grigson, P. Johnson and B. D. Roddie, Mar. Pollut. Bull., 1999, 38, 1141–1151 CrossRef CAS
 .
. - T. Stromgren, S. E. Sorstrom, L. Schou, I. Kaarsta, T. Aunaas, O. G. Brakst and O. Johansend, Mar. Environ. Res., 2014, 40, 147–169 CrossRef
 .
. - L. Washburn, S. Stone and S. Macintyre, Cont. Shelf Res., 1998, 19, 57–78 CrossRef
 .
. - M. Bao, Y. P. L. Wang, P. Sun, Y. Li and L. Cao, Environ. Sci. Process. Impact, 2014, 16, 897–903 RSC
 .
. - K. Das and A. K. Mukherjee, Bioresour. Technol., 2007, 98, 1339–1345 CrossRef CAS PubMed
 .
. - A. Singh, J. D. V. Hamme and O. P. Ward, Biotechnol. Adv., 2007, 25, 99–121 CrossRef CAS PubMed
 .
. - M. Dua, A. Singh, N. Sethunathan and A. Johri, Appl. Microbiol. Biotechnol., 2002, 59, 143–152 CrossRef CAS PubMed
 .
. - S. Varjani, Bioresour. Technol., 2017, 223, 277–286 CrossRef CAS PubMed
 .
. - S. Cappello, A. Volta, S. Santisi, C. Morici, G. Mancini, P. Quatrini, M. Genovese, M. M. Yakimova and M. Torregrossad, Int. Biodeterior. Biodegrad., 2016, 110, 235–244 CrossRef CAS
 .
. - A. K. Karamalidis, A. C. Evangelou, E. Karabika, A. I. Koukkou, C. Drainas and E. A. Voudriasa, Bioresour. Technol., 2010, 101, 6545–6552 CrossRef CAS PubMed
 .
. - W. Xia, Z. Du, Q. Cui, H. Dong, F. Wang, P. He and Y. Tang, J. Hazard. Mater., 2014, 276, 489–498 CrossRef CAS PubMed
 .
. - F. A. Bezza and E. M. N. Chirwa, Chemosphere, 2016, 144, 635–644 CrossRef CAS PubMed
 .
. - L. Whang, P. Liu, C. Ma and S. Cheng, J. Hazard. Mater., 2008, 151, 155–163 CrossRef CAS PubMed
 .
. - E. M. N. Chirwa, C. T. Mampholo, O. M. Fayemiwo and F. A. Bezza, J. Environ. Manage., 2017, 196, 261–269 CrossRef PubMed
 .
. - K. V. Sajna, R. K. Sukumaran, L. D. Gottumukkala and A. Pandey, Bioresour. Technol., 2015, 191, 133–139 CrossRef CAS PubMed
 .
. - S. Chhatre, H. Purohit, R. Shanker and P. Khanna, Water Sci. Technol., 1996, 34, 187–193 CrossRef CAS
 .
. - G. Georgiou, S. C. Lin and M. M. Sharma, Nat. Biotechnol., 1992, 10, 60–65 CrossRef CAS
 .
. - J. D. Desai and I. M. Banat, Microbiol. Mol. Biol. Rev., 1997, 61, 47–64 CAS
 .
. - P. Datta, P. Tiwari and L. Pandey, Bioresour. Technol., 2018 DOI:10.1016/j.biortech.2018.09.047
 .
. - R. Chandankere, J. Yao, M. Cai, K. Masakorala, A. K. Jain and M. Choi, Fuel, 2014, 122, 140–148 CrossRef CAS
 .
. - S. Muthukamalam, S. Sivagangavathi, D. Dhrishya and S. Rani, Braz. J. Microbiol., 2017, 48, 637–647 CrossRef CAS PubMed
 .
. - S. Joy, P. K. S. M. Rahman and S. Sharma, Chem. Eng. J., 2017, 317, 232–241 CrossRef CAS
 .
. - A. Aparna, G. Srinikethan and H. Smitha, Colloids Surf., B, 2012, 95, 23–29 CrossRef CAS PubMed
 .
. - J. Zhang, H. Lai, H. Gao, S. Hu and Q. Xue, Chem. Eng. J., 2018, 335, 510–519 CrossRef CAS
 .
. - P. L. D. Noüy, J. Gen. Physiol., 1919, 1, 521–524 CrossRef
 .
. - D. J. Lane, Nucleic acid techniques in bacterial systematics, 1991, pp. 115–175 Search PubMed
 .
. - N. Saitou, Mol. Biol. Evol., 1987, 4, 406–425 CAS
 .
. - S. J. Varjani and V. N. Upasani, Bioresour. Technol., 2016, 221, 510–516 CrossRef CAS PubMed
 .
. - M. N. Radzuan, I. M. Banat and J. Winterburn, Bioresour. Technol., 2017, 225, 99–105 CrossRef CAS PubMed
 .
. - E. J. Silva, N. M. P. R. E. Silva, R. D. Rufino, J. M. Luna, R. O. Silva and L. A. Sarubbo, Colloids Surf., B, 2014, 117, 36–41 CrossRef CAS PubMed
 .
. - A. Khopade, B. Ren, X. Liu, K. Mahadik, L. Zhang and C. Kokare, J. Colloid Interface Sci., 2012, 367, 311–318 CrossRef CAS PubMed
 .
. - D. K. Jain, D. L. Collins-Thompson, H. Lee and J. T. Trevors, J. Microbiol. Methods, 1991, 13, 271–279 CrossRef
 .
. - S. Joshi, C. Bharucha and A. J. Desai, Bioresour. Technol., 2008, 99, 4603–4608 CrossRef CAS PubMed
 .
. - P. G. Carrillo, C. Mardaraz, S. I. Pitta-Alvarez and A. M. Giulietti, World J. Microbiol. Biotechnol., 1996, 12, 82–84 CrossRef CAS PubMed
 .
. - I. Siegmund and F. Wagner, Biotechnol. Tech., 1991, 5, 265–268 CrossRef CAS
 .
. - M. P. Vinardell, Trends Comp. Biochem. Physiol., 1996, 2, 73–82 CAS
 .
. - D. G. Cooper, Microbiol. Sci., 1986, 3, 145–149 CAS
 .
. - T. B. Lotfabad, M. Shourian, R. Roostaazad, A. R. Najafabadi, M. R. Adelzadeh and K. A. Noghabi, Colloids Surf., B, 2009, 69, 183–193 CrossRef CAS PubMed
 .
. - J. B. Winterburn and P. J. Martin, Biotechnol. Lett., 2012, 34, 187–195 CrossRef CAS PubMed
 .
. - R. Cohen and D. Exerowa, Adv. Colloid Interface Sci., 2007, 134, 24–34 CrossRef PubMed
 .
. - T. Tadros, Green Sustainable Chem., 2013, 3 Search PubMed
 .
. - C. R. Macdonald, D. G. Cooper and J. E. Zajic, Appl. Environ. Microbiol., 1981, 41, 117–123 CAS
 .
. - T. Lotfabad, M. Shourian, R. Roostaazad, A. Najafabadi, M. Adelzadeh and K. Noghabi, Colloids Surf., B, 2009, 69, 183–193 CrossRef CAS PubMed
 .
. - R. Chandankere, J. Yao, M. Cai, K. Masakorala, A. Jain and M. Choi, Fuel, 2014, 122, 140–148 CrossRef CAS
 .
. - B. Liu, J. Liu, M. Ju, X. li and Q. Yu, Mar. Environ. Res., 2016, 107, 46–51 CAS
 .
. - A. Khopade, R. Biao, X. Liu, K. Mahadik, L. Zhang and C. Kokare, Desalination, 2012, 285, 198–204 CrossRef CAS
 .
. - M. Nitschke, S. G. Costa, R. Haddad, L. A. Gonçalves, M. N Eberlin and J. Contiero, Biotechnol. Prog., 2005, 21, 1562–1566 CrossRef CAS PubMed
 .
. - L. Cheng, Y. Wang, Z. Cai, J. Liu, B. Yu and Q. Zhou, Int. J. Phytorem., 2016, 19, 300–308 CrossRef PubMed
 .
. - F. Gomez and M. Sartaj, Int. Biodeterior. Biodegrad., 2013, 85, 375–382 CrossRef CAS
 .
. - S. W. Jeong, J. Jeong and J. Kim, J. Hazard. Mater., 2015, 286, 164–170 CrossRef CAS PubMed
 .
. - H. Heryani and M. D. Putra, Electron. J. Biotechnol., 2017, 27, 49–54 CrossRef CAS
 .
. - T. A. A Moussa, M. S. Mohamed and N. Samak, Braz. J. Chem. Eng., 2014, 31, 867–880 CrossRef
 .
. - S. N. R. L. Silva, C. B. B. Farias, R. D. Rufino, J. M. Luna and L. A. Sarubbo, Colloids Surf., B, 2010, 79, 174–183 CrossRef CAS PubMed
 .
. - T. Fukuoka, T. Morita, M. Konishi, T. Imura, H. Sakai and D. Kitamoto, Appl. Microbiol. Biotechnol., 2007, 76, 801–810 CrossRef CAS PubMed
 .
. - C. Hazra, D. Kundu and A. Chaudhari, RSC Adv., 2014, 5, 2974–2982 RSC
 .
. - F. R. Accorsini, M. J. Mutton, E. G. Lemos and M. Benincasa, Braz. J. Microbiol., 2012, 43, 116–125 CrossRef CAS PubMed
 .
. - J. Thaniyavarn, A. Chongchin, N. Wanitsuksombut, S. Thaniyavarn, P. Pinphanichakarn, N. Leepipatpiboon, M. Morikawa and S. Kanaya, J. Gen. Appl. Microbiol., 2006, 52, 215–222 CrossRef CAS PubMed
 .
. - G. Liu, H. Zhong, X. Yang, Y. Liu, B. Shao and Z. Liu, Biotechnol. Bioeng., 2018, 115, 796–814 CrossRef CAS PubMed
 .
. - A. F. Almansoory, H. A. Hasan, M. Idris, S. R. S. Abdullah, N. Anuar and E. M. M. Tibin, J. Ind. Eng. Chem., 2017, 47, 272–280 CrossRef
 .
. - W. Su, B. Wu and W. Chen, J. Taiwan Inst. Chem. Eng., 2011, 42, 689–695 CrossRef CAS
 .
. - R. C. Striebich, C. E. Smart, T. S. Gunasekera, S. S. Mueller, E. M. Strobel, B. W. McNichols and O. N. Ruiz, Int. Biodeterior. Biodegrad., 2014, 93, 33–43 CrossRef CAS
 .
. - A. Horowitz, D. Gutnick and E. Rosenberg, Appl. Microbiol., 1975, 30, 10–19 CAS
 .
. - P. M. Fedorak and D. W. S. Westlake, Water, Air, Soil Pollut., 1981, 16, 367–375 CrossRef CAS
 .
. - R. Chemlal, N. Abdi, H. Lounici, N. Drouiche, A. Pauss and N. Mameri, Int. Biodeterior. Biodegrad., 2013, 78, 43–48 CrossRef CAS
 .
. - K. M. Ghanem, S. M. Al-Garni and M. A. Al-Zahrani, Pol. J. Environ. Stud., 2016, 25, 97–106 CrossRef CAS
 .
. - J. B. van Beilen and E. G. Funhoff, Appl. Microbiol. Biotechnol., 2007, 74, 13–21 CrossRef PubMed
 .
.
|
| This journal is © The Royal Society of Chemistry 2018 |
Click here to see how this site uses Cookies. View our privacy policy here.  Open Access Article
 *abd and
Iffat Naz
 *ef
*ef
![[thin space (1/6-em)]](https://www.rsc.org/images/entities/char_2009.gif) :
:![[thin space (1/6-em)]](https://www.rsc.org/images/entities/char_2009.gif) 1, v/v) mixture. The aqueous layer was extracted several times and the organic layer was collected. The crude biosurfactant was obtained using a rotary evaporator under a vacuum.
1, v/v) mixture. The aqueous layer was extracted several times and the organic layer was collected. The crude biosurfactant was obtained using a rotary evaporator under a vacuum.
![[thin space (1/6-em)]](https://www.rsc.org/images/entities/char_2009.gif) :
:![[thin space (1/6-em)]](https://www.rsc.org/images/entities/char_2009.gif) 15
15![[thin space (1/6-em)]](https://www.rsc.org/images/entities/char_2009.gif) :
:![[thin space (1/6-em)]](https://www.rsc.org/images/entities/char_2009.gif) 2, v/v/v), and the chromogenic agent compositions were as follows: (1) exposure to the reagent prepared by mixing 100 mL acetic acid, 2 mL sulfuric acid and 1 mL p-anisaldehyde for the sugar moieties detection; (2) exposure to iodine vapour for lipids; (3) exposure to 1% ninhydrin reagent for the detection of free amino groups, and the plates were heated at 110 °C for 5 min until glassy brown spots appeared.32
2, v/v/v), and the chromogenic agent compositions were as follows: (1) exposure to the reagent prepared by mixing 100 mL acetic acid, 2 mL sulfuric acid and 1 mL p-anisaldehyde for the sugar moieties detection; (2) exposure to iodine vapour for lipids; (3) exposure to 1% ninhydrin reagent for the detection of free amino groups, and the plates were heated at 110 °C for 5 min until glassy brown spots appeared.32


.
.
.
.
.
.
.
.
.
.
.
.
.
.
.
.
.
.
.
.
.
.
.
.
.
.
.
.
.
.
.
.
.
.
.
.
.
.
.
.
.
.
.
.
.
.
.
.
.
.
.
.
.
.
.
.
.
.
.
.
.
.
.
.
.
.
.
.


