
 Open Access Article
 This Open Access Article is licensed under a Creative Commons Attribution-Non Commercial 3.0 Unported Licence
A metabolic interpretation for the response of cellular autofluorescence to chemical perturbations assessed using spectral phasor analysis
Jeff Maltas†
,
Dylan Palo†,
Chong Kai Wong,
Symeon Stefan,
James O'Connor,
Nazar Al Aayedi,
Madhu Gaire,
Diana Kinn and
Paul Urayama *
*
Department of Physics, Miami University, Oxford, OH 45056, USA. E-mail: urayampk@MiamiOH.edu; Fax: +1 (513) 529-5629; Tel: +1 (513) 529-9274
First published on 12th December 2018
Abstract
Analytical approaches for sensing cellular NADH conformation from autofluorescence signals have significance because NADH is a metabolic indicator and endogenous biomarker. Recently, spectral detection of multiple cellular NADH forms during chemically-induced metabolic response was reported, however because NADH is solvatochromic and the spectral change is small, the possibility of a non-metabolic interpretation needs to be considered. Here we investigate the response of UV-excited autofluorescence to a range of well-known chemicals affecting fermentation, respiration, and oxidative-stress pathways in Saccharomyces cerevisiae. The two-component nature of the spectral response is assessed using phasor analysis. By considering a series of physically similar and dissimilar chemicals acting on multiple pathways, we show how the two-component nature of a spectral response is of metabolic origin, indicative of whether a single or several pathways have been affected.
Cellular reduced nicotinamide adenine dinucleotide (NADH) exists in multiple conformations, which is significant because the proportions of these forms respond differently to metabolic conditions.1–3 Real-time metabolic monitoring approaches sensitive to cellular NADH conformation therefore have bioanalytical significance, e.g., in using NADH as a metabolic indicator and endogenous biomarker,1–9 in monitoring cytotoxicity,10,11 or in investigating NADH/reduced nicotinamide adenine dinucleotide phosphate (NADPH) balance.12,13
Although excited-state, energy-transfer, and anisotropy-decay measurements on fluorescence signals provide direct physical measures of conformation,1,14,15 we reported the spectral detection of multiple cellular NADH forms,16 of interest due to the wide availability and straightforward implementation of spectroscopic methods. By quantifying spectrum shape using spectral phasor analysis, changes in UV-excited autofluorescence spectra in response to different NADH-oxidation inhibitors (i.e., ethanol and cyanide) were distinguishable and could not be accounted for using a two-component (e.g., free vs. bound) model for excited-state emission. Therefore, we proposed an interpretation in which the non-two-component behavior in spectrum shape during a metabolic response was due to the redistribution of NADH forms associated with the multiple NADH-utilizing pathways.16
Note a phasor analysis for fluorescence lifetime signals is well established17–19 with a graphical representation useful in assessing the composition of complex systems and in distinguishing metabolic states in cells.20–23 Here, a spectral phasor analysis, initially developed for the rapid identification of regions within hyperspectral images24,25 and increasingly used in imaging studies of biological systems,26–30 is used for the assessment of two-component behavior in the emission signal.
Because NADH is solvatochromic and because conformations have emission with significant spectral overlap,31 factors not indicative of a metabolic response but still affecting emission spectrum shape are possible, and so a pathway-level interpretation needs to be demonstrated over a broad range of metabolic responses. By chemically affecting fermentation, respiration, and oxidative-stress pathways in S. cerevisiae (baker's yeast), we show here how changes in UV-excited autofluorescence spectrum shape are better interpreted as having metabolic rather than non-metabolic origins (e.g., due to the polarity of the added chemical).
First, we present a direct illustration of metabolic-pathway discrimination by demonstrating how sequentially-induced responses affecting the same pathway follow two-component behavior, while responses affecting different pathways show non-two-component behavior. Next, to help rule out a non-metabolic interpretation, we show how the same chemical (i.e., cyanide) induces an autofluorescence response dependent on incubation in glucose, producing a non-two-component response consistent with having different initial metabolic states. Conversely, we show how chemicals of differing polarities (i.e., various alcohols) induce autofluorescence responses which collectively follow two-component behavior, in agreement with the alcohols having similar modes of metabolic action.
To illustrate a situation where the chemical added is known to interact with the fluorophore, we show how metabolic effects of 2-thenoyltrifluoroacetone (TTFA) can be observed despite TTFA acting as a fluorescence quencher. Finally, we explore a potential application by comparing NADPH- and NADH-related responses through sequential chemical perturbations inducing either oxidative stress or respiratory inhibition.
Methods
Reviews on cellular and tissue autofluorescence32–35 are available, and details regarding the spectroscopic system, sample preparation, and spectral phasor calculations16 are described previously. Briefly, the excitation source is a nitrogen-gas discharge laser (model GL-3300, Photon Technology International) having a 1 ns nominal pulse width at 337 nm wavelength. Spectra are acquired using a spectrograph (model MS 125, Spectra-Physics/Newport) coupled to a time-gated intensified CCD (ICCD) (model iStar 734, Andor) with a picosecond-resolution digital delay generator (DDG) for controlling gate delay. An optical constant fraction discriminator (model OCF-401, Becker & Hickl) is used to sense the excitation pulse and serves as a low temporal-jitter reference for gate-delay timing. So that the sample's emission falls within the range of gate delays accessible by the ICCD/DDG, a 25 m optical fiber is used to delay the excitation pulse from arriving at the sample. Emission is filtered through a 385 nm long-pass filter and collected at 90-degrees from the excitation using a separate fiber optic, delivering light to the spectrograph/ICCD. The spectrograph utilizes a 400 l mm−1 grating, and the system is calibrated for wavelength using a mercury-argon lamp (cat. no. 6035, Newport). The 1024 × 1024 pixel CCD chip is fully binned along one axis during readout. The measured spectral width of atomic lines is 2 nm with the 1024-channel output spanning a wavelength range from 400 to 650 nm.The ICCD gate opens 5 ns prior to signal arrival and integrates for 80 ns. (Note that although the system is capable of nanosecond-gated detection, only time-integrated signals are considered in this study.) A full spectrum is collected for each excitation pulse, although spectra are averaged over multiple pulses to increase peak-signal-to-noise ratio (SNR). The CCD is temperature regulated, and the CCD dark current is subtracted from measured spectra prior to analysis.
To minimize background fluorescence, S. cerevisiae samples are grown on YPD agar medium (cat. no. Y1000, TekNova), rather than liquid medium, for two or three days. Prior to measurement, cells are triple washed in phosphate-buffered saline (PBS, cat. no. 20012, Life Technologies). Cells are then resuspended in PBS, having a density of approximately 107 cells per ml, as determined from a measurement of absorbance. Samples are not temperature regulated; room temperature is measured at 22 ± 2 °C. Measurements are performed in a quartz cuvette open to air, and samples are continuously stirred during all measurements. Samples prepared on agar and suspended in PBS in this manner were confirmed to have a UV-excited autofluorescence intensity that responds to oxygenation and to additions of cyanide, ethanol, and glucose36 in manner similar to starved yeast cultures maintained in a batch reactor.37
Metabolic responses are induced after the autofluorescence spectrum is observed to reach a steady state, approximately 30 min after resuspension in PBS (60 min for samples involving incubation in D-glucose). A spectral measurement is made approximately every 30 s during real time monitoring. No photobleaching is observed at this monitoring interval. To induce a metabolic response, potassium cyanide (cat. no. 60178, Sigma-Aldrich) in PBS, D-glucose (cat. no. 49139, Sigma-Aldrich) in PBS, 2-deoxy-D-glucose (cat. no. D8375, Sigma-Aldrich) in PBS, L-glucose (cat. no. G5500, Sigma-Aldrich) in PBS, an alcohol (methanol, cat. no. 154903; ethanol, cat. no. 459828; 1-propanol, cat. no. 256404; 2-propanol, cat. no. 650447; or 1-butanol, cat. no. B7906; Sigma-Aldrich), TTFA (cat. no. T27006, Sigma-Aldrich) in dimethyl sulfoxide (DMSO, cat. no. 41639, Sigma-Aldrich), or diamide (cat. no. 02101527, MP Biomedicals) in DMSO is added to the cuvette to the final concentrations specified. For alcohols, a spectroscopic grade is used if available. The volume increase upon chemical addition is limited to no more than 2%. No more than 1 vol% DMSO is present in the sample; no autofluorescence response is observed for a DMSO-only control.
For solution measurements, 10 μM NADPH (cat. no. N20140, Research Products International) or 10 μM NADH (cat. no. N8129, Sigma-Aldrich) is prepared in 20 mM 3-morpholinopropane-1-sulfonic acid (MOPS) buffer, adjusted to pH 7.4 using sodium hydroxide. Measurements are performed in a quartz cuvette open to air. Samples are continuously stirred during all measurements. TTFA or diamide in DMSO is added to the NADPH or NADH solution to the final concentration specified.
Spectrum shape is quantified using spectral phasors.24,26,29,38 For N spectral channels, the phasor A for an observed spectrum F is
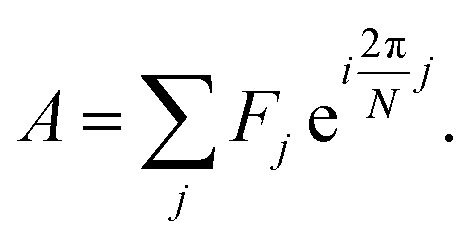 | (1) |
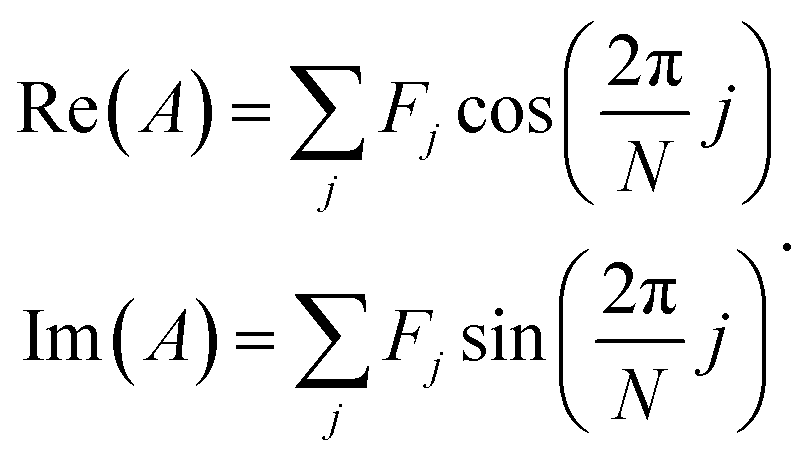 | (2) |
The analytic utility of a phasor approach is that spectral phasors of emission from a two-component mixture are collinear on a spectral phasor plot. Assuming spectrum F is a linear combination of spectra F1 and F2 weighted by a fraction a ranging from 0 to 1, we have
 | (3) |
Additionally if F = aF1 + (1 − a)F2 + Fbg, where Fbg is a spectrum unaffected by the chemical added, then A = aA1 + (1 − a)A2 + Abg and the phasor shift ΔA becomes
| ΔA = Afinal − Ainitial = (afinal − ainitial)A1 + (ainitial − afinal)A2, | (4) |
Note that while the phasor value itself depends on the spectral interval used in eqn (1), the choice of interval does not affect the collinearity of phasor values associated with a two-component system.16 Nonetheless, we find that good contrast (large ratio of phasor shifts to spread in phasor points) is achieved when the interval is centered on the spectrum and is broad enough to capture relevant spectral features; the interval used here is indicated in each figure caption. Additional examples and discussion of how measurement parameters, including the spectral interval and SNR, affect measurement are found in previous studies.16,24,36
Results
Fig. 1a shows the autofluorescence monitored during sequential additions of ethanol then cyanide to cellular samples. Because ethanol and cyanide are both oxidation inhibitors, the emission intensity increases with each chemical addition. The directions of the spectral phasor shift differ and are not collinear, and so a two-component model cannot account for the observed change in spectrum shape. Non-two component behavior suggests different pathways are being affected for each chemical addition, consistent with ethanol and cyanide having distinct modes of action – ethanol is believed to have effects at multiple points,39–41 while cyanide is known to inhibit the aerobic oxidative pathway.42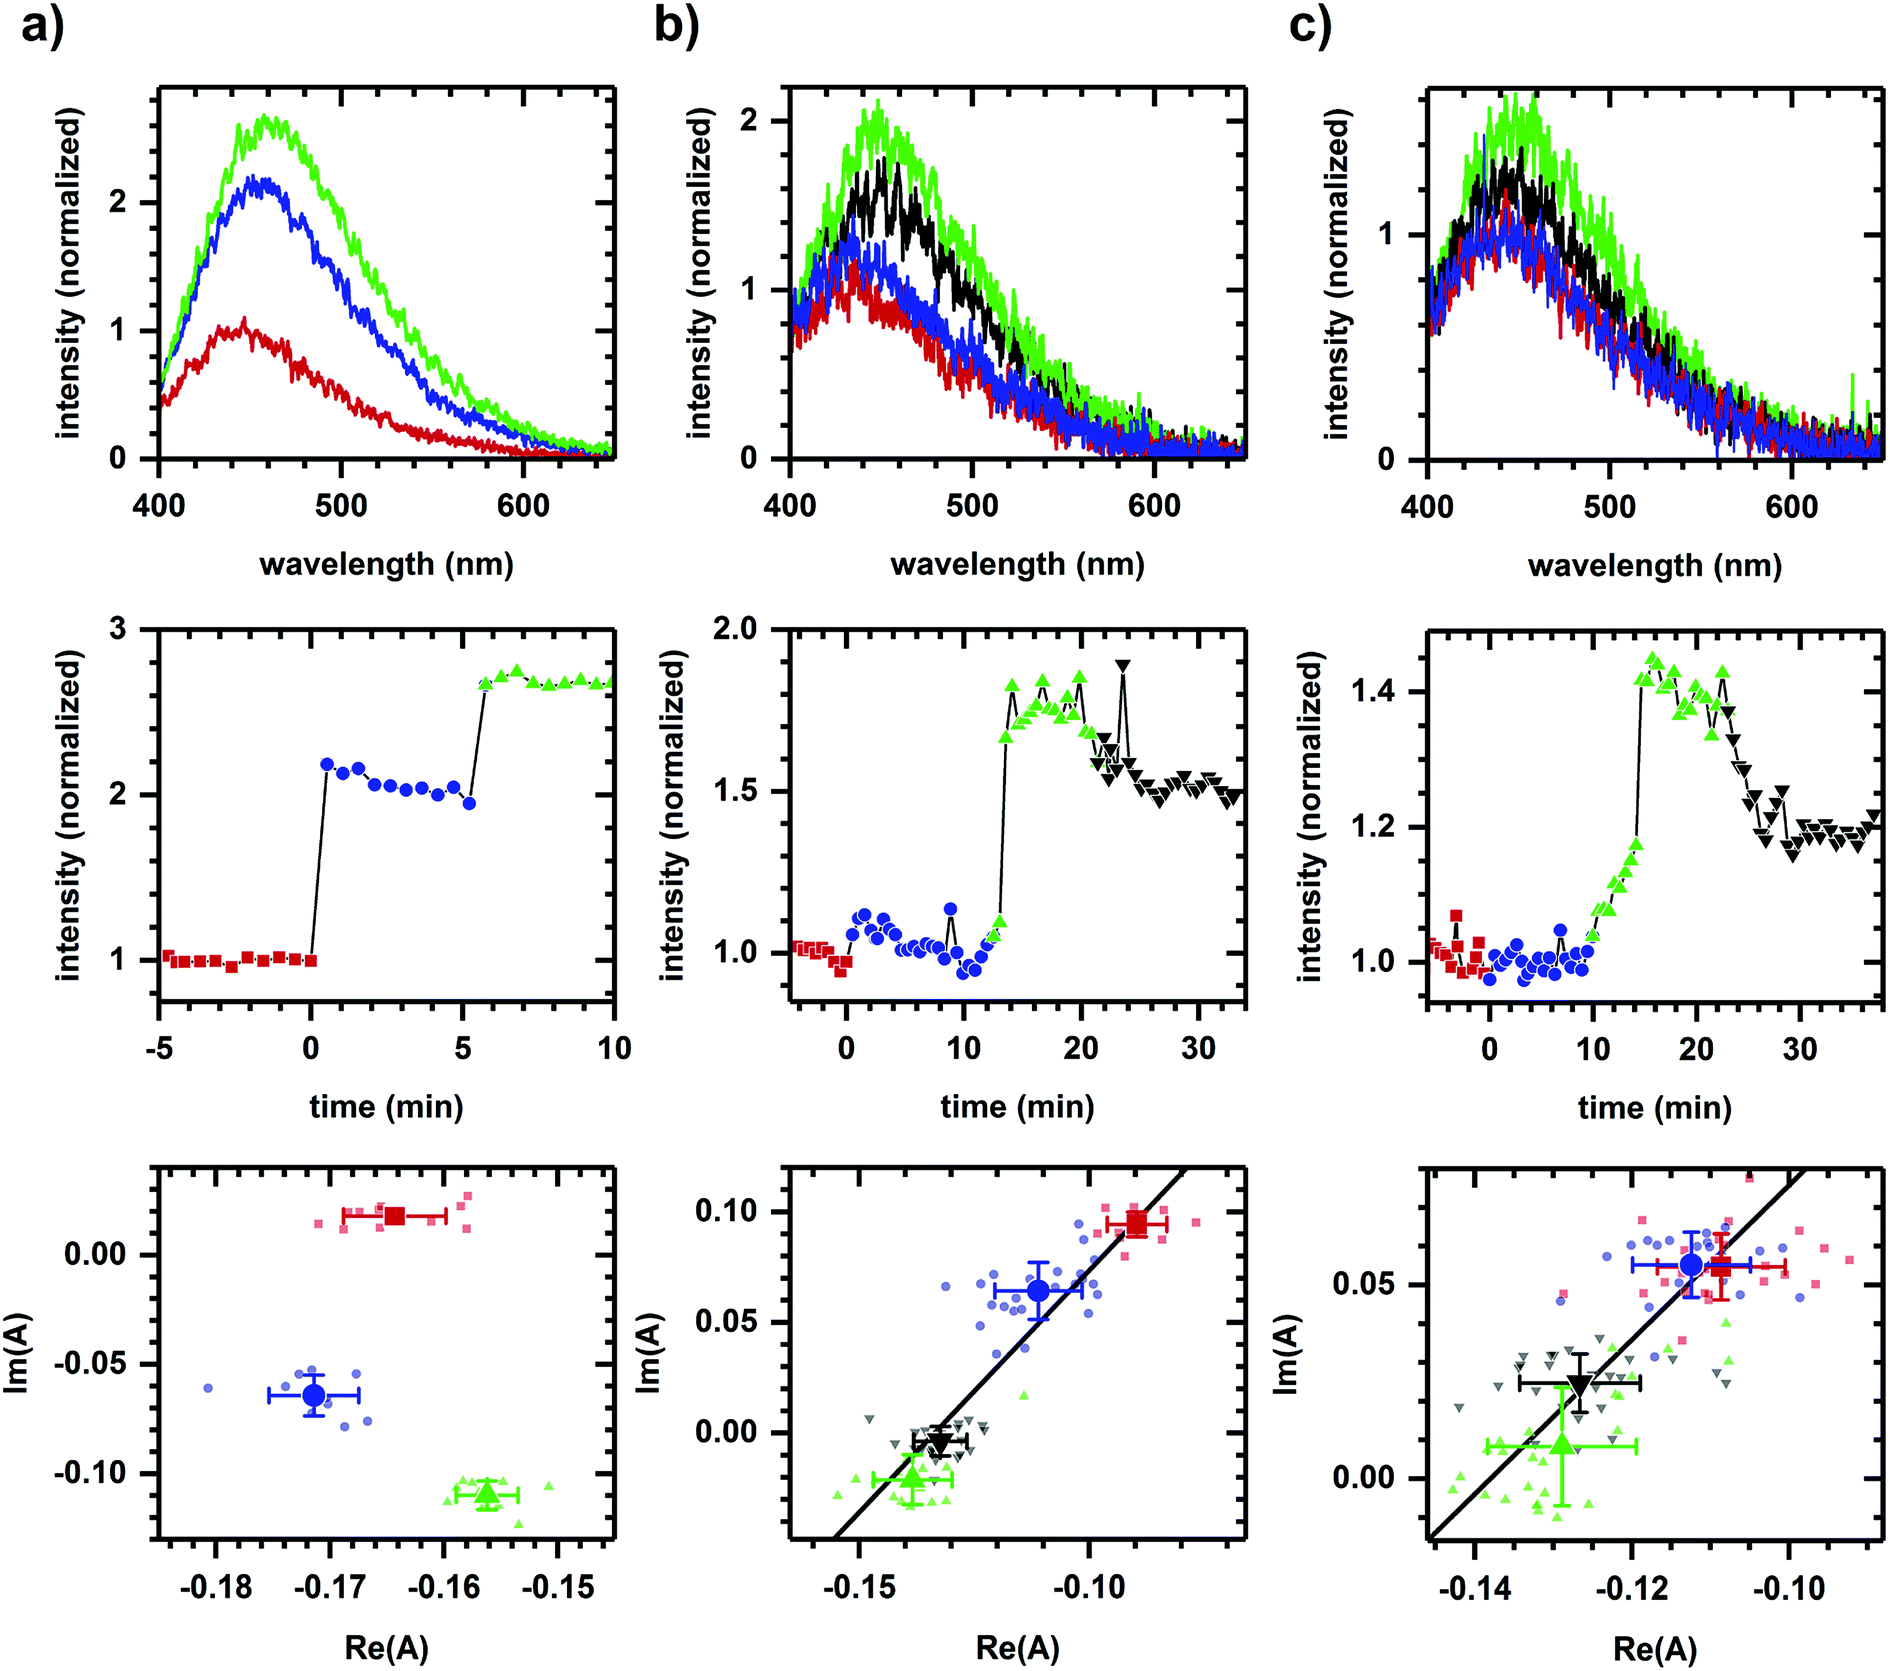 | ||
| Fig. 1 Autofluorescence response to the sequential additions of chemicals affecting different and same pathways. (a) Response to ethanol (340 mM) then cyanide (8 mM). (b) Response to D-glucose (added twice, 1 mM, 2 mM) then 2-deoxy-D-glucose (4 mM). (c) Response to L-glucose (4 mM), D-glucose (2 mM), then deoxy-D-glucose (4 mM). Concentrations are final concentrations. The cell density is approximately 107 cells per ml. For all columns, plots are emission spectra (top), spectrally-integrated emission intensity (middle), and spectral phasors (bottom). A change in color and symbol indicates a chemical addition and are used consistently within a column. Red is prior to any chemical addition. Intensities have been normalized to the value prior to chemical addition. Phasor analysis is performed over the first 400 pixels (400–500 nm wavelength range). Average and standard deviation for phasor values are shown in larger symbol for emphasis. A linear fit is shown to facilitate assessment of collinearity. Data shown are representative with variations in SNR due to the manual alignment of system optics. The variations in error bars are largely due to the SNR of the emission spectra. Results for each column have been reproduced in at least three independently prepared samples. | ||
By comparison, Fig. 1b shows the autofluorescence response to two sequential additions of D-glucose, then 2-deoxy-D-glucose. An intensity change is observed after each addition – an intensity increase for each D-glucose addition and an intensity decrease for the 2-deoxy-D-glucose addition. In this case, however, the spectral phasor shifts are collinear. Each D-glucose addition results in shifts of similar direction with the 2-deoxy-D-glucose addition shifting in an opposite direction. The collinearity is consistent with a two-component change, that is, the activation and inhibition associated with a single pathway or mode of action for D-glucose and 2-deoxy-D-glucose.43
Because NADH is solvatochromic, an alternate interpretation for these results is that the change in spectrum shape is simply a response to a change in solvent polarity when chemicals are added. As evidence for a metabolic interpretation, Fig. 1c shows the autofluorescence response to two additions of glucose, although this time of glucose enantiomers (L-glucose then D-glucose), prior to the 2-deoxy-D-glucose addition. Despite having similar physico-chemical properties, L-glucose induces no response in either the emission intensity or spectrum shape, consistent with the L enantiomer not having metabolic activity.44 The D-glucose and 2-deoxy-D-glucose shifts are again collinear and in opposite directions.
Next, we consider whether the non-collinearity in Fig. 1a is due to the difference in polarity between ethanol and cyanide. Fig. 2 shows the autofluorescence response to cyanide added to the same final concentration for cellular suspensions incubated at different glucose levels. While the addition of cyanide results in an increased intensity in each case, the temporal response and phasor shift direction differ despite the samples having had the same change in cyanide concentration.
 | ||
| Fig. 2 Autofluorescence response to the addition of cyanide after incubation at various D-glucose concentrations. (a) Spectrally-integrated emission intensity. (b) Spectral phasors. Incubations are at no glucose (red), 3 mM glucose (blue), and 10 mM glucose (green) incubations. Cyanide (8 mM) is added at t = 0 min. The cell density is approximately 107 cells per ml. Intensities have been normalized to the value prior to chemical addition. Phasor analysis is performed over the first 400 pixels (400–500 nm wavelength range). Open symbols in the phasor plot are for times prior to chemical addition. Average and standard deviation for phasor positions are shown in larger symbol for emphasis. Note the shift in initial phasor positions is due to the various levels of glucose incubation and likely represents differences in initial metabolic state. Data shown are representative. Results at each glucose level have been reproduced in at least three independently prepared samples. | ||
Fig. 3 shows the converse situation, showing autofluorescence responses induced by chemicals of differing polarities (i.e., various alcohols) added to cellular samples resulting in collinear phasor shifts consistent with two-component emission. Further, the magnitudes of intensity increase and phasor shift correlate with the smallest to largest effects seen for methanol, 2-propanol, 1-butanol, 1-propanol, then ethanol. This trend is comparable to the previously observed inhibition of cellular respiration by these alcohols.41 The two-component autofluorescence response is also consistent with these alcohols having a similar mode of metabolic action.41
 | ||
| Fig. 3 Autofluorescence response to the addition of various alcohols. (a) Spectrally-integrated emission intensity. (b) Spectral phasors. (c) Spectral phasors shifted such that the initial phasor values are coincident at the origin. (d) Comparison with cellular respiration reported by Carlsen et al.41 The alcohols are methanol (black diamond), ethanol (red square), 1-propanol (blue circle), 2-propanol (orange inverted triangle), and 1-butanol (green upright triangle). All final concentrations are 144 mM alcohol. The cell density is approximately 107 cells per ml. Intensities have been normalized to the value prior to chemical addition. Phasor analysis is performed over the first 400 pixels (400–500 nm wavelength range). Open and filled phasor symbols are for conditions before and after chemical addition. The spread in phasor points is comparable to Fig. 1 and 2, so only the average and standard deviation are shown for clarity. A linear fit is shown to facility assessment of collinearity. Data shown are representative. Results for each alcohol have been reproduced in at least three independently prepared samples. The alcohol-induced change in autofluorescence intensity (Δint) and phasor shift are calculated using the first 10 min of data after alcohol addition. The percent change in cellular respiration (Δresp) is normalized to alcohol concentration. | ||
As an example of applying the two-component assessment, we find that a metabolic response may still be detected despite having optical artifacts present. TTFA (a complex II inhibitor45) quenches NADH fluorescence, as shown in solution measurements (Fig. 4a), and yet respiratory inhibition is detectable via a diminished cyanide-induced intensity and spectral response (Fig. 4b). Phasor shifts of the cyanide-induced autofluorescence response are collinear despite the presence of a TTFA, and not collinear with the phasor shift produced by TTFA quenching in the corresponding cellular sample. This is consistent with cyanide and TTFA having different modes of action on autofluorescence.
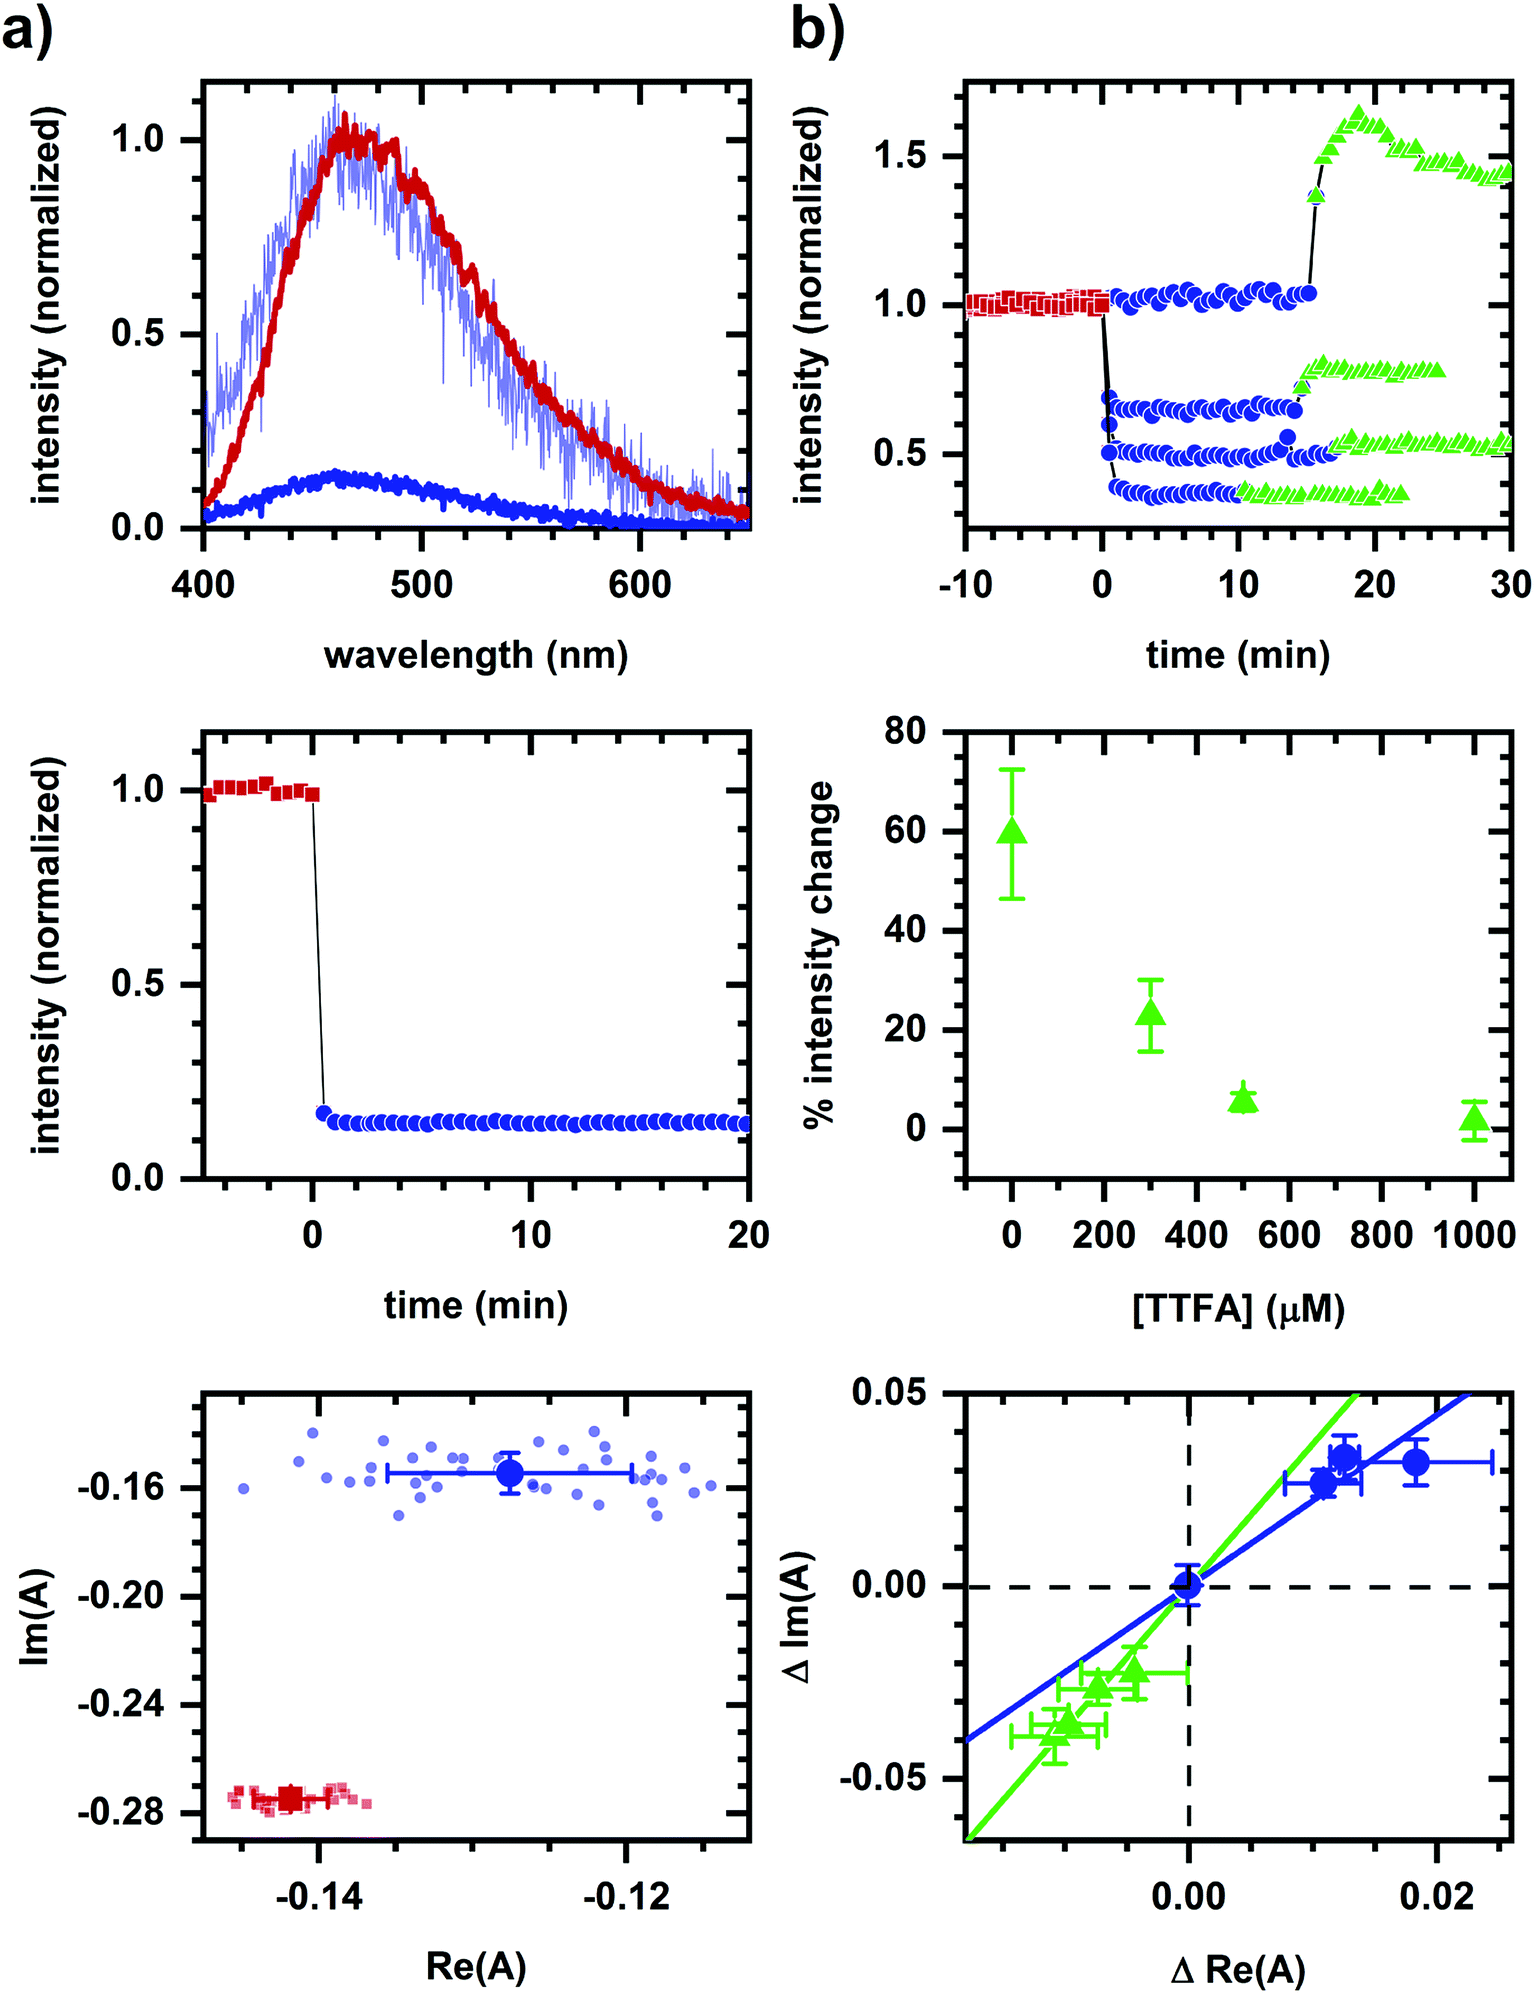 | ||
| Fig. 4 Detection of a metabolic response in presence of a fluorescence quencher. (a) Quenching of NADH (10 μM in MOPS buffer) emission by TTFA (1 mM) in solution. (b) Autofluorescence response to sequential additions of TTFA (various concentrations) and cyanide (1 mM). Concentrations are final concentrations. A change in color and symbol indicates a chemical addition and are used consistently within a column. Red is prior to any chemical addition. Phasor analysis is performed over the first 400 pixels (400–500 nm wavelength range). For solution measurements, plots are emission spectra (top), spectrally-integrated emission intensity (middle), and spectral phasors (bottom). TTFA addition results in significant quenching of NADH fluorescence and a change in spectrum shape. To facilitate comparison of spectrum shape, the spectrum after TTFA addition has been scaled (light blue) to minimize the least-squared difference with the emission spectrum prior to TTFA addition. For cellular measurements, results are for four TTFA concentrations (0, 300, 500, 1000 μM). As TTFA concentration is increased, spectrally-integrated emission intensity (top) shows a greater intensity decrease upon TTFA addition and lesser intensity increase upon subsequent cyanide addition. The percent change in cyanide-induced response (middle) decreases with increasing TTFA concentration. When plotting the change (Δ) in spectral phasor value (bottom), the TTFA-induced shift is larger and the cyanide-induced shift is smaller as the TTFA concentration increases. Phasor analysis is performed over the first 400 pixels (400–500 nm wavelength range). Each data point is the average of three independently prepared samples. Error bars are the standard error of the mean for three samples. Linear fits are shown to facilitate comparison of collinearity between TTFA- and cyanide-induced shifts. | ||
In a second example, we find that NADPH- and NADH-related responses can be distinguished during sequential additions of diamide and cyanide. Diamide, a general oxidant,46 decreases the emission intensity of NADPH and NADH solutions (Fig. 5a). Diamide also decreases the autofluorescence intensity (Fig. 5b and c), though with a more rapid response time than in solution. The diamide-induced phasor shift in cells is small, but its direction is reproducible and not strongly dependent on diamide concentration. Shifts in solution and in cells are not collinear, suggesting a difference in the emission quenching process, and so the autofluorescence response appears to have a metabolic component. The subsequent addition of cyanide increases the autofluorescence intensity (Fig. 5b and c) with the fractional change not strongly dependent on diamide concentration (+62.44 ± 0.02% at 200 μM diamide and +61.9 ± 0.1% at 2 mM diamide, calculated using the first 10 min of data after cyanide addition for three or more independently prepared samples at each concentration). Phasor shifts for diamide- and cyanide-induced responses are not collinear at low diamide concentration and difficult to assess at high diamide concentration, although shifts along the real phasor axis at both concentrations follow similar behavior.
 | ||
| Fig. 5 Autofluorescence response to chemical additions related to oxidative stress and respiratory inhibition. (a) Response of emission from NADPH (10 μM in MOPS buffer) and NADH (10 μM in MOPS buffer) solutions to diamide (2 mM). (b) Autofluorescence response to sequential additions of diamide (200 μM) and cyanide (8 mM). (c) Autofluorescence response to sequential additions of diamide (2 mM) and cyanide (8 mM). Concentrations are final concentrations. For all columns, plots are emission spectra (top), spectrally-integrated emission intensity (middle), and spectral phasors (bottom). For (a), measurements on NADPH are in red and NADH are in blue; for (b) and (c), a change in color and symbol indicates a chemical addition and are used consistently within a column. Red is prior to any chemical addition. To facilitate comparison of spectrum shape for solution measurements, the spectrum after diamide addition has been scaled (light red, light blue) to minimize the least-squared difference with the emission spectrum prior to diamide addition. For all columns, intensities have been normalized to the value prior to chemical addition. Phasor analysis is performed over the first 400 pixels (400–500 nm wavelength range). Average and standard deviation for phasor values are shown in larger symbol for emphasis. For solution measurements, the average and standard deviation are calculated using data starting 10 min after diamide addition. Data shown are representative. Results for each column have been reproduced in at least three independently prepared samples. | ||
Discussion
Previous work has shown that, despite its solvatochromic properties, quantitative sensing of NADH conformation in solution based on analysis of emission spectrum shape is possible, for example, by producing a free energy of solvent denaturation consistent with values obtained from more direct measurements of conformation.47 Here, we evidence the spectroscopic sensing of conformation in vivo by using the same analysis approach to assess the two-component behavior of autofluorescence spectrum shape during chemically-induced changes to fermentation, respiration, and oxidative-stress pathways. Given that the signal is an ensemble emission of the various forms, a two-component response means that the emission is adequately modeled as a mixture of two ensembles (e.g., the ensembles associated a metabolic pathway being activated and inhibited) without requiring additional ensembles to describe response behavior. Note that “pathway” in this context might not be a single biochemical pathway, but rather refers to the cumulative contribution to the emission spectrum shape.We confirmed previously that heat-treated, non-viable S. cerevisiae samples did not exhibit a change in time-integrated autofluorescence spectrum shape when cyanide, ethanol, or glucose was added.36 While this was evidence that observed responses were metabolic, a negative observation does not preclude the possibility that the two-component nature of the spectral response involved non-metabolic factors such as chemical polarities. With the positive observations presented here, it is shown that a metabolic interpretation better accounts for observed autofluorescence responses. For example, the metabolically inactive L-glucose, which is physically similar to D-glucose, produces no autofluorescence response, while D-glucose and 2-deoxy-D-glucose induce opposite two-component responses (Fig. 1). Next, we find that the same cyanide addition induces a response dependent on sample incubation which as a whole does not follow two-component behavior (Fig. 2), presumably due to the differential response of the initial metabolic states. Conversely, alcohols of differing polarities all result in two-component responses consistent with each alcohol having a similar mode of action (Fig. 3).
Physical arguments also suggest non-metabolic factors are unlikely. For NADH in solution, a concentration of several molar methanol is required to produce changes in spectrum shape comparable to those seen here using millimolar-levels of alcohol.47 It is also unlikely that results are due to a local enhancement of solvent effects due to ligand binding because the binding site is not in spatial proximity to the NADH binding site, e.g., cyanide binds to complex IV while NADH binds to the mitochondrial NADH dehydrogenases in S. cerevisiae.48
Even when a fluorescence quencher is present, a metabolic response is detectable using spectral phasors. Respiratory inhibition by TTFA can be sensed via a subsequently diminished cyanide-induced autofluorescence response despite TTFA's quenching of NADH fluorescence (Fig. 4). The non-collinearity of TTFA- and cyanide-induced phasor shifts is consistent with the sensing of their distinct modes of action. Note that a cyanide-induced intensity increase correlates with the magnitude of the phasor shift, although there remains a detectable phasor shift at 1000 μM TTFA where no intensity change is observed. Functional measurements are needed to resolve this contradiction, which may be due to quenching.
Next, methods using excited-state lifetime12 and genetically-encoded fluorescent sensors49 have been developed for separating NADPH/NADH responses, significant because NADPH and NADH have nearly identical emission characteristics50 (collectively referred to as NAD(P)H) and yet have distinct metabolic roles – NADP+/NADPH is a component of the cellular antioxidation system while NAD+/NADH is involved in energy metabolism and mitochondrial function.51 Here, Fig. 5 demonstrates the potential for spectral discrimination of NADPH- and NADH-related response by observing non-two-component behavior in the phasor shifts induced using diamide and cyanide.
Although diamide quenches the emission of both NADPH and NADH, the non-two-component behavior of diamide-induced shifts between solution and cellular samples suggests the quenching process differs, indicating a possible metabolic component to the autofluorescence response. By comparison, the cyanide-induced intensity and phasor responses remain similar to earlier measurements (Fig. 4b), although we have not determined whether the difference at low and high diamide concentrations is due to a change in metabolic response to cyanide or to the quenching mechanism, e.g., to the role a photophysical process like photoinduced electron transfer plays in the observed response. Regardless, phasor analysis is able to discriminate between the cyanide- and diamide-induced response and so further development of the approach may be worthwhile.
An additional issue related to distinguishing NADPH and NADH emission is whether the autofluorescence responses shown previously (Fig. 1–4) are due to NADH alone. While chemicals were selected for their known action on NADH-related pathways, cellular NADPH and NADH pools are connected via biochemical pathways.13 In assessing the role NADPH might play in those situations, note that Fig. 5 shows a relatively small diamide-induced phasor shift that appears insensitive to diamide concentration and that is not in the direction of shifts seen in most other cases. This suggests the responses presented in Fig. 1–4 are not associated with oxidative stress and that the NADH-based interpretation is the predominant effect, although we cannot conclude that there are no contributions from changes in the NADPH pool. Continued development of the approach may reveal a more nuanced interpretation involving NADPH and NADH metabolisms.
Although a less direct physical measure of conformation, autofluorescence spectrum shape is sensitive to changes in cellular NADH forms. Using a phasor approach to assess two-component behavior, we demonstrate a metabolic interpretation for spectral changes during chemically-induced metabolic response, thus going beyond the “free vs. protein bound” description of conformation, making the dynamical nature of the conformational ensemble observable in real time. More generally, we have illustrated how a phasor approach can be a useful tool for understanding changes in spectral signals in terms of a two-component interpretation.
Conflicts of interest
There are no conflicts of interest to declare.Acknowledgements
Jeff Maltas and Dylan Palo contributed equally to this work. This research was supported by funds from Miami University’s College of Arts and Science Dean's Scholar program and the Office of Research for Undergraduate's Undergraduate Summer Scholars program. We thank Lana Amer, Ben Biegel-Cloughessy, and Morgan McGrath for assistance on this project.References
- H. D. Vishwasrao, A. A. Heikal, K. A. Kasischke and W. W. Webb, J. Biol. Chem., 2005, 280, 25119–25126 CrossRef CAS.
- J. Vergen, C. Hecht, L. V. Zholudeva, M. M. Marquardt, R. Hallworth and M. G. Nichols, Microsc. Microanal., 2012, 18, 761–770 CrossRef CAS PubMed.
- M. A. Yaseen, S. Sakadzic, W. Wu, W. Becker, K. A. Kasischke and D. A. Boas, Biomed. Opt. Express, 2013, 4, 307–321 CrossRef CAS PubMed.
- J. M. Salmon, E. Kohen, P. Viallet, J. G. Hirschberg, A. W. Wouters, C. Kohen and B. Thorell, Photochem. Photobiol., 1982, 36, 585–593 CrossRef CAS PubMed.
- J. A. Palero, A. N. Bader, H. S. de Bruijn, A. v. d. P. van den Heuvel, H. J. C. M. Sterenborg and H. C. Gerritsen, Biomed. Opt. Express, 2011, 2, 1030–1039 CrossRef CAS PubMed.
- C. Stringari, J. L. Nourse, L. A. Flanagan and E. Gratton, PLoS One, 2012, 7, e48014 CrossRef CAS PubMed.
- K. Drozdowicz-Tomsia, A. G. Anwer, M. A. Cahill, K. N. Madlum, A. M. Maki, M. S. Baker and E. M. Goldys, J. Biomed. Opt., 2014, 19, 086016 CrossRef PubMed.
- A. Rueck, C. Hauser, S. Mosch and S. Kalinina, J. Biomed. Opt., 2014, 19, 096005 CrossRef PubMed.
- C. W. Shuttleworth, Neurochem. Int., 2010, 56, 379–386 CrossRef CAS PubMed.
- R. M. Rodrigues, P. Macko, T. Palosaari and M. P. Whelan, Toxicol. Lett., 2011, 206, 281–288 CrossRef CAS.
- A. Bednarkiewicz, R. M. Rodrigues and M. P. Whelan, Toxicol. in Vitro, 2011, 25, 2088–2094 CrossRef CAS PubMed.
- T. S. Blacker, Z. F. Mann, J. E. Gale, M. Ziegler, A. J. Bain, G. Szabadkai and M. R. Duchen, Nat. Commun., 2014, 5, 3936 CrossRef CAS PubMed.
- T. S. Blacker and M. R. Duchen, Free Radicals Biol. Med., 2016, 100, 53–65 CrossRef CAS PubMed.
- A. Gafni and L. Brand, Biochemistry, 1976, 15, 3165–3171 CrossRef CAS PubMed.
- R. V. Hull, P. S. Conger and R. J. Hoobler, Biophys. Chem., 2001, 90, 9–16 CrossRef CAS PubMed.
- J. Maltas, L. Amer, Z. Long, D. Palo, A. Oliva, J. Folz and P. Urayama, Anal. Chem., 2015, 87, 5117–5124 CrossRef CAS PubMed.
- G. Weber, J. Phys. Chem., 1981, 85, 949–953 CrossRef CAS.
- E. Gratton, D. M. Jameson and R. D. Hall, Annu. Rev. Biophys. Bioeng., 1984, 13, 105–124 CrossRef CAS PubMed.
- J. R. Lakowicz, Principles of Fluorescence Spectroscopy, Springer, New York, 3rd edn, 2006 Search PubMed.
- K. M. Hirshfield, D. Toptygin, B. S. Packard and L. Brand, Anal. Biochem., 1993, 209, 209–218 CrossRef CAS PubMed.
- A. H. A. Clayton, Q. S. Hanley and P. J. Verveer, J. Microsc., 2004, 213, 1–5 CrossRef CAS.
- M. A. Digman, V. R. Caiolfa, M. Zamai and E. Gratton, Biophys. J., 2008, 94, L14–L16 CrossRef CAS PubMed.
- C. Stringari, A. Cinquin, O. Cinquin, M. A. Digman, P. J. Donovan and E. Gratton, Proc. Natl. Acad. Sci. U. S. A., 2011, 108, 13582–13587 CrossRef CAS PubMed.
- F. Fereidouni, A. N. Bader and H. C. Gerritsen, Opt. Express, 2012, 20, 12729–12741 CrossRef CAS PubMed.
- F. Fereidouni, A. N. Bader, A. Colonna and H. C. Gerritsen, J. Biophotonics, 2014, 7, 589–596 CrossRef CAS PubMed.
- L. M. Andrews, M. R. Jones, M. A. Digman and E. Gratton, Biomed. Opt. Express, 2013, 4, 171–177 CrossRef CAS.
- M. Popleteeva, K. T. Haas, D. Stoppa, L. Pancheri, L. Gasparini, C. F. Kaminski, L. D. Cassidy, A. R. Venkitaraman and A. Esposito, Opt. Express, 2015, 23, 23511–23525 CrossRef CAS PubMed.
- N. Plotegher, C. Stringari, S. Jahid, M. Veronesi, S. Girotto, E. Gratton and L. Bubacco, FASEB J., 2015, 29, 2484–2494 CrossRef CAS PubMed.
- L. Malacrida, S. Astrada, A. Briva, M. Bollati-Fogolin, E. Gratton and L. A. Bagatolli, Biochim. Biophys. Acta, Biomembr., 2016, 1858, 2625–2635 CrossRef CAS PubMed.
- A. Dvornikov and E. Gratton, Biomed. Opt. Express, 2018, 9, 3503 CrossRef PubMed.
- T. G. Scott, R. D. Spencer, N. J. Leonard and G. Weber, J. Am. Chem. Soc., 1970, 92, 687–695 CrossRef CAS.
- R. Richards-Kortum and E. Sevick-Muraca, Annu. Rev. Phys. Chem., 1996, 47, 555–606 CrossRef CAS PubMed.
- P. Urayama and M.-A. Mycek, in Handbook of Biomedical Fluorescence, ed. M.-A. Mycek and B. W. Pogue, Marcel Dekker, New York, 2003, pp. 211–236 Search PubMed.
- A. Mayevsky and G. G. Rogatsky, Am. J. Physiol.: Cell Physiol., 2007, 292, C615–C640 CrossRef CAS PubMed.
- A. C. Croce and G. Bottiroli, Eur. J. Histochem., 2014, 58, 2461 CAS.
- Z. Long, J. Maltas, M. C. Zatt, J. Cheng, E. J. Alquist, A. Brest and P. Urayama, J. Biophotonics, 2015, 8, 247–257 CrossRef CAS PubMed.
- S. A. Siano and R. Mutharasan, Biotechnol. Bioeng., 1989, 34, 660–670 CrossRef CAS PubMed.
- D. Fu and X. S. Xie, Anal. Chem., 2014, 86, 4115–4119 CrossRef CAS PubMed.
- S. W. Brown, S. G. Oliver, D. E. F. Harrison and R. C. Righelato, Eur. J. Appl. Microbiol. Biotechnol., 1981, 11, 151–155 CrossRef CAS.
- R. P. Jones, Enzyme Microb. Technol., 1989, 11, 130–153 CrossRef CAS.
- H. N. Carlsen, H. Degn and D. Lloyd, J. Gen. Microbiol., 1991, 137, 2879–2883 CrossRef CAS PubMed.
- D. E. Griffiths and D. C. Wharton, J. Biol. Chem., 1961, 236, 1850–1856 CAS.
- A. N. Wick, D. R. Drury, H. I. Nakada and J. B. Wolfe, J. Biol. Chem., 1957, 224, 963–969 CAS.
- H. Rudney, Science, 1940, 92, 112–113 CrossRef CAS PubMed.
- F. Sun, X. Huo, Y. J. Zhai, A. J. Wang, J. X. Xu, D. Su, M. Bartlam and Z. H. Rao, Cell, 2005, 121, 1043–1057 CrossRef CAS PubMed.
- N. S. Kosower, E. M. Kosower, B. Wertheim and W. S. Correa, Biochem. Biophys. Res. Commun., 1969, 37, 593–596 CrossRef CAS PubMed.
- D. Palo, J. Maltas, L. Risal and P. Urayama, Spectrochim. Acta, Part A, 2017, 186, 105–111 CrossRef CAS PubMed.
- B. M. Bakker, K. M. Overkamp, A. J. A. van Maris, P. Kötter, M. A. H. Luttik, J. P. van Dijken and J. T. Pronk, FEMS Microbiol. Rev., 2001, 25, 15–37 CrossRef CAS PubMed.
- R. K. Tao, Y. Z. Zhao, H. Y. Chu, A. X. Wang, J. H. Zhu, X. J. Chen, Y. J. Zou, M. Shi, R. M. Liu, N. Su, J. L. Du, H. M. Zhou, L. Y. Zhu, X. H. Qian, H. Y. Liu, J. Loscalzo and Y. Yang, Nat. Methods, 2017, 14, 720–728 CrossRef CAS PubMed.
- T. S. Blacker, R. J. Marsh, M. R. Duchen and A. J. Bain, Chem. Phys., 2013, 422, 184–194 CrossRef CAS.
- W. H. Ying, Front. Biosci., 2006, 11, 3129–3148 CrossRef CAS.
Footnote |
| † Contributed equally to this work. |
| This journal is © The Royal Society of Chemistry 2018 |