 Open Access Article
Creative Commons Attribution 3.0 Unported Licence
Electrical conductivity and vibrational studies induced phase transitions in [(C2H5)4N]FeCl4
Kh. Ben Brahim,
M. Ben gzaiel,
A. Oueslati * and
M. Gargouri
Laboratory for Spectroscopic Characterization and Optics of Materials, Faculty of Sciences, University of Sfax, B. P. 1171, 3000 Sfax, Tunisia. E-mail: oueslatiabderrazek@yahoo.fr
First published on 5th December 2018
Abstract
The compound, tetraethylammonium tetrachloroferrate [(C2H5)4N]FeCl4, was prepared by slow evaporation at room temperature. It was characterized by X-ray powder diffraction, thermal analysis, and impedance and vibrational spectroscopy. X-ray diffraction data confirmed formation of a single phase material which crystallized at room temperature in the hexagonal system (P63mc space group). DSC showed the existence of two phase transitions at 413 K and 430 K. Electrical conductivity was measured in the temperature and frequency ranges of 390 K to 440 K and 40 Hz to 110 MHz, respectively. Nyquist plots revealed the existence of grains and grain boundaries that were fitted to an equivalent circuit. AC conductivity plots were analyzed by Jonscher's power law. Variations in the “s” values indicated that CBH models describe the conduction mechanism in regions I and II. Temperature dependence of Raman spectra showed that the most important changes were observed in the cationic parts ([(C2H5)4N]+). The activation energy value obtained from the line width decreased which indicated an order–disorder model.
1. Introduction
Recently, material science has mainly concentrated on multifunctional materials. Obtaining such a material in the form of solids with a continuous lattice was found to be very complicated. However, a material with a multifunctional character can be obtained by building up hybrid solids formed by two lattices consisting of organic and inorganic parts. Much attention has been paid to organic–inorganic hybrid materials due to the possibility of each moiety contributing its own characteristic properties.1–5 This large family exhibits several phase transitions related to the reorientation dynamic of alkyl chains.6–8 In fact, they present interesting properties such as ferromagnetic, ferroelectric, ferroelastic, and thermal ones.9–13Special attention is paid to compounds based on iron. Owing to the presence of the high-spin d5 in their molecules. Compounds containing tetrahalogenferrate(III) units may also be used as attractive magnetic materials.14,15 Moreover, it was found that some of the iron(III) complexes have been used in bioinorganic chemistry as substances for synthesizing model compounds, such as [Fe2S2Cl4]2−.16
With this aim, we wish to report the growth of [(C2H5)4N]FeC14 crystals, and a description of basic information about their properties. This compound is of interest due to the presence of Fe(III) in a tetrahedral coordination structure that mainly provides the existence of magnetic, electric, and elastic anomalies.17 At room temperature, the system belongs to the hexagonal system (space group P63mc) with four formulae per unit cell, which has dimensions of a = b = 8.198 Å, c = 13.183 Å.18
In this contribution, the synthesis, X-ray powder diffraction, differential scanning calorimetry, impedance measurements, and vibrational study as a function of temperature were carried out.
2. Experimental details
2.1 Synthesis
Mixing a stoichiometric molar ratio of FeCl3 (purity 98%; FLUKA) and [N(C2H5)4]Cl (purity 97%; FLUKA) was performed in aqueous solution. After few days, yellow prismatic crystals were obtained by slow evaporation at room temperature. The sequence of the chemical reaction is the following:| [(C2H5)4N]Cl + FeCl3 → [(C2H5)4N]FeCl4 |
2.2 Characterisations
Phase purity and homogeneity were checked using X-ray powder diffraction analysis. Using a Phillips PW 1710 powder diffractometer operating with CuKα (λ = 1.5405 Å), the XRD pattern was recorded in a wide range of Bragg angles (10° ≤ 2θ ≤ 60°). Structural refinements ware carried out by the Rietveld refinement method.19 Differential scanning calorimetry, DSC, was executed with a Perkin Elmer DSC-7 instrument in a temperature range from 300 K to 470 K with a 5 K min−1 rate. Thermogravimetric analysis (TGA) was performed with an ATG-Q500 SETARAM in a heating process from room temperature up to 772 K with a heating rate of 10 K min−1.To study the electrical proprieties, the [(C2H5)4N]FeCl4 powder was pressed at 5 t cm−2 ton pressure, forming a circular disc with a 1.1 mm thickness and 8 mm diameter. Measurements were executed in the frequency range of 40 Hz to 110 MHz using a 4294A impedance analyzer. The measurements were carried out under an excitation voltage of 50 mV. In the present study, we found that after several tests our pellet became softer after 430 K, which proved that these organic–inorganic crystals of tetraethylammonium tetrachloroferrate show plastic behavior at high temperature.6 Therefore, the sample is not in the form of an electrical dipole, which shows that measurement after 430 K is not possible.
Using a Perkin Elmer FT-IR 1000 spectrophotometer, the infrared spectrum of [(C2H5)4N]FeCl4 was recorded at room temperature in the frequency range of 500–3500 cm−1.
Raman scattering measurements were analyzed by a Horibe Jobin-Yvon T64000 spectrometer over the frequency range 50–3500 cm−1 with a resolution of 3 cm−1 in the temperature range 303–428 K. The program LABSPEC5 software was used for fitting the spectra with a combination of Lorentzian–Gaussian functions. The fitting procedure was performed in order to quantitatively analyze the evolution of Raman bands as a function of temperature.
3. Results and discussion
3.1 X-ray powder diffraction analysis
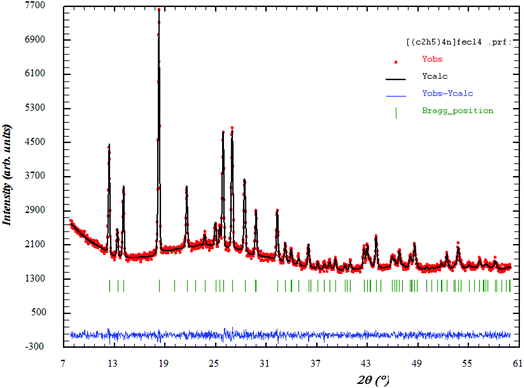
Fig. 1 shows the XRD patterns of [(C2H5)4N]FeCl4. The Rietveld refinement was performed using the FULLPROOF software program. The circles symbolize the experimental data and the line presents the simulated pattern. The purity of the studied compound was proved and the reflection peaks were indexed in the hexagonal system with the P63mc space group. The corresponding lattice parameters were found to be: a = b = 8.218 Å, c = 13.203 Å and the cell volume was V = 772.2 Å3. The quality of the refinement was evaluated through the goodness of fit where χ2 = 1.23. The values of the reliability factors obtained from the refinement are Rωp = 13.5, Rp = 18.5 and Rexp = 12.04 and the fitted parameters were found to be in a good agreement with those in the literature.183.2 Thermal analysis
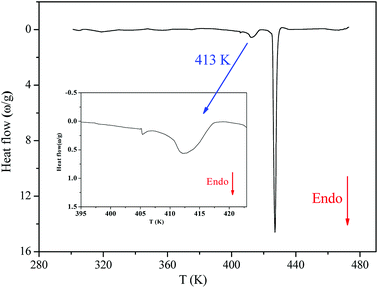
Fig. 2 shows the DSC thermogram for [(C2H5)4N]FeCl4. The DSC curve was recorded with a heating scan at 5 K min−1. The calorimetric measurement showed that the compound under investigation undergoes discontinuation of two phase transitions at T1 = 413 K and T2 = 430 K. The characteristic dynamical values of these phase transitions are listed in Table 1.| T (K) | ΔH J mol−1 | ΔS J mol−1 K−1 |
|---|---|---|
| 413 | 459 | 1.112 |
| 430 | 545 | 1.267 |
From the Boltzmann equation, (ΔS = R![[thin space (1/6-em)]](https://www.rsc.org/images/entities/char_2009.gif) ln(Ω)), where Ω is the rapport number of distinguishable orientations allowed in the high- and the low temperature phases (N1/N2).
ln(Ω)), where Ω is the rapport number of distinguishable orientations allowed in the high- and the low temperature phases (N1/N2).
The obtained values of Ω were 1.14 and 1.16 at T1 and T2, respectively (Ω1,2 < 2), which reveals that these two phase transitions are not purely “order–disorder”.20
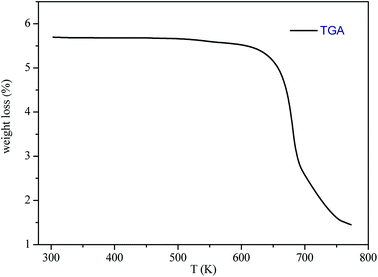
The thermogravimetric analysis (TGA) curve in Fig. 3 shows that this compound started to decompose at 615 K. Besides, no weight losses were observed between 300 and 615 K.
3.3 Electrical measurements
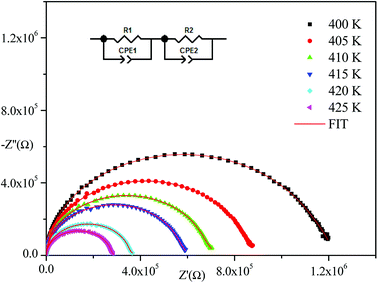
Impedance spectroscopy is one of the most suitable techniques to investigate electrical conductivity and to analyze the charge transport processes in grains, grain boundaries, and electrode effects in materials in terms of thermal and frequency ranges.21Fig. 4 displays the obtained Nyquist plots from experimental results at several temperatures. With respect to these curves, the experimental points show semi-circles where their diameters decrease with temperature increase indicating that the conduction mechanism is thermally activated.22 In addition, they are centered below the abscissa axis indicting that the relaxation process in the material is of a non-Debye type.23 (The Debye model presents the ideal response24 where all the dipoles participating in the relaxation phenomenon have the same relaxation time τ). The Nyquist diagram is a perfect semicircle centered on the abscissa axis but there are other cases where all dipoles do not have the same relaxation time (distribution of relaxation time). There are several empirical models derived from the Debye equation that correctly describe these types of relaxations including the Cole–Cole model25–27 and the Nyquist plot described by a flattened arc with its center located below the real axis on a line deviated from the angle of (1 − α)π/2 where α describes the interactions between dipoles.
Nyquist plots were analyzed using Zview Software. The best fits were obtained using an equivalent circuit (inset Fig. 4) realized by two cells which consisted of a parallel combination of bulk resistance R1 and fractal capacity CPE1 in series with a parallel combination of grain boundary resistance R2 and fractal capacity CPE2. The constant phase element (CPE) impedance is given by the following equation:28
 | (1) |
The theoretical impedance of real (Z′) and imaginary (−Z′′) parts linked to the equivalent circuit were calculated according to the following eqn (2) and (3):
 | (2) |
 | (3) |
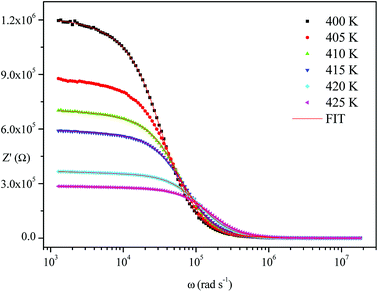
The frequency dependence of the impedance of real (Z′) and imaginary (−Z′′) at various temperatures, are depicted in Fig. 5 and 6, respectively. It was noted that the magnitude of Z′ decreased, where increases in both frequency and temperature indicated an increase in AC conductivity of the sample. At frequencies higher than 106 Hz, the coincidence of the impedance (Z′) at all temperatures showed a possible freeing of space charge29 whereas, the Z′′ peak maximum decreased with a rise in temperature. The peak frequency ωmax shifted to higher values and the later reflected a non-Debye type relaxation.30
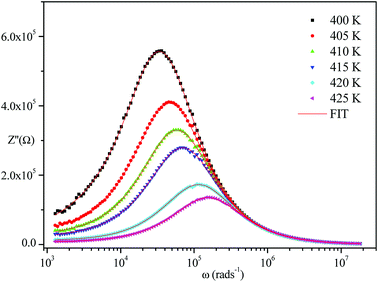 | ||
| Fig. 6 Variation of the imaginary part of impedance as a function of frequency at various temperatures. | ||
Fig. 4–6 show good conformity between experimental data and the theoretical line indicating that the equivalent circuit described the electric properties of the investigated compound quite well. As a matter of fact, details of fitted values for different temperatures are gathered in Table 2. It is obvious that all the capacitance values (Q1 and Q2) are in the range of picofarads (pF) and nanofarads (nF), respectively, implying a single semicircle response is from grain interiors and grain boundaries. The values of α vary in the range of 0.81–0.99 showing a capacitive behavior of the fractal phase CPE.31
| T (K) | R1 (×105) | Q1 (×10−11) | α1 | R2 (×104) | Q2 (×10−9) | α2 |
|---|---|---|---|---|---|---|
| 400 | 10.86 | 2.856 | 0.989 | 12.786 | 1.943 | 0.958 |
| 405 | 8.159 | 2.716 | 0.993 | 7.169 | 6.244 | 0.916 |
| 410 | 6.597 | 2.677 | 0.994 | 5.358 | 9.588 | 0.900 |
| 415 | 5.611 | 2.654 | 0.994 | 4.119 | 16.94 | 0.882 |
| 420 | 3.484 | 2.572 | 0.996 | 2.349 | 41.18 | 0.833 |
| 425 | 2.726 | 2.406 | 0.971 | 1.562 | 61.70 | 0.810 |
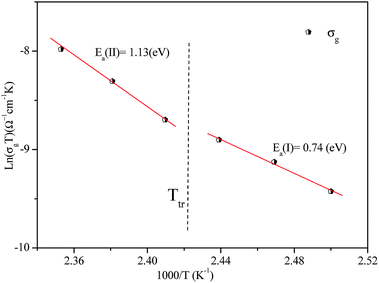
Electrical conductivity spectroscopy is a well-founded method for characterizing hopping dynamics of the charge carriers. Based on the equivalent circuit parameters, grain conductivity is expressed according to the following expression:29
 | (4) |
 | (5) |
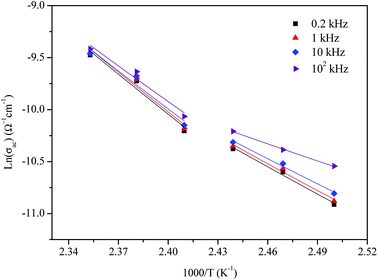
The activation energies obtained by the linear fit at T1 (413 ± 5 K) are Ea (I) = 0.74 eV in region I and Ea (II) = 1.13 eV in region II. The observed variation in the activation energies between the two temperature domains can be explained by movement of the cationic and anionic parts with temperature.32 However, the discontinuity at 413 ± 5 K agrees with the phase transition observed in the DSC measurements.
3.4 AC conductivity studies
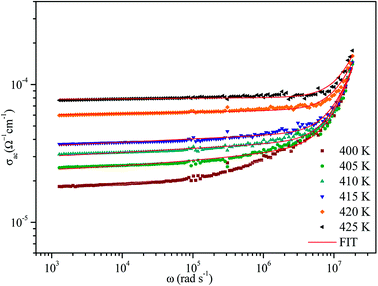
The variation of AC conductivity with angular frequency for [(C2H5)4N]FeCl4 is shown in Fig. 8 at different temperatures. Each conductivity plot exhibits two distinct regions. First, it remained almost constant at lower frequencies; this plateau corresponds to dc conductivity. It is seen that an increase of temperature is closely related to an increase of the AC conductivity which suggests that electrical conduction in the material is a thermally activated process and suggests semiconductor properties of this compound. Second, at higher frequencies, the AC conductivity dependence occurred with changes in slope and increased gradually with an increase in frequency.Besides, the dispersive region shifted to higher frequencies with an increase in temperature. This phenomenon of conductivity dispersion is generally analyzed using Jonscher's universal power law33 expressed by eqn (6):
| σac(ω) = σdc + Aωs | (6) |
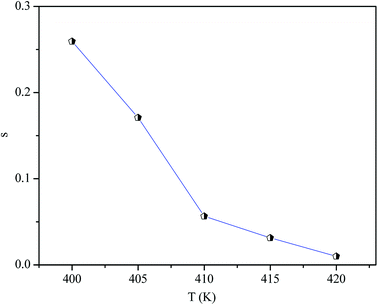
In order to identify the predominant conduction mechanism for [(C2H5)4N]FeCl4, different theoretical models proposed by Long et al. were used to correlate the conduction mechanism of AC conductivity with the predicted exponent s(T) behavior.34–37 These different models are: QMT, the quantum mechanical tunneling model, OLPT, the overlapping large polaron tunneling model, NSPT, the non-overlapping small polaron tunneling model, and CBH, the correlated barrier-hopping model. Comparing the obtained results with the extracted exponent s temperature dependence behavior (Fig. 9) for the different models, the conduction mechanism for [(C2H5)4N]FeCl4 was best interpreted with the correlated barrier hopping (CBH) model in region I and II.
According to this model of conduction38 (CBH), the thermal dependence of S, is given by eqn (7):
 | (7) |
 | (8) |
The AC conductivity as a function of frequency (σac(ω)) can be expressed according to this model39,40 by eqn (9):
 | (9) |
 | (10) |
The potential barrier WM was calculated from the linear fit of the curve (1s) as a function of temperature from eqn (8). In the general case, if WM = Ea/2, then bipolaron hopping is the dominating conduction mechanism and if WM = Ea/4, then a single polaron is dominating. The obtained values of WM are 0.12 eV in region I and 0.25 eV in region II. These values are proximate to Ea/4, which proves that single polaron hopping is the dominating conduction mechanism in the material. Temperature dependence of conductivity (ln(σac)) at different frequencies is shown in Fig. 10. There is good agreement between experimental and theoretical curves. The density of localized states (N) obtained by fit are understood between 5.45 × 1034 to 5.12 × 1032 cm−1 in region I and between 3.02 × 1032 to 3.7 × 1031 cm−1 in region II. From a qualitative analysis of these values, we noted that the density of localized states decreased with increasing frequency. This reduction is explained by an increase in the disorder which decreased stabilities of states with non-localization of the latter.41
3.5 Vibrational study at room temperature
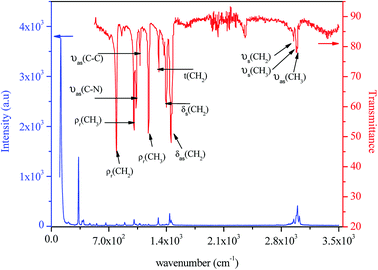
The IR and Raman spectra of tetraethylammonium tetrachloroferrate are presented in Fig. 11. Tentative assignments for a majority of the vibrational bands using previously reported data in the literature on similar compounds are: [(C2H5)4N]InBr4,42 [(C2H5)4N]SbF6,43 [(C2H5)4N]SbCl6,44 [(C2H5)4N]2CoCl4,45 [(C2H5)4N]2HgI4, [(C2H5)4N]Hg3I8,46 and [(C6H5)4P]FeCl4 (ref. 47) and are listed in Table 3.| [(C2H5)4N]FeCl4 | ||
|---|---|---|
| Raman (cm−1) | IR (cm−1) | Assignment |
| a νs, ν1: Symmetric stretching; νas, ν3: asymmetric stretching; δs, ν2: symmetric bending; δas, ν4: asymmetric bending; t: twitching; ρr: rocking. | ||
| 3022 | — | νas(CH3) |
| 2990 | 2989 | νas(CH2) |
| — | 2979 | νs(CH3) |
| 2952 | 2950 | νs(CH2) |
| 2937 | — | |
| 2890 | — | |
| 1460 | 1455 | δas(CH2) |
| 1441 | — | |
| 1400 | 1398 | δs(CH2) |
| 1353 | — | δs(CH3) |
| 1302 | 1307 | t(CH2) |
| 1185 | 1183 | ρr(CH3) |
| 1150 | — | |
| 1124 | — | |
| 1082 | 1079 | νas(C–C) |
| 1071 | — | |
| 1052 | — | |
| 1022 | 1033 | νas(C–N) |
| 1008 | 1006 | ρr(CH3) |
| 895 | — | νs(C–C) |
| 794 | 791 | ρr(CH2) |
| 665 | — | νs(N–C) |
| 554 | — | δs(CNC) |
| 516 | — | |
| 397 | — | ν3(FeCl4) |
| 379 | — | ν3(FeCl4) |
| 335 | — | ν1(FeCl4) |
| 142 | — | ν4(FeCl4) |
| 121 | — | ν2(FeCl4) |
3.6 Temperature dependence of the Raman spectra
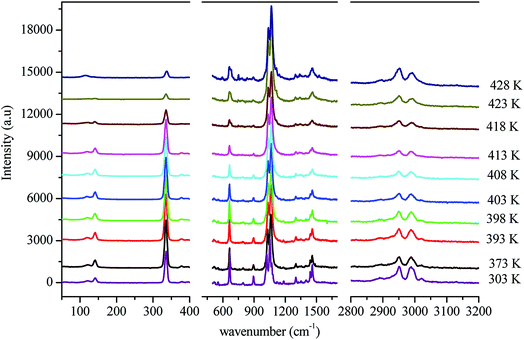
In order to gain more information on the crystal dynamics and on the mechanism involved in the transition, we undertook a vibrational study using Raman scattering between 303 and 428 K.Fig. 12 illustrates the Raman spectra of [(C2H5)4N]FeCl4 recorded in three spectral ranges ([50–400 cm−1], [500–1600 cm−1], and [2800–3200 cm−1]). A deconvolution of all spectra was necessary to follow the temperature dependence of the wavenumber and half maximum. This deconvolution was carried out by means of Labspec software with a combination of two Lorentzian and Gaussian functions.
Fig. 14(a and b) shows the temperature dependence of the position and half maximum for some bands issued from the internal modes of the anionic part [FeCl4]− observed between 50 and 400 cm−1. We noticed that this figure indicates weak changes near 418 K where the phase transition has been observed. The line at 121 cm−1 associated with ν2(FeCl4) mode underwent a shift toward high frequency by 2 cm−1, with a half maximum decrease by 5 cm−1. The two bands at 379 and 397 cm−1 attributed to ν3(FeCl4) vanished at the temperature transition.
In Fig. 13(a and b), significant changes were obtained for some peaks located in the 500–1600 cm−1 frequency range which issued from the internal modes of the cationic parts. The two bands around 554 and 1185 cm−1 assigned to the δs(CNC) and ρr(CH3), respectively, vanished after the phase transition (418 K), while three bands appeared in the vicinity of 595, 750, and 1528 cm−1 at 418 K. A large change was detected for the peak at 665 cm−1 (νs(N–C)), where it broke into two bands after 418 K. Another important change in the position was observed near 1440 and 1460 cm−1 (δas(CH2)). These two bands merged into a single line at 418 K while the half maximum of them increased to 15 cm−1 above the transition. The bands observed between 2800 and 3200 cm−1, which were assigned to the symmetric and asymmetric vibration of CH2 and CH3 groups, did not change significantly with temperature; their position and half maximum underwent weak changes (a few cm−1) which means that these modes are not directly connected to a phase transition.
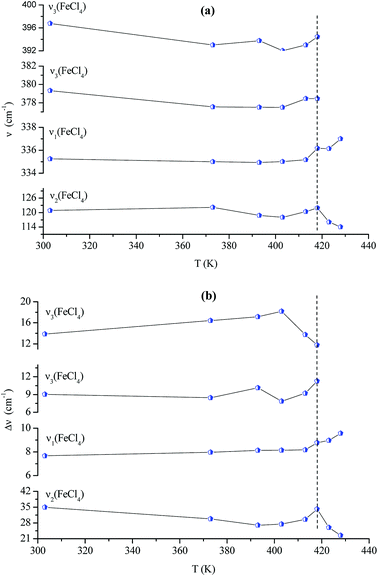 | ||
| Fig. 13 Temperature dependence of some Raman position (a) and half-maximum (b) associated with the inorganic part. | ||
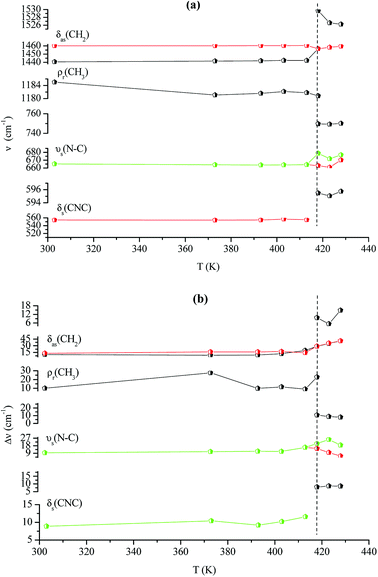 | ||
| Fig. 14 Temperature dependence of some Raman position (a) and half-maximum (b) associated with the organic part. | ||
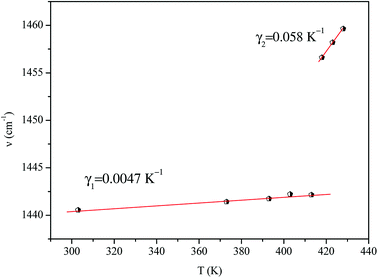
Spectral anomalies observed in Raman spectra of the [(C2H5)4N]FeCl4 crystals are due to a phase transition at T = 418 K which is in good agreement with DSC measurements and electrical proprieties. The most pronounced changes were found to be connected with vibration of the cationic part. In order to confirm the main role of the organic part in the phase transition point, we focused our study on the band around 1440 cm−1 associated with the CH2 asymmetric bending mode δas(CH2).
| ν2 = ν02[1 + γ(T − Tt)] | (11) |
 | (12) |
The thermal coefficient γ associated with variation of the crystal volume and the wavenumber is given by eqn (13):
 | (13) |
We adjusted the evolution of the frequency of the studied modes using eqn (12) in the temperature range that extends above and below the phase transition temperature (Fig. 15). The variation of the frequency shows two linear regimes, one below and the other above 418 K which confirms that this temperature is characterized by a phase transition. The value obtained from the coefficient (γ) at the level of the two temperature domains is in the order of 0.0047 K−1 for T < Ttr and 0.058 K−1 for T > Ttr. We noticed that the parameter γ depends on the frequency and it increased with an increase in temperature, which makes it possible to identify that the volume of the crystal decreases for T > Ttr.50
 | (14) |
 | (15) |
 | (16) |
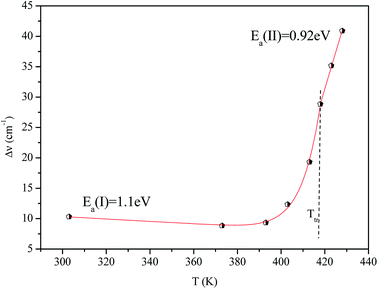
Fig. 16 shows the adjustment of the width at half maximum of the band at 1440 cm−1 using eqn (16). This variation is characterized by an enlargement at high temperature due to the reorientation dynamics of the disordered crystal. The activation energies determined from this spectrum are in the order of Ea (I) = 1.1 eV for T < Ttr and Ea (II) = 0.92 eV for T > Ttr which are in good agreement with the activation energies obtained by electrical conductivity.
The decrease of these values with increasing temperature is explained by the gradual evolution from an ordered state to a disordered phase resulting from an increase of the dynamics [(C2H5)4N]+ cation.53 This allows us to conclude that the observed phase transition is related to the reorientation dynamical disorder of the tetraethylammonium cation.
4. Conclusion
Tetraethylammonium tetrachloroferrate with a hexagonal system (P63mc space group) was prepared and investigated as a function of temperature and frequency. One phase transition at 413 K was detected by differential scanning calorimetry (DSC). Additionally, Nyquist plots revealed the existence of grains and grain boundaries that were fitted by an equivalent circuit. The AC conductivity spectrum was found to obey Jonscher's power law.The temperature dependence of the exponents s(T) indicated that a correlated barrier hopping (CBH) was the most suitable model for the conduction mechanism. Significant changes of several bands for the internal modes of the organic cation were observed within the phase transition temperature. Temperature dependence analysis of the frequency and the width of the δas(CH2) mode proved that there is an anomaly around T = 418 K, a consequence of an order–disorder phase transition. The decrease of Ea values below the order–disorder phase transition can be understood as a change in the dynamical states of the cation.
Conflicts of interest
There are no conflicts to declare.References
- D. Braga, Crystal engineering, where from? where to?, Chem. Commun., 2003, 22, 2751–2754 RSC.
- C. Sanchez, B. Julian, P. Belleville and M. Popall, Applications of hybrid organic–inorganic nanocomposites, J. Mater. Chem., 2005, 15, 3559–3592 RSC.
- Y. Heng-Yun, T. Yuan-Yuan, L. Peng-Fei, L. Wei-Qiang, G. Ji-Xing, H. Xiu-Ni, C. Hu, S. Ping-Ping, Y. Yu-Meng and X. Ren-Gen, Metal-free three-dimensional perovskite ferroelectrics, Science, 2018, 361, 151–155 CrossRef PubMed.
- L. Wei-Qiang, T. Yuan-Yuan, L. Peng-Fei, Y. Yu-Meng and X. Ren-Gen, The Competitive Halogen Bond in the Molecular Ferroelectric with Large Piezoelectric Response, J. Am. Chem. Soc., 2018, 140, 3975–3982 CrossRef PubMed.
- L. Wei-Qiang, T. Yuan-Yuan, L. Peng-Fei, Y. Yu-Meng and X. Ren-Gen, Large Piezoelectric Effect in a Lead-free Molecular Ferroelectric Thin Film, J. Am. Chem. Soc., 2017, 139, 18071–18078 CrossRef PubMed.
- J. Binns, G. J. McIntyre, J. A. Barreda-Argueso, J. Gonzalez, F. Aguado, F. Rodriguez, R. Valiente and S. Parsons, Phase transition sequences in tetramethylammonium tetrachlorometallates by X-ray diffraction and spectroscopic measurements, Acta Crystallogr., Sect. B: Struct. Sci., Cryst. Eng. Mater., 2017, 73, 844–855 CrossRef CAS PubMed.
- A. R. Lim and K.-Y. Lim, Structural changes near phase transition temperatures for the [N(C2H5)4] groups in hydrated [N(C2H5)4]2CuCl4·xH2O, J. Therm. Anal. Calorim., 2017, 130, 879–884 CrossRef CAS.
- N. Moutia, M. Ben Gzaiel, A. Oueslati and K. Khirouni, Electrical characterization and vibrational spectroscopic investigations of order–disorder phase transitions in [N(C3H7)4]2CoCl4 compound, J. Mol. Struct., 2017, 1134, 697–705 CrossRef CAS.
- A. Sen, S. Roy, S. C. Peter, A. Paul, U. V. Waghmare and S. Athinarayanan, Order–disorder structural phase transition and magnetocaloric effect in organic–inorganic halide hybrid (C2H5NH3)2CoCl4, J. Solid State Chem., 2018, 258, 431–440 CrossRef CAS.
- C. Sanchez, B. Lebeau, F. Chaput and J. P. Boilot, Optical Properties of Functional Hybrid Organic–Inorganic Nanocomposites, J. Adv. Mater., 2003, 15, 1969–1994 CrossRef CAS.
- A. Oueslati, A. Bulou, F. Calvayrac, K. Adil, M. Gargouri and F. Hlel, Infrared, polarized Raman and ab initio calculations of the vibrational spectra of [N(C3H7)4]2Cu2Cl6 crystals, Vib. Spectrosc., 2013, 64, 10–20 CrossRef CAS.
- M. Ben Gzaiel, A. Oueslati, I. Chaabane, A. Bulou, F. Hlel and M. Gargouri, Using Raman spectroscopy to understand the origin of the phase transitions observed in [(C3H7)4N]2Zn2Cl6 compound, Spectrochim. Acta, Part A, 2015, 145, 223–234 CrossRef CAS PubMed.
- M. Góśniowska, Z. Ciunik, G. Bator, R. Jakubas and J. Baran, Structure and phase transitions in tetramethylammonium tetrabromoindate(III) and tetraethylammonium tetrabromoindate(III) crystals, J. Mol. Struct., 2000, 555, 243–255 CrossRef.
- D. Wyrzykowski, R. Kruszynski, J. Kłak, J. Mrozinski and Z. Warnke, Magnetic Characteristics of Tetrabutylammonium Tetrahalogenoferrates(III): X-ray Crystal Structure of Tetrabutylammonium Tetrabromoferrate(III), Z. Anorg. Allg. Chem., 2007, 633, 2071–2076 CrossRef CAS.
- E. Coronado and P. Day, Magnetic Molecular Conductors, Chem. Rev., 2004, 104, 5419–5448 CrossRef CAS PubMed.
- D. Wyrzykowski, R. Kruszynski, J. Kłak, J. Mrozinski and Z. Warnke, Structural and magnetic characteristics of tetramethylammonium tetrahalogenoferrates(III), Inorg. Chim. Acta, 2008, 361, 262–268 CrossRef CAS.
- J. a Puertolas, R. Navarro, F. Palacio and D. Gonzalez, Ferro and antiferromagnetic ordering in N(C2H5)4FeCl4 depending on the cooling rate, J. Magn. Magn. Mater., 1983, 31, 1067–1068 CrossRef.
- Z. Warnke, E. Styczen, D. Wyrzykowski, A. Sikorski, J. Kłak and J. Mrozinski, Structural and physico-chemical characteristics of tetraethylammonium tetrachloridoferrate(III), J. Struct. Chem., 2009, 21, 285–289 CrossRef.
- J. Rodriguez-Carvajal, Recent advances in magnetic structure determination by neutron powder diffraction, Phys. B, 1993, 192, 55–69 CrossRef CAS.
- W. Trigui, A. Oueslati, I. Chaabane and F. Hlel, Synthesis, crystal structure, thermal analysis and dielectric properties of [(C4H9)4N]3Bi2Cl9 compound, J. Solid State Chem., 2015, 227, 10–16 CrossRef CAS.
- J. H. Joshi, D. K. Kanchan, M. J. Joshi, H. O. Jethvan and K. D. Parikh, Dielectric relaxation, complex impedance and modulus spectroscopic studies of mix phase rod like cobalt sulfide nanoparticles, Mater. Res. Bull., 2017, 93, 63–73 CrossRef CAS.
- N. Naveed, M. Mumtaz, R. Khan, A. A. Khan and M. Nasir khan, Conduction mechanism and impedance spectroscopy of (MnFe2O4)x/CuTl-1223 nanoparticles-superconductor composites, J. Alloys Compd., 2017, 712, 696–703 CrossRef.
- C. Yuan, X. Wu, J. Huang, X. Liu and B. Li, Electrical properties of thick film NTC thermistors based on SrFe0.9Sn0.1O3−δ, Solid State Sci., 2010, 12, 2113–2119 CrossRef CAS.
- P. Debye, Polar molecules, Dover, New York, 1929 Search PubMed.
- K. S. Cole and R. H. Cole, J. Chem. Phys., 1941, 9, 34 CrossRef.
- D. W. Davidson and R. H. Cole, J. Chem. Phys., 1951, 19, 1484 CrossRef CAS.
- S. Havriliak and S. Negami, J. Polym. Sci., Part C: Polym. Symp., 1966, 14, 99 CrossRef.
- T. Rhimi, M. Toumi, K. Khirouni and S. Guermazi, AC conductivity, electric modulus analysis of KLi(H2PO4)2compound, J. Alloys Compd., 2017, 714, 546–552 CrossRef CAS.
- B. Banarji, P. Nayak and R. N. P. Choudhary, Impedance spectroscopy study of NaBa2V5O15 ceramic, J. Alloys Compd., 2007, 436, 226–232 CrossRef.
- P. S. Anantha and K. Hariharan, Structure and ionic transport studies of sodium borophosphate glassy system, Mater. Chem. Phys., 2005, 89, 428–437 CrossRef CAS.
- A. Elferjani, S. Garcia-Granda and M. Dammak, Synthesis, crystal structure, thermal analysis, dielectric properties and electrical conduction mechanisms of the new mixed solid solution of thallium rubidium sulfate selenate tellurate, J. Alloys Compd., 2018, 749, 448–464 CrossRef CAS.
- S. Hajlaoui, I. Chaabane, A. Oueslati and K. Guidara, Electrical transport properties and modulus behavior of the organic–inorganic [N(C3H7)4]2SnCl6 compound, Phys. B, 2015, 474, 90–96 CrossRef CAS.
- A. K. Jonscher, Universal Relaxation Law, Chelsea Dielectrics Press, London, 1996 Search PubMed.
- L. Zhang, J. Wang, F. Han, S. Mo, F. Long and Y. Gao, Crystal structure and electrical conduction of the new organic–inorganic compound (CH2)2(NH3)2CdI4, J. Mol. Struct., 2018, 1156, 450–456 CrossRef CAS.
- A. Ghosh, Frequency-dependent conductivity in bismuth-vanadate glassy semiconductors, Phys. Rev. B: Condens. Matter Mater. Phys., 1990, 41, 1479–1488 CrossRef CAS.
- R. Long, Frequency-dependent loss in amorphous semiconductors, J. Adv. Phys., 1982, 31, 553–637 CrossRef.
- S. R. Elliot, A.c. conduction in amorphous chalcogenide and pnictide semiconductors, J. Adv. Phys., 1987, 36, 135–217 CrossRef.
- R. Megha, S. Kotresh, Y. T. Ravikiran, C. H. V. V. Ramana, S. C. Vijaya Kumari and S. Thomas, Study of alternating current conduction mechanism in polypyrrole-magnesium ferrite hybrid nanocomposite through correlated barrier hopping model, Compos. Interfaces, 2016, 24, 55–68 CrossRef.
- A. Zolanvari, N. Goyal and S. K. Tripathi, Electrical properties of a-GexSe100−x, Pramana, 2004, 63, 617–625 CrossRef CAS.
- R. Ben Said, B. Louati and K. Guidara, Electrical properties and conduction mechanism in the sodium nickel diphosphate, Ionics, 2013, 20, 703–711 CrossRef.
- N. F. Mott and E. A. Davis, Electronic Processes in Non-Crystalline Materials, Clarendon Press, Oxford, 2nd edn, 1979 Search PubMed.
- M. Góśniowskaa, Z. Ciunika, G. Batora, R. Jakubasa and J. Bara, Structure and phase transitions in tetramethylammonium tetrabromoindate(III) and tetraethylammonium tetrabromoindate(III) crystals, J. Mol. Struct., 2000, 555, 243–255 CrossRef.
- W. H. J. De Beer and A. M. Heyns, The I.R. and Raman spectra of tetraethylammonium hexafluoroantimonate (C2H5)4NSbF6, Spectrochim. Acta, Part A, 1981, 37, 1099–1107 CrossRef.
- T. Zeegers-Huyskens and G. Bator, Fourier transform infrared and Fourier transform Raman investigation of alkylammonium hexachloroantimonates, Vib. Spectrosc., 1996, 13, 41–49 CrossRef CAS.
- M. A. Kandhaswamy and V. Srinivasan, Synthesis and characterization of tetraethylammonium tetrachlorocobaltate crystals, Bull. Mater. Sci., 2002, 25, 41–45 CrossRef CAS.
- A. Hooper and D. W. James, Vibrational spectra of crystalline halomercurate(II) complexes, Aust. J. Chem., 1971, 24, 1331–1344 CrossRef.
- G. P. Bhavsar and K. Sathianandan, Vibrational analysis of tetrahaloferrates of the type FeCl4−nBr−1n, J. Mol. Struct., 1973, 6, 343–345 CrossRef.
- P. d. R. Andradet and S. P. S. Porto, Hard core phonon frequency at transition temperature, Solid State Commun., 1974, 14, 547–550 CrossRef.
- V. Venkataramanan and M. R. Srinivasan, Vibrational spectroscopic study of zinc tris(thiourea) sulphate, a new organometallic non-linear optical crystal, J. Raman Spectrosc., 1994, 25, 805–811 CrossRef CAS.
- M. Oussaid, P. Becker and C. C. Nedelec, Raman scattering investigation of order–disorder phase transitions in cadmium tris(thiourea) sulphate (CTS), J. Raman Spectrosc., 2000, 31, 529–533 CrossRef CAS.
- A. M. Amorim da Costa, A. M. Amado, M. Becucci and C. Kryschi, Order–disorder phase transition in p-terphenyl and p-terphenyl: tetracene doped crystals as studied by Raman spectroscopy, J. Mol. Struct., 1997, 416, 69–73 CrossRef CAS.
- G. Bator, R. Jakubas and J. Baran, Vibrational study of the structural phase transitions in the (CH3ND3)3Sb2Br9 (d-MABA) crystals by infrared spectroscopy, Vib. Spectrosc., 2001, 25, 101–113 CrossRef CAS.
- N. Weslati, I. Chaabane and F. Hlel, Raman investigation of the order–disorder phase transitions in the 2[N(C3H7)4]SbCl4 compound, Vib. Spectrosc., 2015, 81, 90–95 CrossRef CAS.
| This journal is © The Royal Society of Chemistry 2018 |

