 Open Access Article
Sword-like CuO/CeO2 composites derived from a Ce-BTC metal–organic framework with superior CO oxidation performance†
Yin Wanga,
Yiqiang Yanga,
Ning Liua,
Yuxin Wangb and
Xiaodong Zhang *a
*a
aSchool of Environment and Architecture, University of Shanghai for Science and Technology, Shanghai 200093, China. E-mail: fatzhxd@126.com; zhangxiaodong@usst.edu.cn; Fax: +86 021 55275979; Tel: +86 15921267160
bInstitute of Applied Biotechnology, Taizhou Vocation & Technical College, Taizhou, Zhejiang 318000, China
First published on 25th September 2018
Abstract
Porous shape-controllable metal oxide composites derived from a metal–organic framework have gained more and more attention due to their extensive applications. In this paper, sword-like CuO/CeO2 composites were successfully synthesized by calcination of a strawsheave-like Ce-based metal–organic framework (Ce-BTC) containing suitable Cu loading as self-sacrificial templates at 500 °C. Moreover, sword-like CuO/CeO2 composites displayed superior catalytic performance for CO oxidation, which was ascribed to a good interfacial contact, easily reducible surface copper species at low temperature and abundant surface lattice oxygen species, more Cu+ and oxygen vacancies.
1. Introduction
Metal–organic frameworks (MOFs), made up of inorganic metal ions bridged by organic ligands in tridimensional arrangements, have received much attention due to their superior physiochemical parameters and a series of underlying applications in gas storage and separation,1,2 catalysis3,4 and photocatalysis.5–8 Remarkably, high surface areas and a variety of open channels and nanosized cavities existing in MOFs can permit small molecules to access and escape, resulting in MOFs as perfect precursors or templates to synthesize unique structural metal oxide nanoparticles. A series of porous metal oxides, such as manganese oxide,9 copper oxide,10,11 iron oxide,12 cerium oxide13,14 and cobalt oxide,15 are synthesized by direct pyrolysis of a MOFs precursor. In addition, some porous metal oxide composites are also successfully prepared.16–18 Compared with other methods, the surface area, particle size and morphology of porous metal oxide and metal oxides composites can be validly regulated.Recently, owing to unique physicochemical properties, low cost and high catalytic performance, a series of CuO/CeO2 catalysts were synthesized by thermal annealing treatment of MOFs.19–22 At present, in order to synthesize CuO/CeO2 catalysts, Cu or Ce metal salt was incorporated into the Ce or Cu MOFs by impregnation method. It was found that irregular CuO/CeO2 aggregated nanocrystals formed through direct calcination of MOFs dipping metal salts. Interestingly, the morphology of CuO/CeO2 catalysts was poor. Previous studies indicated that the size and shape of morphology played crucial roles on the determination of physicochemical properties.23 Therefore, it is necessary to find a method to synthesize CuO/CeO2 catalysts derived from MOFs with various controlled and shaped morphology and high catalytic performance.
The CO oxidation reaction is an important subject for the environmental protection, and has widespread applications in air purification.9 In addition, the catalytic oxidation of CO has been known as a typical probe reaction to study the relationship between the structure and catalytic performance of catalysts.13 Therefore, in this paper, our aim is to synthesize CuO/CeO2 catalysts with certain morphology derived from MOFs using the improvement of catalytic performance for CO oxidation. Here, we report a high efficient and facile synthesis of sword-like CuO/CeO2 composites derived from Ce based metal–organic framework containing a suitable Cu loading (CuCe-BTC) as self-sacrificial templates at 500 °C. The effect of Cu loading on the structure and catalytic activity of CuO/CeO2 composites is studied. It is found that sword-like CuO/CeO2 composites displayed superior catalytic performance for CO oxidation, which was ascribed to easily low temperature reducible surface copper species and abundant surface lattice oxygen species, more Cu+ and oxygen vacancies.
2. Experimental
2.1 Catalysts preparation
CuCe-BTC materials with different Cu loading were synthesized via in situ solvothermal method. 0.63 g H3BTC, 2.17 g Ce(NO3)3·6H2O, and a certain amount of Cu(NO3)2·3H2O (weight loading of 2%, 5%, 10%, 20% based on total weight of CuCe-BTC) dissolved in 50 mL ethanol under stirring. Then, the mixed solution was sealed in a 100 mL Teflon-lined stainless steel autoclave and heated at 130 °C for 24 h. Cooled to room temperature naturally, the sample were filtered by centrifugation, washed by centrifugal with ethanol for several times, and dried in vacuum at 80 °C for 12 h to prepare CuCe-BTC materials. The prepared CuCe-BTC materials were named as CuCeBTC-x, where x is the Cu content. Finally, all CuCe-BTC materials were calcined in air at 500 °C for 2 h. The obtained CuO/CeO2 catalysts were named as CuCeO-x, where x is the Cu content.2.2 Catalysts characterization
X-ray powder diffraction (XRD) experiments were performed by a Bruker D8 Advance X-ray diffractometer with a Copper Kα radiation monochromatic detector, which with accelerating voltage of 40 kV and emission current 40 mA, and the sample was scanned in the range between 10° and 80° with a scan rate of 5° min−1. N2 adsorption–desorption isotherms were gotten on a Quantachrome autosorb-iQ-2MP. The specific surface area was calculated using the Brunauer–Emmett–Teller (BET) method and the pore size distribution curves were determined from the adsorption branches calculated by the Barrett–Joyner–Halenda (BJH) method. Transmission electron microscopy (TEM) images were obtained by using a JEM 2100 instrument with an acceleration voltage of 200 kV. H2-temperature programmed reduction (H2-TPR) experiments were performed with a ChemBET TPR/TPD under 10 vol% H2 flow diluted with Ar gas. The samples (50 mg) were reduced in a flow of H2/Ar mixture. The temperature was increased from room temperature to 850 °C at a heating rate of 10 °C min−1. X-ray photoelectron spectroscopy (XPS) data were recorded by ThermoFisher with Al Kαsource, and the binding energies were calibrated internally by the carbon deposit C 1s binding energy (BE) at 284.6 eV. Inductively coupled plasma optical emission spectroscopy (ICP-OES) was used to determine the content of Cu in the synthesized samples, which was performed on Optima 8000PE. TG analysis was measured on a Perkin Elmer STA8000 thermal analyzer.2.3 Catalytic activity measurements
CO oxidation activity measurements were carried out in a fixed-bed flow reactor (6 mm outer diameter) at the atmospheric pressure and with 0.1 g catalysts (20–40 mesh). The reactants were fed with a volume ratio of He/CO/O2 = 79/1/20 (a total flow rate of 30 ml min−1) controlled by independent thermal mass flow controllers. The CO conversion was analyzed after 30 min of the reaction by using on-line gas chromatograph (GC 2060) with a thermal conductivity detector (TCD) equipped with 5A molecular sieve column (length: 3 m, inner diameter: 3 mm).In this paper, the CO conversion was calculated from the change of the CO concentration:
3. Results and discussion
3.1 Synthesis and characterization of CuO/CeO2 samples
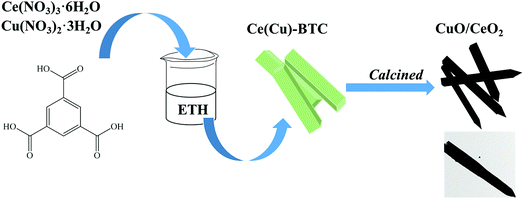
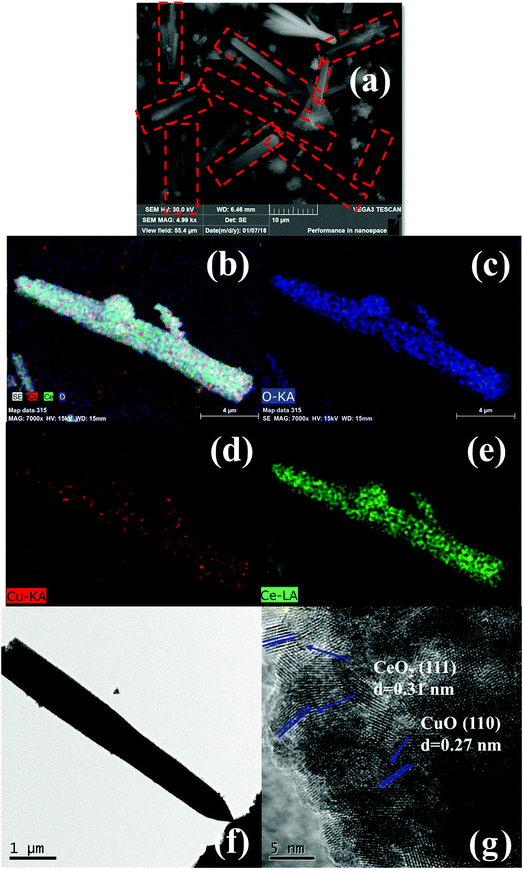
Here, we report a high efficient and facile synthesis of sword-like CuO/CeO2 composites derived from Ce based metal–organic framework containing a suitable Cu loading (CuCe-BTC) as self-sacrificial templates at 500 °C. Remarkably, CuCe-BTC is prepared by in situ synthesis method, that is, Cu precursor is added into the mixture solution in the preparation process of Ce-BTC (Scheme 1). Firstly, the rod precursor CuCe-BTC with different widths at both ends is prepared; then, sword-like CuO/CeO2 composites is synthesized through direct decomposition of CuCe-BTC with air at 500 °C. Our previous studies prepared straw-sheaves Ce-BTC and found hydrothermal temperatures and times strongly affected the morphology of Ce-BTC.14 Here, it is found that the addition of Cu affects the structure and the morphology of Ce-BTC. With the increase of Cu loading, the diffraction peak of Ce-BTC becomes weak (Fig. S1†). When Cu loading reaches 20%, the diffraction peak of Ce-BTC disappears and diffraction peaks of Cu-BTC are detected. The thermogravimetric analysis also proves that the Cu loading of MOFs gradually increases, because the weight loss becomes less (Fig. S2†). Moreover, the addition of Cu is conducive to the removal of solvent ethanol and the formation of micropores (Fig. S3†), consequently improving the BET (Table S1†). In addition, with the increase of Cu loading, straw-sheaves morphology of Ce-BTC disappears (Fig. S4†). The addition of suitable Cu loading is favour to the formation of rod morphology. Because one end of the rod morphology of CuCe-BTC comes from the head of the straw-sheaves, the calcination process makes it easier to decomposition and forms the sword shape. Importantly, sword-like CuO/CeO2 composites displays superior catalytic performance for CO oxidation (T100 = 100 °C). For convenience, as-prepared CuCe-BTC and the CuO/CeO2 composites prepared by thermal treatment CuCe-BTC with air at 500 °C are defined as CuCe-BTC-x and CuCeO-x, respectively, where x is Cu loading.During the thermal treatment process, as-prepared CuCe-BTC containing a suitable Cu loading could turn into sword-like CuO/CeO2 composites. Fig. 1(a) shows representative SEM images of the synthesized CuCeO-5. The CuCeO-5 almost remains rod-like shape of as-synthesized CuCe-BTC-5. Moreover, the EDS elemental mapping (Fig. 1(b–e)) indicate that Cu and Ce elements are evenly distributed throughout CuCeO-5. Importantly, it is clearly from EDS elemental mapping seen that the width of the rod decreases from one end to the other. Further TEM results also prove that the morphology of CuCeO-5 is sword-like (Fig. 1(f)). Because one end of the sword is small, it is difficult to see from SEM. High-resolution TEM (HRTEM) image of CuCeO-5 is displayed in Fig. 1(h). The interlayer distance between adjacent planes is calculated to be 0.27 nm and 0.31 nm, which can be indexed to the (110) and (111) crystal planes of CuO and CeO2, respectively.11,14 The BET surface area of CuCeO-5 is measured from the results of N2 adsorption–desorption isotherm, which shows a relatively specific surface of 49 m2 g−1 (Fig. S5†). Although the BET of all CuCe-BTC is higher than Ce-BTC, BET of all CuO/CeO2 catalysts is lower than CeO2. This is because CuO mainly dispersed on the surface of CeO2, resulting in the decrease of BET. Moreover, two mainly pore size distribution is also found (Fig. S5†), which further reveals CuCeO-5 have microporous and mesoporous structure. Cu loading of all samples are measured by ICP-OES (Table 1). Although the value is different from the theoretical value, the overall deviation is not large.
| Catalysts | Cua (%) | BETb (m2 g−1) | Vc (cm3 g−1) | Dd (nm) | Ce3+e (%) | VOe (%) | Cu2+/Cu+/0e | Olatte (%) | Isat/Ippe |
|---|---|---|---|---|---|---|---|---|---|
| a Cu weight ratio (wt%) determined by ICP analysis.b BET specific surface.c The pore volume, measured at P/P0 = 0.994.d The mean grain size calculated from CeO2 (111) plane by Scherrer's equation.e Calculated by XPS. | |||||||||
| CuCeO-2 | 1.75 | 42 | 0.09 | 8.4 | 13.6 | 3.4 | 1.08 | 60.3 | 0.54 |
| CuCeO-5 | 3.68 | 49 | 0.11 | 7.4 | 20.2 | 5.1 | 0.43 | 72 | 0.37 |
| CuCeO-10 | 7.84 | 45 | 0.08 | 7.9 | 20 | 5 | 0.59 | 69 | 0.44 |
| CuCeO-20 | 16.19 | 54 | 0.13 | 8.2 | 19.1 | 4.8 | 0.85 | 64 | 0.49 |
| CeO2 (ref. 2) | — | 74 | 0.27 | 9.78 | 9.7 | 2.4 | — | — | — |
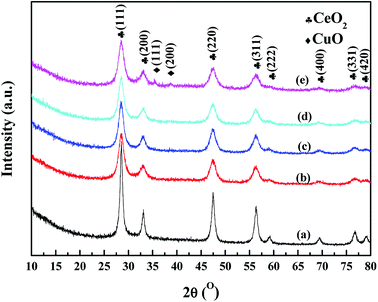
Fig. 2 displayed the XRD patterns of CuO/CeO2 catalysts with different Cu loading. All samples both exhibit the fluorite type cubic CeO2 phase.14 It is found that the diffraction peaks of all CuO/CeO2 catalysts become weak in comparison to CeO2, indicating that additive Cu species is conducive to the dispersion of CeO2. When a certain amount of Cu is added (CuCeO-5, CuCeO-10, CuCeO-15), no peaks of copper species are observed. Further increasing Cu loading to 20% (CuCeO-20), two weak diffraction peak at 36.5° and 42.4°, which correspond to the (111) and (200) lattice planes of CuO.10,11
The surface composition and elemental chemical states of CuO/CeO2 catalysts are performed by XPS (Fig. 3). Fig. 3(a) shows the XPS spectra of Ce 3d. Eight components from four pairs of spin–orbit doublets are observed. The peaks of 3d3/2 level of Ce4+ in binding energy (BE) at 900.4, 906.5 and 916.4 eV are marked as u1, u2 and u3, respectively.24–26 The peaks of Ce 3d5/2 level of Ce4+ in BE at 882.0, 888.4 and 897.9 eV are labelled as ν1, ν2 and ν3, respectively.24–26 In addition, the peaks labelled as ν0 (884.5 eV) and u0 (903.0 eV) are attributed to Ce3+ species. Therefore, the relative content of Ce3+ is calculated as follows.27
| [Ce3+] = A(Ce3+)/A(Ce3+ + Ce4+) |
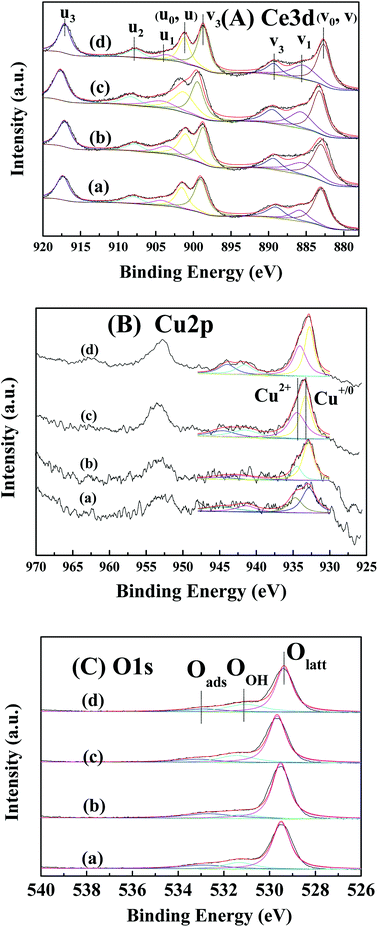 | ||
| Fig. 3 Ce 3d (A), Cu 2p (B) and O 1s (C) XPS spectra of CuCeO-2 (a), CuCeO-5 (b), CuCeO-10 (c) and CuCeO-20 (d). | ||
Then, the corresponding oxygen vacancy concentration is evaluated as follows.27
| [VO] = 1 − (3[Ce3+] + 4[Ce4+])/4 |
Above results are presented in Table 1 and S2. † Among all CuO/CeO2 catalysts, CuCeO-5 has most oxygen vacancy and Ce3+ content. The Cu 2p spectra of CuO/CeO2 catalysts are displayed in Fig. 3(b). Two peaks corresponding to Cu 2p3/2 and Cu 2p1/2 are found. The Cu 2p3/2 peak is resolved into two peaks in BE at 932.1 and 934.1 eV, which is attributed to surface Cu+/Cu0 and Cu2+ species, respectively.11 Obviously, CuCeO-5 displays a lower Cu2+/Cu+/0 molar ratio than other four catalysts. In addition, the intensity ration of the satellite peaks to the principal peaks determinates the reduced degree of Cu species (Isat/Ipp = 0.57 in bulk CuO).22 As shown in Table 1 and S2, † CuCeO-5 has lowest the value of the intensity ratio (Isat/Ipp = 0.37) than other four catalysts, which indicates the reduced degree of Cu species is highest. Fig. 3(c) exhibits the XPS spectra of O 1s. Three different peaks at the BE of 533.6, 531.6 and 529 eV are ascribed to surface adsorbed oxygen species (Oads), surface hydroxyl oxygen species (OOH), and surface lattice oxygen (Olatt), respectively.28–33 It is found that the concentration of lattice oxygen Oads/(Olatt + OOH) of CuCeO-5 is highest than other three CuO/CeO2 catalysts.
In order to study the redox properties, H2-TPR results of CuO/CeO2 catalysts are displayed in Fig. 4(a). The H2 consumption of CuO/CeO2 catalysts are evaluated and depicted in Table S3.† Three reduction peaks of CuO species (α, β and γ) are observed for all CuO/CeO2 catalysts.34 The α peak is ascribed to the highly dispersed copper oxide, which has a doughty interaction with ceria support.34 The β peak and γ peak are attributed to the reduction of copper oxide particles associated with ceria and bulk CuO, respectively.34 Compared with other three CuO/CeO2 catalysts, the α and β peak of CuCeO-5 have obviously shifts toward low temperature, which indicate that CuCeO-5 has a strong interaction with ceria support.
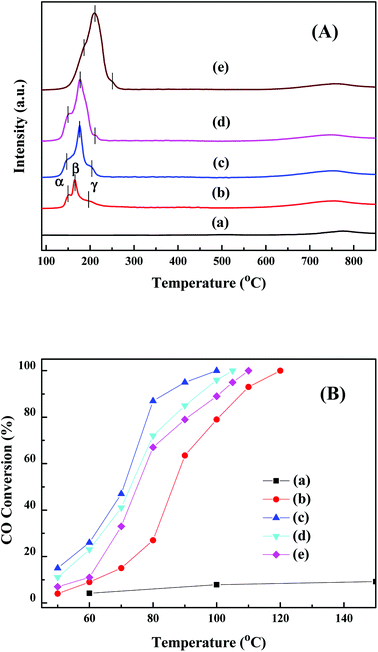 | ||
| Fig. 4 H2-TPR (A) and catalytic activities (B) for CO oxidation of CeO2 (a), CuCeO-2 (b), CuCeO-5 (c), CuCeO-10 (d) and CuCeO-20 (e). | ||
3.2 Catalytic properties of CuO/CeO2 samples
Fig. 4(b) shows the catalytic activities for CO oxidation of CeO2 and CuO/CeO2 catalysts. Blank CeO2 displays a weak catalytic performance. Remarkably, the catalytic activity of CuCeO-5 is higher than that of other three CuO/CeO2 catalysts. The catalytic activity follows the order: CuCeO-5 (T100 = 100 °C) > CuCeO-10 (T100 = 105 °C) > CuCeO-20 (T100 = 110 °C) > CuCeO-2 (T100 = 120 °C). This means that sword-like CuCeO-5 catalyst shows higher activity than three other CuO/CeO2 catalysts with irregular morphology, which may be attributed to a good interfacial contact within sword-like CuCeO-5 catalyst formed after calcining the original CuCe-BTC containing a certain amount of Cu. Previous studies indicated that copper doped ceria nanorods derived MOFs displayed higher performance than copper doped ceria nanobundles because nanorod morphology could be provide a good interfacial contact within each CeO2:Cu2+ nanoparticle.21 In addition, compared with previous CuO/CeO2 catalysts derived from metal–organic frameworks,20,21,35 our sword-like CuCeO-5 catalyst displays high catalytic performance for CO oxidation (Table S4†). XRD and TEM of the used sword-like CuCeO-5 catalyst are measured. It is found that the XRD result of sword-like CuCeO-5 catalysts before and after reaction for CO oxidation is almost unchanged (Fig. S6†). Moreover, the morphology of CuCeO-5 catalysts after reaction is still sword-like (Fig. S7†). Therefore, structure of sword-like CuCeO-5 catalyst has good stability. In addition, a better stability and reusability for CO oxidation of all four CuO/CeO2 catalysts derived from MOFs is found. The activity of all four samples remained at 100% conversion in 48 hours at T100, respectively. After three successive cycles (Fig. S8†), T100 of all third cycles for all four samples is almost exactly the same. Moreover, compared with three other catalysts, sword-like CuCeO-5 catalyst at high space velocities still shows high catalytic performance for CO oxidation (Fig. S9†). Our XPS and H2-TPR results show that sword-like CuCeO-5 indicates the more oxygen vacancy, Cu+ content, surface lattice oxygen species and easily low temperature reducible surface copper species, which is consistent with their catalytic activity for CO oxidation. Moreover, the catalytic activity for CO oxidation has a similar trend with oxygen vacancies and surface lattice oxygen for all CuO/CeO2 catalysts, indicating that surface lattice oxygen and oxygen vacancies are mainly active oxygen species for CO oxidation. In addition, CuCeO-5 shows low BET (49 m2 g−1). This result indicates that BET is not the determinants for CO oxidation, which is consistent with our previous studies.9,11 Li et al. reported that the catalytic activity of CuCe nanorods derived from MOFs for CO oxidation is higher than CuCe nanobundles, which could be attributed to the high BET – high BET means high CO adsorption and CO conversion rate.21 Here, it is believed that sword-like CuCeO-5 composite can bring easily low temperature reducible surface copper species and abundant surface lattice oxygen species, more Cu+ and oxygen vacancies, thereby improving the catalytic performance.4. Conclusion
In conclusion, a series of CuO/CeO2 catalysts are synthesized by a high efficient and method, regulating the Cu additive loading. The Cu additive loading of Ce-BTC strongly effects on the structure and catalytic activities for CO oxidation of CuO/CeO2 catalysts. It is found that sword-like CuO/CeO2 composites are successfully prepared by calcination of straw-sheave like Ce-BTC containing a suitable Cu loading as self-sacrificial templates at 500 °C. The catalytic activity shows that the excellent catalytic activity for CO oxidation of sword-like CuCeO-5 can be ascribed to a good interfacial contact, easily low temperature reducible surface copper species and abundant surface lattice oxygen species, more Cu+ and oxygen vacancies. Importantly, this facile approach reported in this work can be facilely and universal expand to other metal oxides composites, preparing various MOFs based metal oxides composites.Conflicts of interest
There are no conflicts to declare.Acknowledgements
This work was sponsored financially by the National Natural Science Foundation of China (No. 21507086, 21806107, 21507109, 51508327, 41673093) and Shanghai Sailing Program (16YF1408100).References
- M. P. Suh, H. J. Park, T. K. Prasad and D. W. Lim, Chem. Rev., 2012, 112, 782–835 CrossRef PubMed.
- J. Jelic, D. Denysenko, D. Volkmer and K. Reuter, New J. Phys., 2013, 11, 5326–5333 Search PubMed.
- M. Yoon, R. Srirambalaji and K. Kim, Chem. Rev., 2012, 2, 1196–1231 CrossRef PubMed.
- X. D. Zhang, H. X. Li, X. T. Lv, J. C. Xu, Y. X. Wang, C. He, N. Liu, Y. Q. Yang and Y. Wang, Chem.–Eur. J., 2018, 24, 8822–8832 CrossRef PubMed.
- N. Liu, W. Y. Huang, X. D. Zhang, L. Tang, L. Wang, Y. X. Wang and M. H. Wu, Appl. Catal., B, 2018, 221, 119–128 CrossRef.
- W. Y. Huang, C. W. Jing, X. D. Zhang, J. Q. Lei, M. H. Wu, L. Tang and N. Liu, Chem. Eng. J., 2018, 349, 603–612 CrossRef.
- W. Y. Huang, N. Liu, X. D. Zhang, M. H. Wu and L. Tang, Appl. Surf. Sci., 2017, 425, 107–116 CrossRef.
- X. D. Zhang, Y. Yang, W. Y. Huang, Y. Q. Yang, Y. X. Wang, C. He, N. Liu, M. H. Wu and L. Tang, Mater. Res. Bull., 2018, 99, 349–358 CrossRef.
- X. D. Zhang, H. X. Li, F. L. Hou, Y. Yang, H. Dong, N. Liu, Y. X. Wang and L. F. Cui, Appl. Surf. Sci., 2017, 411, 27–33 CrossRef.
- Y. Q. Yang, H. Dong, Y. Wang, C. He, Y. X. Wang and X. D. Zhang, J. Solid State Chem., 2018, 258, 582–587 CrossRef.
- Y. Q. Yang, H. Dong, Y. Wang, Y. X. Wang, N. Liu and X. D. Zhang, Inorg. Chem. Commun., 2017, 86, 74–77 CrossRef.
- L. F. Cui, D. Zhao, Y. Yang, Y. X. Wang and X. D. Zhang, J. Solid State Chem., 2017, 247, 168–172 CrossRef.
- X. D. Zhang, F. L. Hou, H. X. Li, Y. Yang, Y. X. Wang, N. Liu and Y. Q. Yang, Microporous Mesoporous Mater., 2018, 259, 211–219 CrossRef.
- X. D. Zhang, F. L. Hou, Y. Yang, Y. X. Wang, N. Liu, D. Chen and Y. Q. Yang, Appl. Surf. Sci., 2017, 423, 771–779 CrossRef.
- N. Liu, P. Tao, C. W. Jing, W. Y. Huang, X. D. Zhang, M. H. Wu, J. Q. Lei and L. Tang, J. Mater. Sci., 2018, 53, 15051–15063 CrossRef.
- Y. J. Luo, Y. B. Zheng, J. C. Zuo, X. S. Feng, X. Y. Wang, T. H. Zhang, K. Zhang and L. L. Jiang, J. Hazard. Mater., 2018, 349, 119–127 CrossRef PubMed.
- X. D. Zhang, Y. Yang, L. Song, Y. X. Wang, C. He, Z. Wang and L. F. Cui, Mol. Catal., 2018, 447, 80–89 CrossRef.
- X. D. Zhang, Y. Yang, X. T. Lv, Y. X. Wang and L. F. Cui, Catalysts, 2017, 7, 382 CrossRef.
- C. L. Zhu, T. Ding, W. X. Gao, K. Ma, Y. Tian and X. G. Li, Int. J. Hydrogen Energy, 2017, 42, 17457–17465 CrossRef.
- J. M. Zamaro, N. C. Perez, E. E. Miró, C. Casado, B. Seoane and C. Téllez, Chem. Eng. J., 2012, 195–196, 180–187 CrossRef.
- S. L. Li, N. L. Wang, Y. H. Yue, G. S. Wang, Z. Zu and Y. Zhang, Chem. Sci., 2015, 6, 2495–2500 RSC.
- C. Chen, R. Wang, P. Shen, D. Zhao and N. Zhang, Int. J. Hydrogen Energy, 2015, 40, 4830–4839 CrossRef.
- Y. F. Jian, M. Ma, C. W. Chen, C. Liu, Y. K. Yu, Z. P. Hao and C. He, Catal. Sci. Technol., 2018, 8, 3863–3875 RSC.
- Z. Hu, S. Qiu, Y. You, Y. Guo, Y. L. Guo, L. Wang, W. C. Zhan and G. Z. Lu, Appl. Catal., B, 2018, 225, 110–120 CrossRef.
- X. L. Weng, P. F. Sun, Y. Long, Q. J. Meng and Z. B. Wu, Environ. Sci. Technol., 2017, 51, 8057–8066 CrossRef PubMed.
- Z. Hu, Z. Wang, Y. Guo, L. Wang, Y. L. Guo, J. S. Zhang and W. C. Zhan, Environ. Sci. Technol., 2018, 52, 9531–9541 CrossRef PubMed.
- S. Q. Chen, L. P. Li, W. B. Hu, X. S. Huang, Q. Li, Y. S. Xu, Y. Zuo and G. S. Li, ACS Appl. Mater. Interfaces, 2015, 7, 22999–23007 CrossRef PubMed.
- D. M. Meng, Q. Xu, Y. L. Jiao, Y. Guo, Y. L. Guo, L. Wang, G. Z. Lu and W. C. Zhan, Appl. Catal., B, 2018, 221, 652–663 CrossRef.
- C. He, Z. Y. Jiang, M. Ma, X. D. Zhang, M. Douthwaite, J. W. Shi and Z. P. Hao, ACS Catal., 2018, 8, 4213–4229 CrossRef.
- Z. Jiang, C. He, N. F. Dummer, J. W. Shi, M. J. Tian, C. Y. Ma, Z. P. Hao, S. H. Taylor, M. Ma and Z. X. Shen, Appl. Catal., B, 2018, 226, 220–233 CrossRef.
- M. J. Tian, C. He, Y. K. Yu, H. Pan, L. Smith, Z. Jiang, N. B. Gao, Y. F. Jian, Z. P. Hao and Q. Zhu, Appl. Catal., A, 2018, 553, 1–14 CrossRef.
- X. D. Zhang, X. L. Zhang, L. Song, F. L. Hou, Y. Q. Yang, Y. X. Wang and N. Liu, Int. J. Hydrogen Energy, 2018, 43, 18279–18288 CrossRef.
- W. C. Zhan, Q. He, X. F. Liu, Y. L. Guo, Y. Q. Wang, L. Wang, Y. Guo, A. Y. Borisevich, J. S. Zhang, G. Z. Lu and S. Dai, J. Am. Chem. Soc., 2016, 138, 16130–16139 CrossRef PubMed.
- L. Xu, C. Chen, R. Wang, J. H. Luo, Y. L. Liu and N. Zhang, Chem. J. Chinese U., 2013, 34, 1907–1912 Search PubMed.
- H. Y. Tan, Y. Zhou, Y. F. Yan, D. Y. Wu, W. B. Hu and X. Y. Shi, Inorg. Chem. Commun., 2017, 79, 74–77 CrossRef.
Footnote |
| † Electronic supplementary information (ESI) available. See DOI: 10.1039/c8ra07531j |
| This journal is © The Royal Society of Chemistry 2018 |


