DOI:
10.1039/C8RA07412G
(Paper)
RSC Adv., 2018,
8, 41639-41650
Transport properties of protic and aprotic guanidinium ionic liquids†
Received
5th September 2018
, Accepted 16th November 2018
First published on 12th December 2018
Abstract
Ionic liquids (ILs) are a promising class of solvents, functional fluids and electrolytes that are of high interest for both basic as well as applied research. For further fundamental understanding of ILs and a successful implementation in technical processes, a deeper insight into transport properties and their interrelations is of particular importance. In this contribution we synthesised a series of mostly novel protic and aprotic ILs based on the tetramethylguanidinium (TMG) cation that is a derivative of the superbase guanidine. Different substitution patterns and anions from acids with broadly varied pKa values were investigated. We measured general properties, such as thermal transitions and densities of these ILs, as well as their transport quantities by means of rheology, impedance spectroscopy and NMR diffusometry. Different models for the correlation of the transport properties, namely the Nernst–Einstein, Walden and Stokes–Einstein–Sutherland relations were applied. The deviation from ideal behaviour of fully dissociated electrolytes, often termed as ionicity, was quantified by the reciprocal Haven ratio, fractional Walden rule and ionicity obtained from the Walden plot. Velocity cross-correlation coefficients were calculated to gain further insight into the correlation between ion movements. Both protic and aprotic TMG ILs show transport properties comparable to other ILs with similar molecular weight and high ionicity values especially in contrast to other protic ILs. Lowest ionicity values were found for the protic ILs with smallest ΔpKa values between constituting acid and base. This can either be explained by stronger hydrogen bonding between cation and anion or lower anti-correlations between the oppositely charged ions. These results aim to provide insight into the properties of this interesting cations class and a deeper understanding of the transport properties of ILs and their interrelations in general.
Introduction
Ionic liquids (ILs) are a very diverse and promising class of advanced functional fluids which show a unique property combination beneficial for a number of practical applications. These include synthesis,1 electrochemistry and energy conversion2 or engineering and processing.2,3 For implementation in existing or new technologies the detailed knowledge about their transport properties is of essential importance4,5 since they limit the achievable performance. The immense number of possible ILs and functionalisations makes deeper understanding of their physicochemical properties, the correlation between these properties and their molecular structure essential. Insights into structure–property-relations are the foundation for further optimisation of their transport properties along with the design of novel ILs with tailored characteristics. The Coulomb interactions inherently present in these low temperature molten salts are the dominant intermolecular force, however the contribution of other intermolecular interactions such as solvophobic interactions6 or hydrogen bonding7 are reported to have significant impact on the liquid mesostructure and therefore on the macroscopic quantities. Systematic investigations on structural modifications are crucial, especially due to contradictions in the scientific community.8
In this contribution, we report the synthesis of a series of ILs based on the tetramethylguanidinium (TMG) cation paired with anions from acids covering a wide range of pKa values. To the best of our knowledge most of these ILs have never been reported before. Molecular structures and nomenclature of cations and anions investigated in this work are shown in Scheme 1. We synthesised both protic (PILs) and aprotic (AILs) species to investigate the influence of hydrogen bonds on their physicochemical properties. The literature often distinguishes between these two large IL subclasses due to significant differences in synthesis and characteristics.9 Since the acid–base neutralisation reactions used in the preparation of PIL systems are reversible, neutral species and more or less acidic protons are present.10 The latter can act as H-bond donors, often resulting in expanded hydrogen bond networks.11 Contrary to this, AILs are formed by nucleophilic substitution reactions and subsequent anion exchange, making the synthesis less atom-efficient and more time-consuming. It was shown by Watanabe et al. that the difference in pKa values (ΔpKa) in PILs has a significant influence on the strength of hydrogen bonds between cation and anion.12 They found that for higher ΔpKa values a stronger bond between the precursor base and the acid proton is formed as confirmed by 1H-NMR and FT-IR spectroscopy. The TMG cations are derivatives of the organic superbase tetramethylguanidine (pKa[HHTMG] = 13.6 in aqueous solution13), ensuring comparably large ΔpKa values between the IL constituting cation and anion (pKa for the conjugate acids of the anions:14 pKa[HNTf2] = −10.0; pKa[HOTf] = −7.0; pKa[HOMs] = −2.0; pKa[HTFA] = 0.5). Large ΔpKa values between the Brønsted acids and bases forming the PILs are reported to result in a complete proton transfer and suppress reverse proton transfer to the molecular species at elevated temperatures thus leading to increased thermal stabilities.12 For the AILs equilibria of ionic and neutral species as well as strong, directional hydrogen bonds are absent. This makes a comparison of the PILs physicochemical properties with those of their AIL counterparts interesting for fundamental investigations. The TMG cation has a delocalised π-electron system similar to the intensively investigated imidazolium and pyridinium cations. The difference is that the resonant system is in Y-shape in the former and cyclic in the latter. Furthermore, the guanidinium cation has more substituents at the core allowing for a larger degree of synthetic possibilities for modification or functionalisation.15 Guanidinium-based ILs were reported to have promising properties as reaction media,16 high electrochemical and thermal stability,17 as well as high gas absorption capacities.18 In contrast to imidazolium and pyridinium cations, the central moiety in guanidinium cations is more easily distorted from planarity.19 This bears the potential to induce axial chirality when side chains of high sterical demand are used.
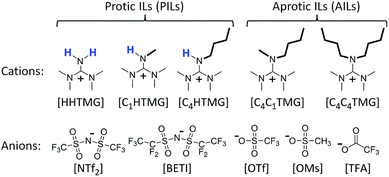 |
| | Scheme 1 Molecular structures of the IL cations and anions investigated in this work. Cx denotes the number of carbons in the attached alkyl side chains (x = 1: methyl; x = 4: butyl). | |
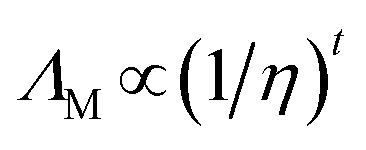
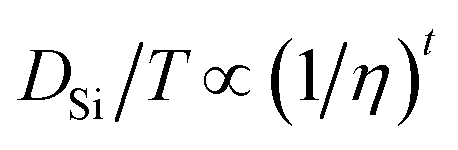
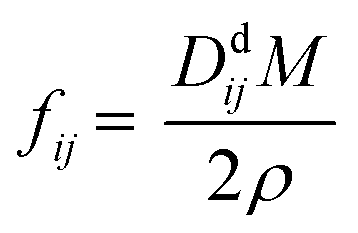
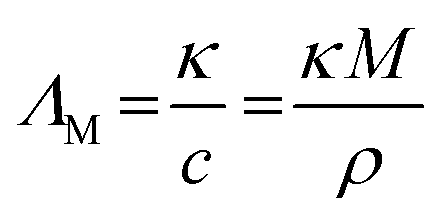
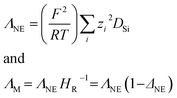
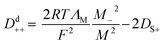
The focus in this work is put on small cations with side chain lengths not larger than butyl. Elongated alkyl-chains were found to generally increase the viscosity of ILs20 making these representatives less attractive for most technical implementations. For these mostly novel ILs, determination of thermal transitions revealed that most of them are liquid or supercooled at ambient temperature. For these samples, the most important transport properties were determined by stress-controlled rheology (momentum transport/viscosity), impedance spectroscopy (charge transport/conductivity) and NMR-diffusometry (mass flux/self-diffusion). The obtained results were analysed using different models to investigate correlation of transport properties such as the Walden (1), Nernst–Einstein (2) and Stokes–Einstein–Sutherland (3) relations that can be written as:
| |
 | (1) |
| |
 | (2) |
| |
 | (3) |
where
ΛM is the molar conductivity directly obtained from experiment,
η the viscosity,
ΛNE the molar conductivity calculated by the Nernst–Einstein equation,
F is the Faraday constant,
R the gas constant,
T the absolute temperature,
zi the charge number of a particular ion and
DSi (cation:
i = +; anion:
i = −) are the self-diffusion coefficients of the cation and anion. The Nernst–Einstein parameter
ΔNE and the Haven ratio
HR are deviation parameters introduced as a correction between the molar conductivities obtained from diffusive and electrical mobilities. Note that
ΔNE is not present in the simple Nernst–Einstein equation since the model was derived for infinitely diluted electrolyte solutions. The fractional exponents
t were found to be necessary for the fitting of molecular solvents and ionic liquids.
21 The first two relations are established methods in the literature to quantify the deviation of ILs from ideally behaving electrolytes, although they lack an underlying theory.
22–24 This ‘deviation from ideality’ or ‘ionicity
I’ is often attributed to ion-pairing or ion aggregation in the bulk liquid leading to decreased measured conductivities since the overall neutral species are assumed to not contribute to charge transport.
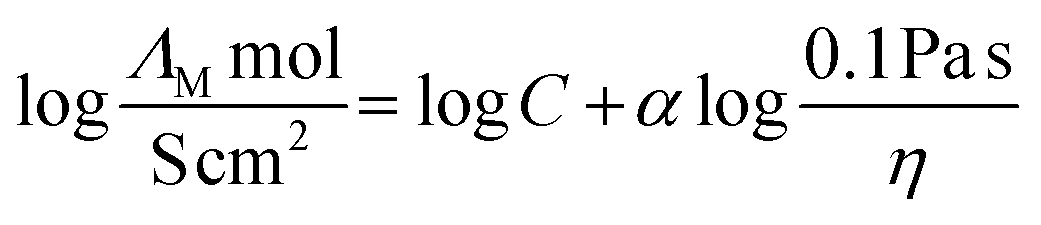
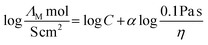
23 For the quantification of this discrepancy from ideal behaviour with temperature the fractional Walden approach
(4) was also applied.
23,25 This method relates molar conductivity to fluidity by means of introducing an additional parameter
α that accounts for deviation from the relation initially proposed by Walden in which
α is equal to unity.
| |
 | (4) |
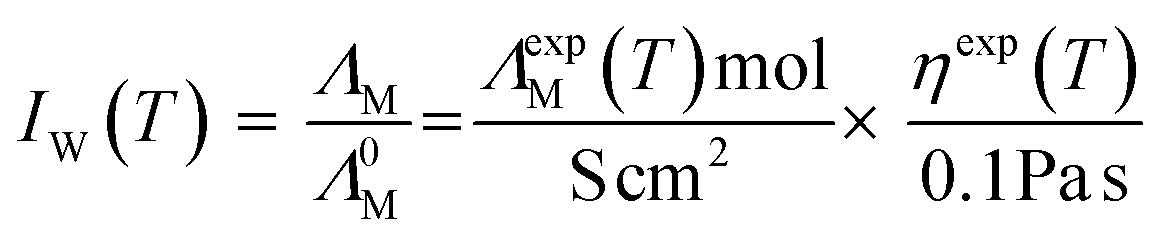
The vertical difference of the measured conductivity data to the ‘ideal’ KCl-line (Λ0M), that is regarded an ideal behaving, fully dissociated electrolyte, can also serve as a measure for ionicity. In this way the ionicity IW from the Walden plot at a particular temperature is obtained according to eqn (5).22
| |
 | (5) |
Another quantification parameter frequently applied in the framework of this ion aggregation assumption is that the ionicity IHR as defined by Watanabe et al.26 (6) is the reciprocal of the Haven ratio HR. It describes the amount of unpaired/dissociated ions similar to the Nernst–Einstein parameter ΔNE used for the degree of aggregated species.27
| |
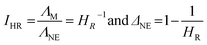 | (6) |
Whether the assumption of paired or clustered ions in ionic liquids is valid for ILs is still the subject of ongoing discussions. There are contrary experimental and theoretical results for and against this hypothesis.8,28 For example NMR dispersion29 or electrophoretic NMR30 show evidence for certain types of ion clustering while Harris31 argues that for the large majority of ILs there are no hints for ion association when the Laity resistance coefficients are considered. Other authors report nearly quantitative ionicity values for chloride ILs based on measurements of the 35Cl− quadrupolar coupling constants.31 Based on theoretical studies, Kirchner et al. concluded that the lifetimes of ion–ion contacts and their collective motions are far too low for a verification of neutral ion pairs in ionic liquids.28 Other approaches rationalise the experimentally proven deviation of IL conductivities from those calculated by the simple Nernst–Einstein equation with the assumption of charge transfer (CT) between cation and anion. The CT leads to fractional charges lower than the integer charges in the Nernst–Einstein equation and suppresses association of oppositely charged ions.32 Another possible explanation given in the literature for the discrepancy between diffusive and electrical mobilities are anticorrelated motions of ions due to momentum conservations. The momentum conservation law is satisfied for diluted electrolytes by solvent and ions which is significantly different to the situation of ILs or molten salts where the conservation law must be satisfied solely by the constituting ions.33 The distinct diffusion coefficients (DDC), Ddij (i,j = + or −) can be calculated from experimentally available quantities by equations deviated from the McCall–Douglas–Hertz velocity cross-correlation coefficients (VCC).34,35 For the unlike ions (Dd+−) they are proportional to the molar conductivity while for the like ions the DDCs (Dd++ and Dd−−) contain conductive and self-diffusive terms. The VCC are time and ensemble averages of the Kubo cross-correlation functions.36 The DDC/VCC approach is based on statistical mechanics and thus produces clearly defined quantities that can be calculated using molecular dynamics. In the case of a pure ionic liquid with single charged ions one obtains eqn (7)–(9) for the three distinct diffusion coefficients Ddij in the mass-fixed or barycentric reference frame37 and the VCC fij according to eqn (10).38
| |
 | (7) |
| |
 | (8) |
| |
 | (9) |
| |
 | (10) |
Here,
Mi is the molar mass of a certain ion,
M the molar mass of the IL. Regardless of the current debate detailed knowledge about the transport properties is important for the utilisation and optimisation of these advanced materials in technical applications. The same applies to the deviation from ideal behaviour and quantification of this.
In this contribution we want to categorize the TMG ILs based on their transport properties in comparison to other PIL and AIL classes and show that the PILs derived from small superbases behave as ‘pseudo alkylated’ ILs.
Experimental
Additional details on the experimental methods, measured data and applied fittings as well as the syntheses of the investigated ILs, NMR spectra and parameters are given in the ESI†. Products were identified by multinuclear NMR spectroscopy. Prior to each physicochemical measurement the samples were dried in high vacuum at elevated temperatures for about 24 h and further handled in a glove box. Absence of halides was checked by testing the bulk samples with AgNO3 solution and ion chromatography. Water content as determined by Karl Fischer titration was found to be below 100 ppm. Temperature dependent values for the viscosity, molar conductivity and self-diffusion coefficients were fitted following the Vogel–Fulcher–Tammann equation39,40 (11) and the Litovitz equation41 (12) that were both found in the literature to be suitable for IL transport properties42–44 since deviations from Arrhenius type behaviour are usually found.| |
 | (11) |
| |
 | (12) |
The variable Y can either be the dynamic viscosity η, the molar conductivity ΛM or the self-diffusion coefficients DSi (i = +, −) while A0, B and T0 (Vogel temperature) as well as A and B′ are material dependent parameters (B, B′ > 0 for η; B, B′ < 0 for ΛM and DSi). Since the VFT fitting is more frequently used for ILs only the VFT parameters are included in the main manuscript.
Thermal transitions
Thermal behaviour of the samples was analysed using differential scanning calorimetry on a DSC 1 STARe (Mettler Toledo, Gieβen, Germany) equipped with a liquid nitrogen cooling system. Slow scan rates of ±1 °C min−1 were applied to ensure correct determination of the thermal transitions and to suppress supercooling observed for high scanning rates.45 Each DSC trace was recorded on samples of about 10 mg mass that were hermetically sealed in aluminium crucibles under inert atmosphere. The applied temperature program started with +10 °C min−1 heating from 25 °C to 150 °C with isothermal treatment at this temperature for 10 min. Afterwards the samples were cooled at −1 °C min−1 to −125 °C followed by a 10 min isothermal period. The samples were then subjected to dynamic heating with a heating rate of +1 °C min−1 to 150 °C, held at this temperature for 10 min and cooled again to 25 °C. Thermal transitions are given as extrapolated onset temperatures beside glass transitions that were obtained by the midpoint method.
Density measurements
Densities were measured with a Reischauer-type pycnometer (Neubert Glas, Geschwenda, Germany) of 5 mL nominal volume. Volume calibration in the investigated temperature range was performed using octane; the volume calibration was confirmed with purified water. The largest deviation from literature values for water densities obtained was 0.1%.46 The pycnometer was rinsed several times with acetone and dried in vacuum prior to weighing before the measurement. For each density measurement the IL sample was carefully placed in the pycnometer with a cannula at ambient temperature until the liquid level was slightly above the mark. The pycnometer was then sealed, placed in a thermostat bath (max. temperature deviation ±0.01 °C) at 25 °C and allowed to equilibrate for at least 20 min. The liquid level was adjusted to the mark with Pasteur pipettes and the pycnometer weighted after cooling to ambient temperature. The procedure was repeated in 10 °C steps up to 75 °C.
Dynamic viscosity
Temperature dependent viscosities were determined on a stress-controlled MCR 301 Rheometer (Anton Paar, Graz, Austria) using cone-plate geometry with CP50-1 cone (49.95 mm diameter, cone angle 1°) and 0.101 mm gap size. All measurements were conducted under dry N2 atmosphere applying shear rates from 5–150 s−1 in linear steps with 30 data points measured overall. Since there were no shear rate or time dependent effects visible, i.e. only Newtonian behaviour was observed, the data points were averaged. Before each measurement the temperature was allowed to equilibrate for at least 15 min. The first measurement was performed at 25 °C and the temperature raised in 10 °C steps to 95 °C. Maximum temperature deviation was ±0.1 °C. Estimated uncertainty is ±3% as judged by commercial viscosity standards.
Specific and molar conductivity
Specific conductivities of the samples were measured by means of impedance spectroscopy in a closed electrochemical cell using a SP-150 potentiostat (BioLogic, Seysinnet-Pariset, France). The conductivity probe (WTW, Weilheim, Germany) consisted of two platinised platinum electrodes of rectangular geometry fixed in glass with a nominal cell constant of 0.5 cm−1. The cell constant was determined using commercial standards. Temperature was controlled with a Proline RP 1845 thermostat (LAUDA, Lauda-Königshofen, Germany) with a maximum deviation of ±0.01 °C. Before each measurement the temperature was allowed to equilibrate at least 30 min. Conductivity measurements were performed in 10 °C steps from 25 °C to 75 °C. Impedance spectra were recorded at applied voltage amplitudes of 5, 10 and 15 mV and frequencies from 200 kHz to 1 Hz in 50 logarithmic steps. Determined resistances used for the calculation of the specific conductivity κ were averaged with deviations of max. ±1.0%. The molar conductivities can then be calculated with eqn (13) if the specific conductivities and the densities are known.| |
 | (13) |
Estimated uncertainty for the specific conductivity is ±2% as judged by commercial conductivity standards.
Self-diffusion coefficients
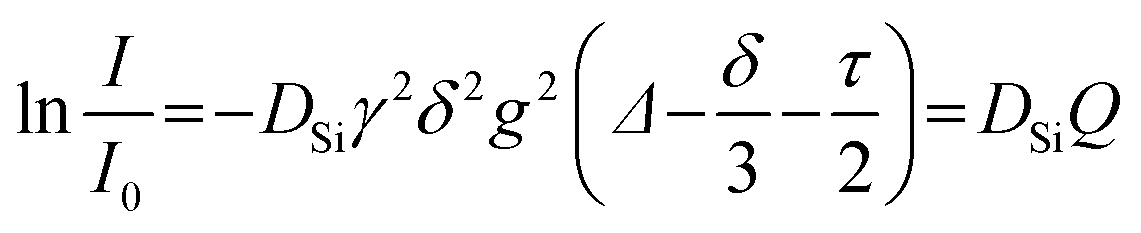
Self-diffusion coefficients were determined using a NMR pulse sequence based on the pulsed field-gradient stimulated echo (PFGSTE) as developed by Wu et al.47 incorporating bipolar field gradients g and an additional longitudinal eddy current delay Te. The simpler pulsed field gradient spin echo (PFGSE) is unsuitable for more viscous systems such as ILs since it has some drawbacks and artefacts.48,49 The PFGSTE experiment minimises eddy currents that are the consequence of the currents used to generate the magnetic field gradients.47,50,51 In the periods when the macroscopic magnetisation is stored in the direction of the magnetic field, spoiler gradient pulses are used to remove transverse magnetisation. This method minimises effects like inaccurate pulses or undesired coherence pathways.48,50,52 Further experimental details and the visualisation of the pulse program are reported in a former publication.27 NMR spectra for the determination of the individual self-diffusion coefficients of the bulk ILs were recorded in argon-filled, sealed NMR tubes on an AVANCE II 400 NMR spectrometer (Bruker, Billerica, USA) with 5 mm BBFO probe. The gradient was calibrated using pure water since this self-diffusion coefficient is well known from other techniques.53–55 Self-diffusion coefficients were determined using the 1H nucleus for cations and the 19F nucleus for the anion with the exception of the methanesulfonate anion which was also measured by 1H NMR utilising the separated signal of the anion protons. Temperature was allowed to equilibrate for at least 1 h. The probe was tuned and shimmed manually after every change of sample, nucleus or temperature. Gradient pulse durations for sufficient signal attenuation as well as a rough estimation of the longitudinal relaxation time T1 were determined manually. Relaxation delay together with the acquisition time was chosen as 5 to 7 times the value obtained for T1. For each single self-diffusion coefficient determination 16 spectra were recorded in total with 16 scans each. The raw spectra were subjected to manual phase an automatic baseline correction followed by integration. Plotting ln(I/I0) versus Q following the Stejskal–Tanner eqn (14) then results in a straight line from which the self-diffusion coefficient DSi can be obtained as the slope.| |
 | (14) |
where I is the signal intensity with gradient applied, I0 the initial signal intensity, γ the gyromagnetic ratio of the investigated nucleus, δ the overall gradient duration, g the applied gradient strength, Δ the diffusion time and τ the gradient interspacing. It should be noted that the gradient interspacing due to the bipolar gradients does not appear in the original equation.50,51 Estimated uncertainty for the self-diffusion coefficients is ±5% by comparison to viscous calibration liquids suggested in literature.56
Results and discussion
Thermal transitions and densities
Knowledge about the thermal transitions of ILs is important since the solidification point puts limits on many applications. Thermal transitions of the samples were determined by means of DSC yielding a broad range of different thermal behaviours. The determined crystallisation Tc, glass transition Tg, cold crystallisation Tcc, solid–solid Tss and melting Tm temperatures along with the densities ρ and molar volumes VM at 25 °C are reported in Table 1. The obtained DSC traces include the three types of IL thermal behaviour commonly found in the literature.45 These are (a) only glass formation, for example found in all [NTf2] salts with butyl chain; (b) crystallisation upon cooling and melting transition with often wide temperature ranges where the IL remains in supercooled state, as found for all investigated ILs with [C1HTMG] cation; (c) no crystallisation upon cooling and crystallisation upon reheating (cold crystallisation) followed by melting transition, for example found in [C4C4TMG][BETI]. Furthermore some samples were also found to have additional solid–solid transitions. Most of the samples were room temperature ionic liquids (RTILs) or could be obtained in supercooled state at ambient temperature. All ILs with the [HHTMG] cation with the exception of [HHTM][BETI] were solids at 25 °C. The methanesulfonate ILs with [HHTMG] and [C4C1TMG] cation even have melting points exceeding 100 °C. As for many other classes of ILs there are no clear trends regarding the phase transition behaviour as these are complex and sensitive interplays of symmetry, lattice effects and molecular interactions.57 This also makes the comparison with other cation classes rather difficult. The IL densities showed a decrease with molecular weight and an increase with fluorine and sulphur content. With temperature the decrease in density showed a linear behaviour (Fig. S1 and S2†). For the ILs with the [C4HTMG] cation the densities decreased in the anion order [BETI] > [NTf2] > [OTf] > [TFA] > [OMs].
Table 1 Thermal transitions of the investigated ionic liquids including densities and molar volumes of the RTILs
| Ionic liquid |
Tca/°C |
Tgb/°C |
Tcc/°Cc |
Tss/°Cd |
Tm/°Ce |
ρ25 °C/g mL−1 |
V25 °CM/mL mol−1 |
| Crystallisation temperature at −1 °C min−1 cooling rate. Glass transition temperature. Cold crystallisation temperature in the heating step. Solid–solid transition. Melting point. Measured in supercooled state. |
| [HHTMG][NTf2] |
−1 |
— |
— |
— |
49 |
— |
— |
| [HHTMG][BETI] |
— |
−71 |
−40 |
18 |
25 |
1.569 |
316 |
| [HHTMG][OTf] |
−17 |
— |
— |
— |
43 |
— |
— |
| [HHTMG][OMs] |
— |
−44 |
1 |
— |
117 |
— |
— |
| [HHTMG][TFA] |
17 |
— |
— |
15 |
39 |
— |
— |
| [C1HTMG][NTf2] |
−47 |
— |
— |
— |
17 |
1.452 |
283 |
| [C1HTMG][BETI] |
−58 |
— |
— |
— |
−13 |
1.530 |
334 |
| [C1HTMG][OTf] |
−22 |
— |
— |
— |
32 |
1.312f |
213 |
| [C1HTMG][OMs] |
30 |
— |
— |
— |
68 |
— |
— |
| [C1HTMG][TFA] |
−4 |
— |
— |
— |
28 |
1.220f |
199 |
| [C4HTMG][NTf2] |
— |
−83 |
— |
— |
— |
1.354 |
334 |
| [C4HTMG][BETI] |
−29 |
— |
— |
— |
31 |
1.429f |
387 |
| [C4HTMG][OTf] |
— |
−70 |
−17 |
— |
10 |
1.218 |
264 |
| [C4HTMG][OMs] |
— |
−53 |
— |
— |
— |
1.109 |
241 |
| [C4HTMG][TFA] |
— |
−76 |
−17 |
— |
10 |
1.138 |
251 |
| [C4C1TMG][NTf2] |
— |
−86 |
— |
— |
— |
1.338 |
349 |
| [C4C1TMG][BETI] |
−21 |
— |
— |
— |
28 |
1.416f |
400 |
| [C4C1TMG][OTf] |
20 |
— |
— |
— |
52 |
— |
— |
| [C4C1TMG][OMs] |
56 |
— |
— |
— |
113 |
— |
— |
| [C4C1TMG][TFA] |
22 |
— |
— |
— |
39 |
— |
— |
| [C4C4TMG][NTf2] |
— |
−75 |
— |
— |
— |
1.276 |
398 |
| [C4C4TMG][BETI] |
— |
−70 |
−8 |
— |
23 |
1.351 |
451 |
| [C4C4TMG][OTf] |
— |
−58 |
−7 |
−18 |
19 |
1.160 |
325 |
| [C4C4TMG][OMs] |
— |
−40 |
— |
— |
— |
1.063 |
304 |
| [C4C4TMG][TFA] |
15 |
— |
— |
— |
44 |
— |
— |
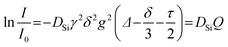
Viscosity
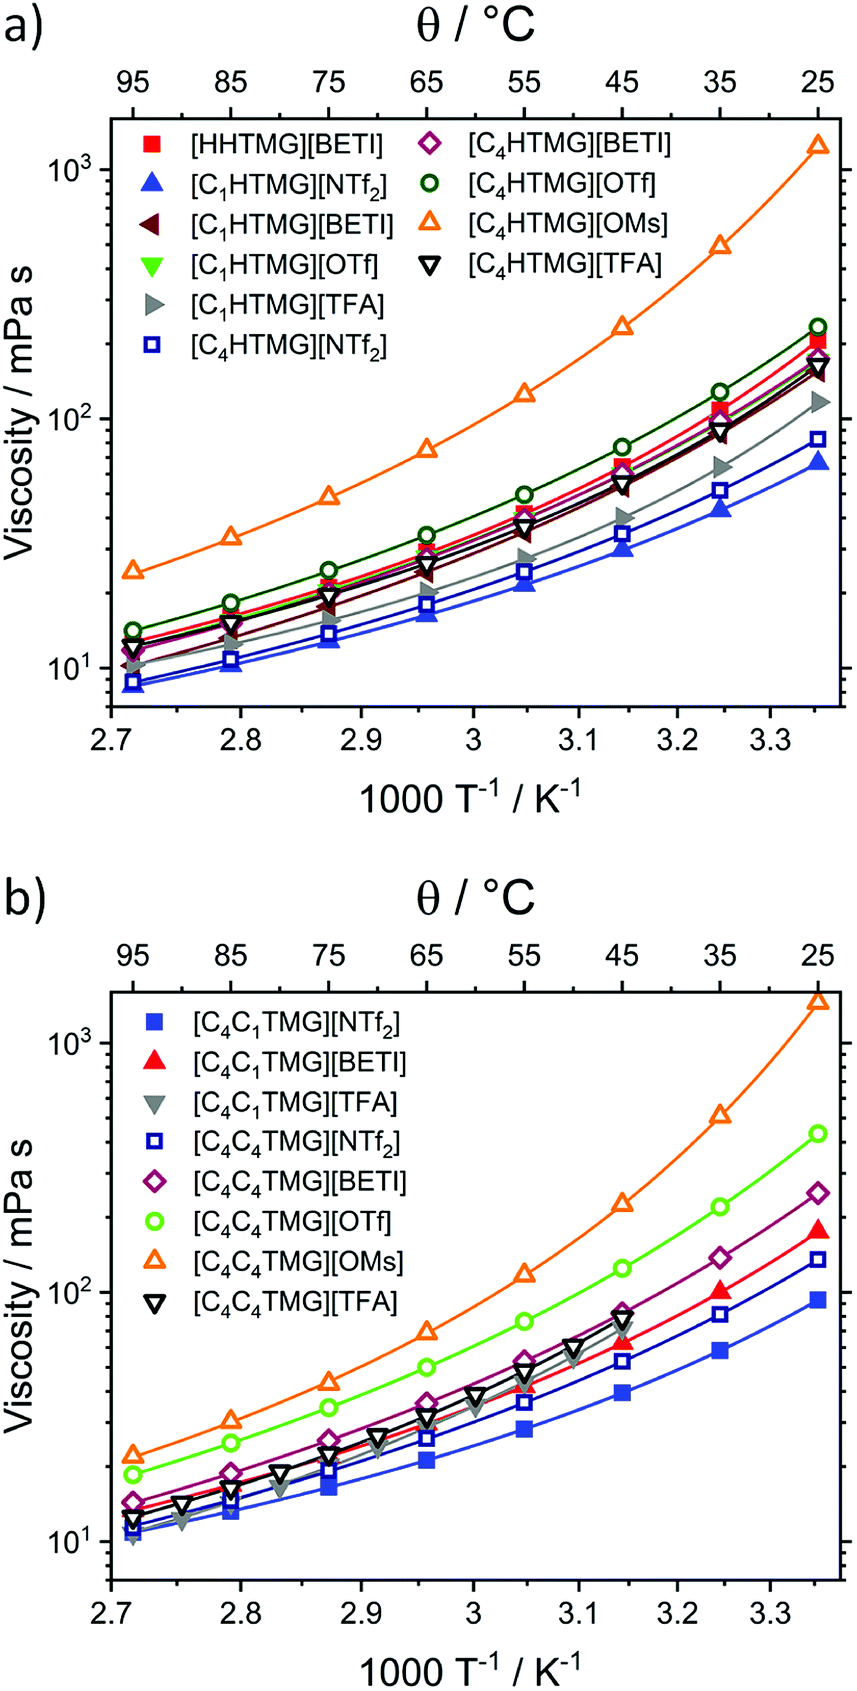
The viscosity of ionic liquids is of high concern for the potential applications in a large number of processes. This quantity puts limits on procedures like separation and mixing as well as the demands for the equipment, for example, of heat exchangers or pipelines. Compared to conventional molecular solvents, ILs are moderate to highly viscous liquids with viscosity values at least about an order of magnitude larger. The temperature dependence of the viscosities can be describe by the Vogel–Fulcher–Tammann eqn (11); the obtained fitting parameters for TMG ILs and the viscosities η at 25 °C are given in Table 2. The temperature dependent viscosities are plotted in Fig. 1. The lowest viscosity at ambient temperature was found for [C1HTMG][NTf2].
Table 2 Viscosity at 25 °C of the RTILs and VFT fitting parameters
| Ionic liquid |
η25 °C/mPa s |
η0/mPa s |
B/K |
T0/K |
| [HHTMG][BETI] |
206.5 |
0.390 |
549.1 |
210.6 |
| [C1HTMG][NTf2] |
66.4 |
0.277 |
636.6 |
182.0 |
| [C1HTMG][BETI] |
155.4 |
0.116 |
829.4 |
182.9 |
| [C1HTMG][OTf] |
171.4 |
0.207 |
724.6 |
190.3 |
| [C1HTMG][TFA] |
116.7 |
0.832 |
357.6 |
225.8 |
| [C4HTMG][NTf2] |
82.8 |
0.203 |
705.0 |
180.8 |
| [C4HTMG][BETI] |
174.2 |
0.116 |
829.4 |
182.9 |
| [C4HTMG][OTf] |
233.9 |
0.172 |
793.6 |
188.2 |
| [C4HTMG][OMs] |
1237 |
0.974 |
376.8 |
227.8 |
| [C4HTMG][TFA] |
163.9 |
0.472 |
513.7 |
210.3 |
| [C4C1TMG][NTf2] |
93.1 |
0.430 |
567.0 |
192.7 |
| [C4C1TMG][BETI] |
175.1 |
0.283 |
674.4 |
193.2 |
| [C4C1TMG][TFA] |
— |
0.117 |
770.7 |
197.7 |
| [C4C4TMG][NTf2] |
135.3 |
0.131 |
885.6 |
170.6 |
| [C4C4TMG][BETI] |
250.1 |
0.106 |
932.2 |
178.2 |
| [C4C4TMG][OTf] |
433.0 |
0.131 |
891.5 |
188.1 |
| [C4C4TMG][OMs] |
1454 |
0.333 |
584.7 |
228.4 |
| [C4C4TMG][TFA] |
— |
0.230 |
636.4 |
209.2 |
 |
| | Fig. 1 Temperature dependent viscosities of (a) the protic TMG ILs and (b) the aprotic, hexaalkylated guanidinium salts. Solid lines are the fits using the VFT eqn (11). | |
For [NTf2] ILs the viscosity correlates with the cation size in the order [C1HTMG] < [C4HTMG] < [C4C1TMG] < [C4C4TMG]. This is believed to be a combination of the increase in cation size and van der Waals interaction20 that lead to the manifestation of a mesostructure with polar-ionic and nonpolar-hydrocarbon domains in the bulk ILs.6 This structuration is the result of solvophobic interactions and becomes the more pronounced the longer the alkyl chains attached to the anion or cation are.58 For the [C4HTMG] cation the viscosity increases in the order [NTf2] < [TFA] < [BETI] < [OTf] < [OMs]. For the [C4HTMG] cation the viscosity increases in the order [NTf2] < [TFA] < [BETI] < [OTf] < [OMs]. All [OMs] ILs that were liquid at ambient temperature had viscosity values approximately one order of magnitude higher than those with other anions. The viscosities seem to depend primarily on the size of the ions; there is hardly any distinct effect of H-bonding on the viscosity in the PILs visible. This is believed to be the result of the very high ΔpKa between the IL forming acid and base leading to highly localised protons on the cation. The resulting PILs behave as ‘pseudo-AILs’. Similar trends were also reported for viscosities of PILs with the organic superbase 1,8-diazabicyclo-[5,4,0]-undec-7-ene (DBU)12 and AILs with phosphonium cations.27 Besides the [OMs] ILs the TMG ILs can be classified as moderately viscous ILs, making them equivalent candidates to other IL cations for applications. The viscosity values of the AIL [C4C1TMG][NTf2] compared with other ILs consisting of aromatic cations such as the 1-methyl-3-octyl-imidazolium [C8C1Im] and octyl-pyridinium [C8Py] of similar weight are in the same range (η25 °C([C8C1Im][NTf2]) = 92.5 mPa s59 and η25 °C([C8Py][NTf2]) = 104.1 mPa s60). The IL [C4C1Pyrr][NTf2] based on the 1-butyl-1-methyl-pyrrolidnium cation is between [C1HTMG][NTf2] and [C4C1TMG][NTf2] in both molecular weight and viscosity (η25 °C([C4C1Pyrr][NTf2]) = 76.5 mPa s61). The phosphonium IL triethylpentylphosphonium [NTf2] with similar molecular weight is also in the same viscosity range as [C4C1TMG][NTf2] (η25 °C([P2225][NTf2]) = 98.0 mPa s27). Triethylammonium [NTf2] as a representative of PILs is reported to have a comparable viscosity (η25 °C([Et3NH][NTf2]) = 63 mPa s)62 to the PIL [C1HTMG][NTf2] although the molecular weight of the latter is higher.
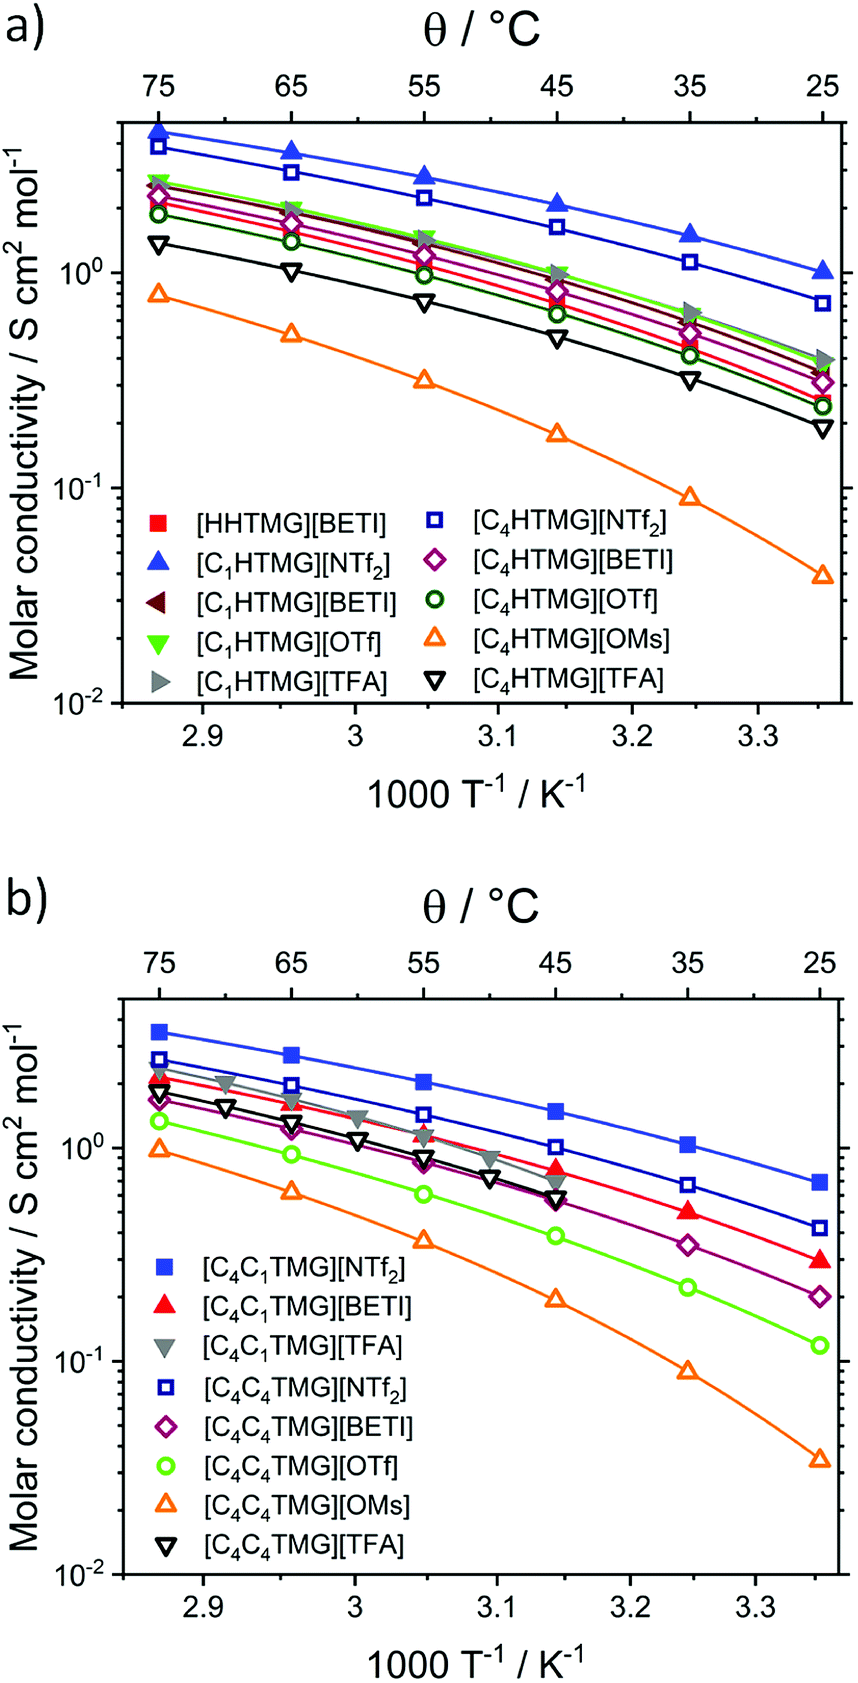
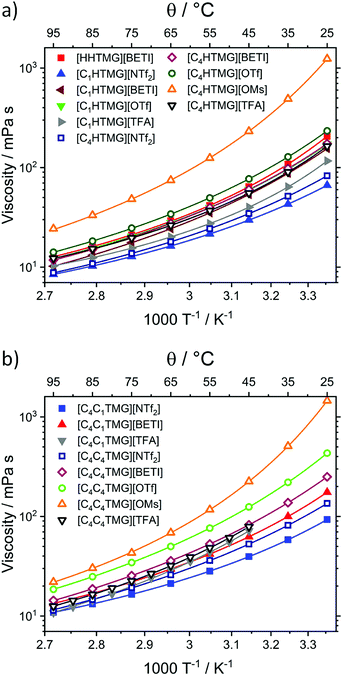
Conductivity
Another property of interest is the conductivity of ILs since it is an intrinsic property of this material class. A vast amount of proposed implementations are in the field of electrochemistry and electronic devices2 where often high charge transport is desired. Therefore, overall conductivity as well as the connection of an ILs' conductivity to its structure in accordance with deviation from ideal behaviour is essential for optimisations when used as electrolyte. The parameters for the VFTs fit of the TMG ILs' molar conductivity ΛM and their values at 25 °C are listed in Table 3.
Table 3 VFT fit parameters of the TMG IL's molar conductivity and value at 25 °C
| Ionic liquid |
Λ25 °CM/S cm2 mol−1 |
ΛM,0/S cm2 mol−1 |
B/K |
T0/K |
| [HHTMG][BETI] |
0.247 |
250.2 |
−772.4 |
186.1 |
| [C1HTMG][NTf2] |
1.01 |
213.8 |
−686.3 |
170.1 |
| [C1HTMG][BETI] |
0.344 |
165.1 |
−643.0 |
194.0 |
| [C1HTMG][OTf] |
0.378 |
165.3 |
−644.5 |
192.1 |
| [C1HTMG][TFA] |
0.394 |
144.2 |
−643.3 |
189.1 |
| [C4HTMG][NTf2] |
0.721 |
360.7 |
−846.7 |
161.6 |
| [C4HTMG][BETI] |
0.310 |
230.9 |
−765.3 |
182.5 |
| [C4HTMG][OTf] |
0.240 |
183.6 |
−735.0 |
187.8 |
| [C4HTMG][OMs] |
0.039 |
277.5 |
−866.6 |
200.4 |
| [C4HTMG][TFA] |
0.192 |
106.6 |
−696.8 |
187.9 |
| [C4C1TMG][NTf2] |
0.690 |
341.5 |
−873.3 |
157.5 |
| [C4C1TMG][BETI] |
0.294 |
198.5 |
−741.8 |
184.2 |
| [C4C1TMG][TFA] |
— |
85.5 |
−422.4 |
230.3 |
| [C4C4TMG][NTf2] |
0.421 |
339.4 |
−895.6 |
164.3 |
| [C4C4TMG][BETI] |
0.201 |
229.4 |
−813.5 |
182.6 |
| [C4C4TMG][OTf] |
0.119 |
491.7 |
−1014.7 |
176.4 |
| [C4C4TMG][OMs] |
0.034 |
303.5 |
−781.0 |
212.1 |
| [C4C4TMG][TFA] |
— |
237.5 |
−762.3 |
191.3 |
Usually the VFT fitting is applied to the specific conductivity63 (see ESI†) but can also be applied to the molar conductivity as there are only minor, linear changes in density with temperature. The resulting plots of ΛM against temperature are shown in Fig. 2. All examined ILs show moderate to good conductivities with exception of the [OMs] anion where the values are one order of magnitude lower. The highest molar conductivity value was found for [C1HTMG][NTf2]. For this anion the molar conductivity shows the opposite trend to the viscosity and is related to the molecular weight where [C1HTMG] > [C4HTMG] > [C4C1TMG] > [C4C4TMG]. The decreasing molar conductivity values with elongation of the attached alkyl chains of the TMG ILs is a trend found also for most other reported IL cations64–66 although there are often no clear tendencies in the VFT fitting parameters visible.67 Molar conductivities for the anions paired with the [C4HTMG] cation decrease in the order [NTf2] > [BETI] > [OTf] > [TFA] > [OMs] which is different from the trends observed for viscosity. The conductivity of the PIL [C1HTMG][NTf2] is similar to an ammonium IL with comparable molecular weight (Λ25 °CM([Et3NH][NTf2]) = 1.05 S cm2 mol−1)62. Also the values for AILs with molecular weights comparable to the [C4C1TMG] are considerably lower underlining the interesting properties of the guanidinium ILs (Λ25 °CM([C8C1Im][NTf2]) = 0.49 S cm2 mol−1;68 Λ25 °CM([C8Py] [NTf2]) = 0.35 S cm2 mol−1;60 Λ25 °CM([P2225][NTf2]) = 0.63 S cm2 mol−1)27. The molar conductivity and molecular weight of the IL [C4C1Pyrr][NTf2], which often used in electrochemical applications, is between the values of [C1HTMG][NTf2] and [C4C1TMG][NTf2] (Λ25 °CM([C4C1Pyrr][NTf2]) = 0.834 S cm2 mol−1)61 similar to its viscosity values.
 |
| | Fig. 2 Molar conductivities of the ILs at different temperatures for (a) protic ILs and (b) aprotic representatives. Drawn lines are the corresponding VFT fits (eqn (11)). | |
NMR diffusometry
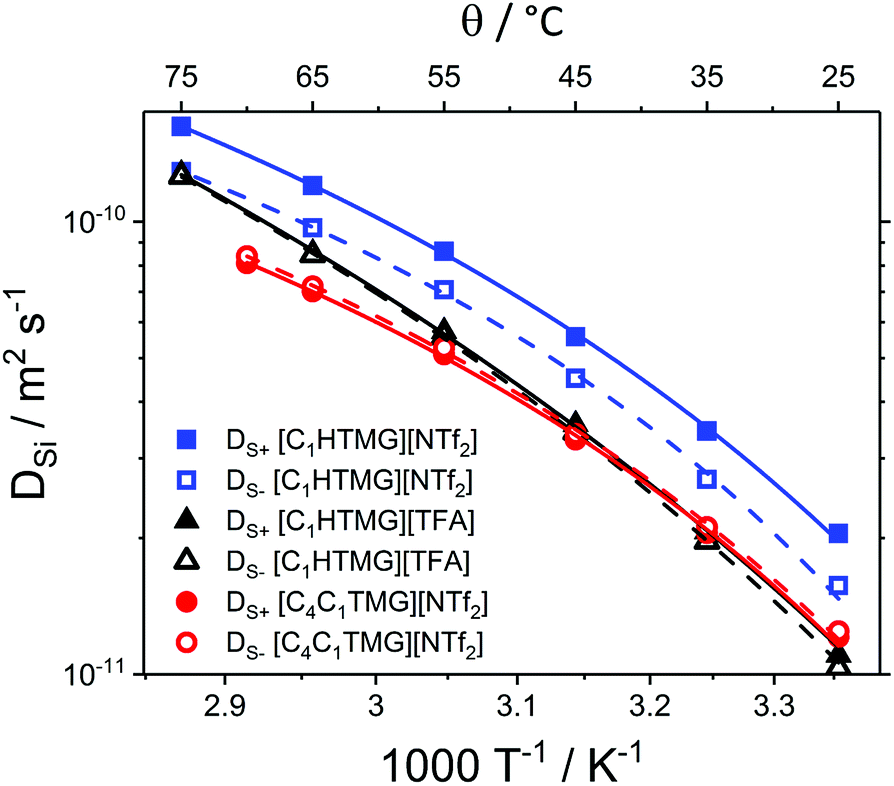
The individual self-diffusion coefficients DSi of IL's anions and cations are a measure for the movement of molecular units of the species i in absence of external electric fields or concentrations gradients. The self-diffusion coefficients are inherently connected to the conductivity through linear response theory as both can be expressed in terms of velocity correlation functions. Conclusions about the microscopic structure can be drawn based on this connection. This allows for the control of the structure–property-relations that are required for desired properties. Studying the individual contributions and ratios of the conducting species (or the diffusion of dissolved compounds) reveals more detailed information than macroscopic measurements. The self-diffusion coefficients of the TMG ILs from single temperature measurements, their ratios, the calculated Nernst–Einstein parameters ΔNE and ionicities IHR as reciprocal Haven ratios along with the ionicities IW obtained from Walden plot are summarised in Table 4. Due to experimental limitations and absence of pronounced supercooling, the values for the methanesulfonate ILs and aprotic trifluoroacetates were only accessible at elevated temperature (45 °C).
Table 4 Cation and anion self-diffusion coefficients DSi of the ionic liquids, their ratio, DS+/DS− the Nernst–Einstein deviation parameter ΔNE, ionicities IHr expressed as reciprocal Haven ratio and ionicity IW according to the Walden plot
| Ionic liquid |
T/°C |
DS+/10−12 m2 s−1 |
DS−/10−12 m2 s−1 |
DS+/DS− |
ΔNE |
IHR/HR−1 |
IW |
| [HHTMG][BETI] |
25 |
5.86 |
4.16 |
1.41 |
0.34 |
0.66 |
0.51 |
| [C1HTMG][NTf2] |
25 |
20.5 |
15.7 |
1.30 |
0.26 |
0.74 |
0.67 |
| [C1HTMG][BETI] |
25 |
7.83 |
5.34 |
1.47 |
0.30 |
0.70 |
0.53 |
| [C1HTMG][OTf] |
25 |
8.18 |
6.53 |
1.25 |
0.32 |
0.68 |
0.65 |
| [C1HTMG][TFA] |
25 |
11.0 |
10.3 |
1.07 |
0.51 |
0.49 |
0.46 |
| [C4HTMG][NTf2] |
25 |
13.9 |
13.0 |
1.08 |
0.29 |
0.71 |
0.60 |
| [C4HTMG][BETI] |
25 |
6.73 |
5.33 |
1.26 |
0.32 |
0.68 |
0.54 |
| [C4HTMG][OTf] |
25 |
5.13 |
4.73 |
1.08 |
0.35 |
0.65 |
0.56 |
| [C4HTMG][OMs] |
45 |
5.13 |
5.88 |
0.87 |
0.55 |
0.46 |
0.50 |
| [C4HTMG][TFA] |
25 |
6.08 |
6.13 |
0.99 |
0.58 |
0.42 |
0.32 |
| [C4C1TMG][NTf2] |
25 |
12.1 |
12.5 |
0.97 |
0.25 |
0.75 |
0.64 |
| [C4C1TMG][BETI] |
25 |
6.28 |
5.63 |
1.12 |
0.34 |
0.66 |
0.52 |
| [C4C1TMG][TFA] |
45 |
15.5 |
18.0 |
0.86 |
0.36 |
0.64 |
0.50 |
| [C4C4TMG][NTf2] |
25 |
6.63 |
8.70 |
0.76 |
0.27 |
0.73 |
0.57 |
| [C4C4TMG][BETI] |
25 |
3.67 |
4.14 |
0.89 |
0.31 |
0.69 |
0.50 |
| [C4C4TMG][OTf] |
25 |
1.95 |
2.48 |
0.78 |
0.29 |
0.71 |
0.51 |
| [C4C4TMG][OMs] |
45 |
3.43 |
5.29 |
0.65 |
0.37 |
0.63 |
0.50 |
| [C4C4TMG][TFA] |
45 |
14.1 |
14.9 |
0.95 |
0.43 |
0.57 |
0.46 |
The deviations from ideal behaviour show only minor sensitivity in the investigated temperature range as discussed below so that these can be used for a rough comparison. The highest self-diffusion coefficients found were those for [C1HTMG][NTf2] in accordance with the lowest viscosity and highest conductivity at this temperature. For the [C1HTMG] cations both the anion and cation's diffusion coefficients follow the order [NTf2] > [TFA] > [OTf] > [BETI] similar to the molar conductivities at 25 °C. Upon elongation of the attached alkyl chain the order for the DS+ of the [C4HTMG] cation is changed to [NTf2] > [BETI] > [TFA] > [OTf] and to [NTf2] > [TFA] > [BETI] > [OTf] for the case of DS−. For the [NTf2]-series both cation and anion self-diffusion coefficient show a decrease with increasing cations size in the order [C1HTMG] > [C4HTMG] > [C4C1TMG] > [C4C4TMG]. The ratio of the diffusion coefficients for the [C1HTMG] and [C4HTMG] ILs decreases by [BETI] > [NTf2] > [OTf] > [TFA] corresponding to decreasing size of the anions. In most PILs the cation diffuses faster than the anion, whereas for the AILs, except [C4C1TMG][BETI], the anion has a higher self-diffusion coefficient. The self-diffusion coefficients of [C4C1TMG][NTf2] for both cation and anion are higher compared to an imidazolium IL with comparable molecular weight (D25 °CS+([C8C1Im][NTf2]) = 9.08 × 10⁻¹² m2 s−1; D25 °CS−([C8C1Im][NTf2]) = 8.99 × 10⁻¹² m2 s−1)66 which may be related to the known nanoscale structuring of IL with long alkyl chains.6,69
These results show the complicated interplay of intermolecular forces, molecular size and shape of the ions in bulk ILs. To gain a more detailed insight in the progression of the self-diffusion coefficients, temperature-dependent diffusion measurements for the PILs [C1HTMG][NTf2] and [C1HTMG][TFA] as well as the AIL [C4C1TMG][NTf2] were performed. These three samples were chosen to compare the influence of the anion in PILs as well as the PILs to the AILs. The temperature dependent DSi could also be fitted with the VFT eqn (11). The resulting fit parameters are listed in Table 5 and the measured diffusion coefficients are shown in Fig. 3. The ratio of the self-diffusion coefficients (see Table S19†) does not change with temperature for the AIL and shows only a minor decrease with temperature for the PILs.
Table 5 VFT fit parameters of the self-diffusion coefficients DSi (cation: i = +; anion: i = −)
| Ionic liquid |
i |
DSi,0/10−7 m2 mol−1 |
B/K |
T0/K |
| [C1HTMG][NTf2] |
+ |
1.05 |
−620.7 |
199.3 |
| [C1HTMG][NTf2] |
− |
0.339 |
−409.0 |
223.0 |
| [C1HTMG][TFA] |
+ |
30.4 |
−1647 |
136.3 |
| [C1HTMG][TFA] |
− |
18.9 |
−1446 |
150.3 |
| [C4C1TMG][NTf2] |
+ |
0.337 |
−488.0 |
212.2 |
| [C4C1TMG][NTf2] |
− |
0.376 |
−504.0 |
210.4 |
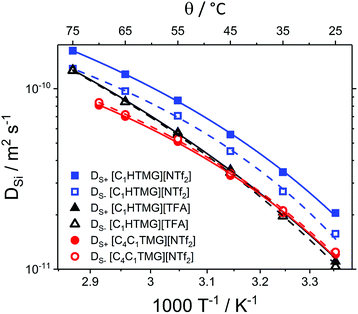 |
| | Fig. 3 Temperature-dependent individual self-diffusion coefficients of the TMG ILs. Solid lines are the VFT fits for the cations, dashed ones for the anions. | |
Nernst–Einstein and Walden relation
As mentioned earlier, the Nernst–Einstein parameter ΔNE and ionicity IHR as reciprocal Haven ratio are important and simple quantities for the optimisation of ILs, although their interpretation is a matter of debate. The IHR values obtained for all cations follow the order [NTf2] > [BETI] > [OTf] > [OMs] > [TFA] (besides [C4C4TMG] where [BETI] and [OTf] are interchanged), corresponding to a decrease in the pKa values of the anion's conjugate acids. For the anions [NTf2], [BETI] and [OTf] the IHR values are all in the same range, independent of being PILs or AILs. The IHR values for the protic methanesulfonate and protic trifluoroacetate ILs are significantly lower than those of their aprotic counterparts. This might indicate a more pronounced hydrogen bond due to the lower difference in pKa between the precursors, leading to a formally neutral species that does not contribute to the macroscopic conductivity. These findings are in accordance to literature findings that a high ΔpKa is necessary to obtain ILs with high ionicities.12,24 Watanabe et al. also found similar trends but lower ionicity values for ILs from the larger superbase DBU.12 The observed reciprocal Haven ratios of the protic TMG ILs are also considerably higher than those of other PILs such as ammonium70,71 or amidinium12 underlining its correlation with the highly basic nature of the precursor.12 To the best of our knowledge these are also the highest IHR values reported for PILs so far. Compared to other classes of ILs, most of the TMG-based ILs show high values for the reciprocal Haven ratio making them very interesting for electrochemical applications.72 The IHR values reported for imidazolium, for instance, range from 0.52 to 0.76,72 those of phosphonium ILs from 0.47 to 0.71 (ref. 27) and those of ammonium from 0.06 to 0.62.71 Values reported for AILs consisting of aromatic cations with similar molecular weight to the [C4C1TMG] cation are significantly lower (IHR([C8C1Im][NTf2]) ≈ 0.32; 1-methyl-1-octyl-pyrrolidinium NTf2: IHR([C8C1Pyrr][NTf2]) ≈ 0.41).60
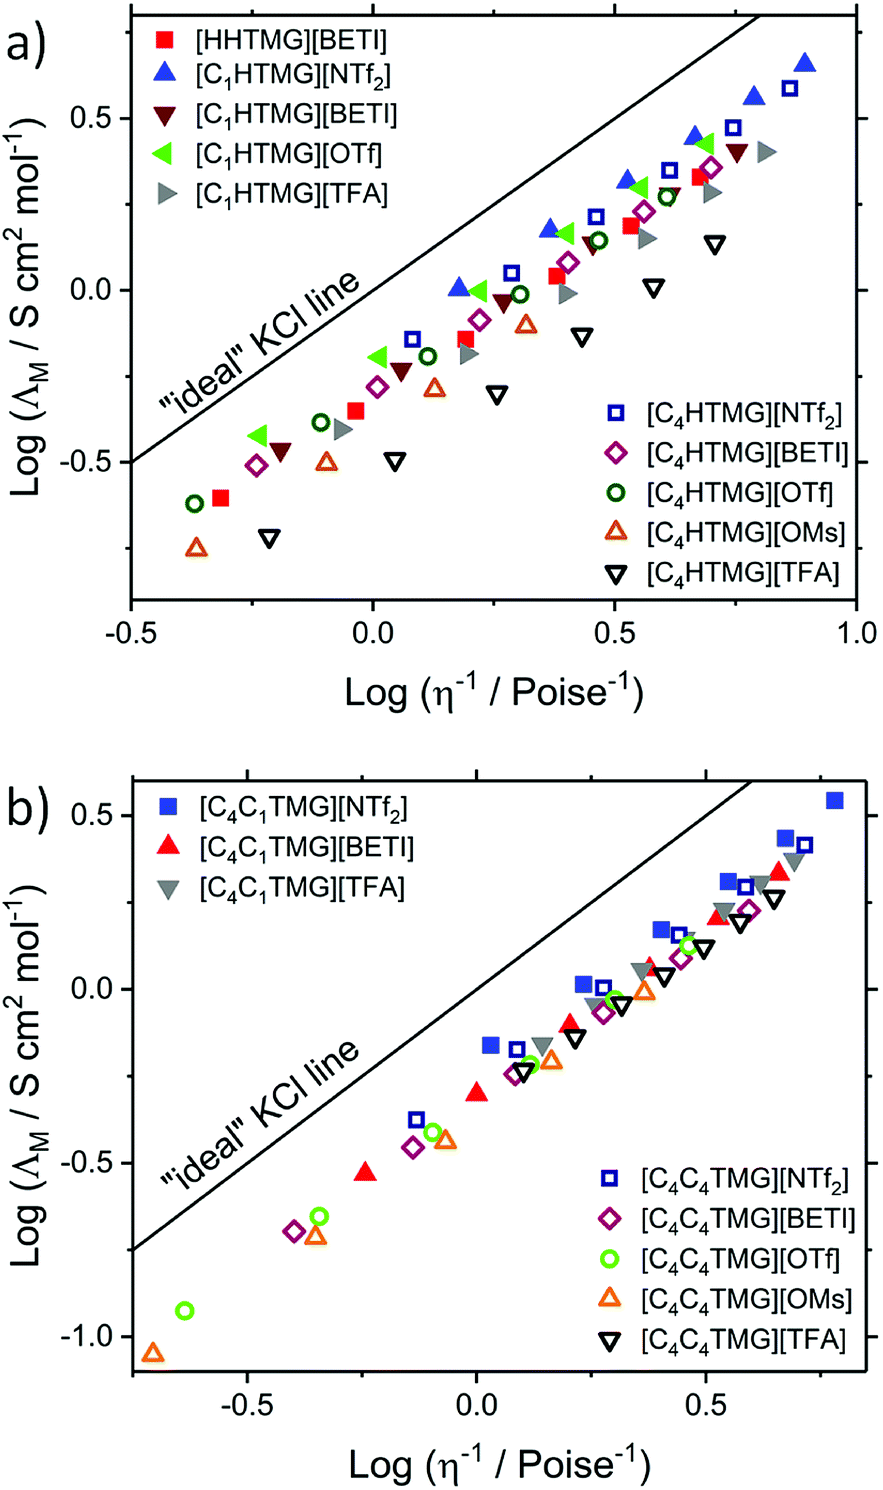
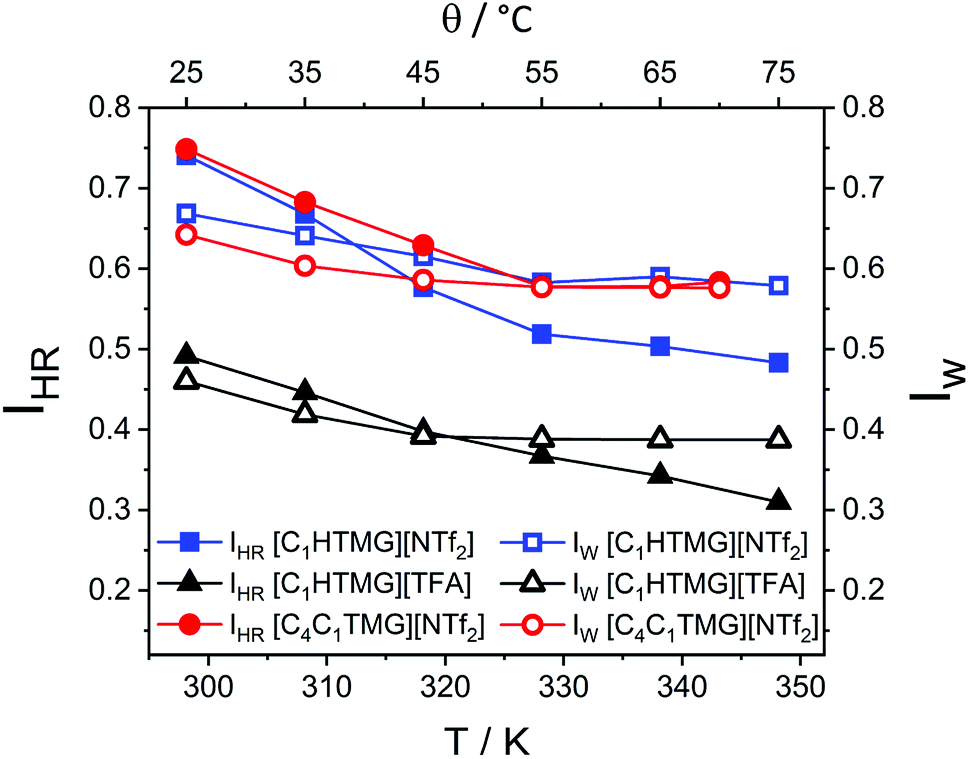
Due to its simplicity and easy interpretation, the Walden plots are also widely used in the literature.22 The Walden plots of the investigated ILs are shown in Fig. 4. Analysis of the PILs and AILs according to the fractional Walden rule (4) yield straight lines with slopes approximately unity (values given in Table S20†). Although being quite a straightforward approach, the findings for the ionicity trends quantified by the reciprocal Haven ratio are well reproduced. The ILs with the highest ionicities show the highest values for the parameter log(C) and vice versa. Since the Walden plot uses macroscopic parameters it can be seen as a practical measure for overall performance in which the highest log(C) values belong to highly conductive and highly fluid ILs. From the ratio of the measured molar conductivity to the ideal conductivity, the ionicity IW according to the Walden plot can be calculated (5). However this method remains a more qualitative approach. The obtained values for the single point measurements are listed in Table 3 and are in good agreement with the general trends of the ionicities IHR but smaller in their overall values, with [C4HTMG][OMs] being the only exception. The temperature dependent progression of the IHR and IW are shown in Fig. 5. Both show a slight decrease with temperature that is a bit more pronounced for the reciprocal Haven ratio. The highest overall IHR value was found for the AIL followed by the protic [NTf2] IL with minor interspacing. The protic [TFA] IL shows distinct lower reciprocal Haven ratios and IW values than the [NTf2] ones at all temperatures. Marginally decreasing or constant IHR values with temperature and a strong dependence on the pKa of the protonated anion are also found for a number of other IL systems such imidazolium,66,73 phosphonium27 and ammonium.70
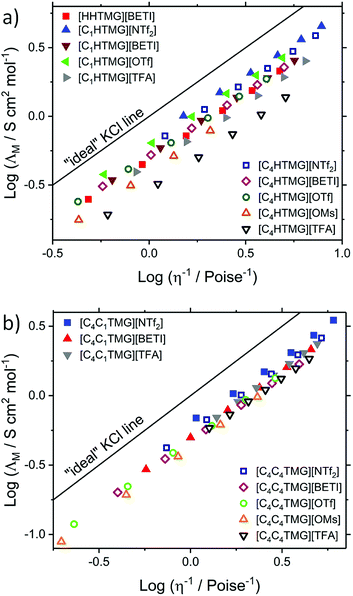 |
| | Fig. 4 Walden plots of (a) the protic and (b) aprotic TMG-ILs investigated in this study. Temperature of the data points increases from left to right. | |
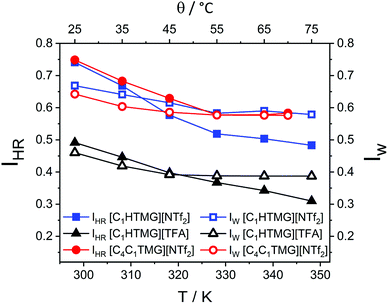 |
| | Fig. 5 Temperature dependent ionicity IHR as reciprocal Haven ratio and ionicity IW from Walden plot. Drawn lines are a guide to the eye. | |
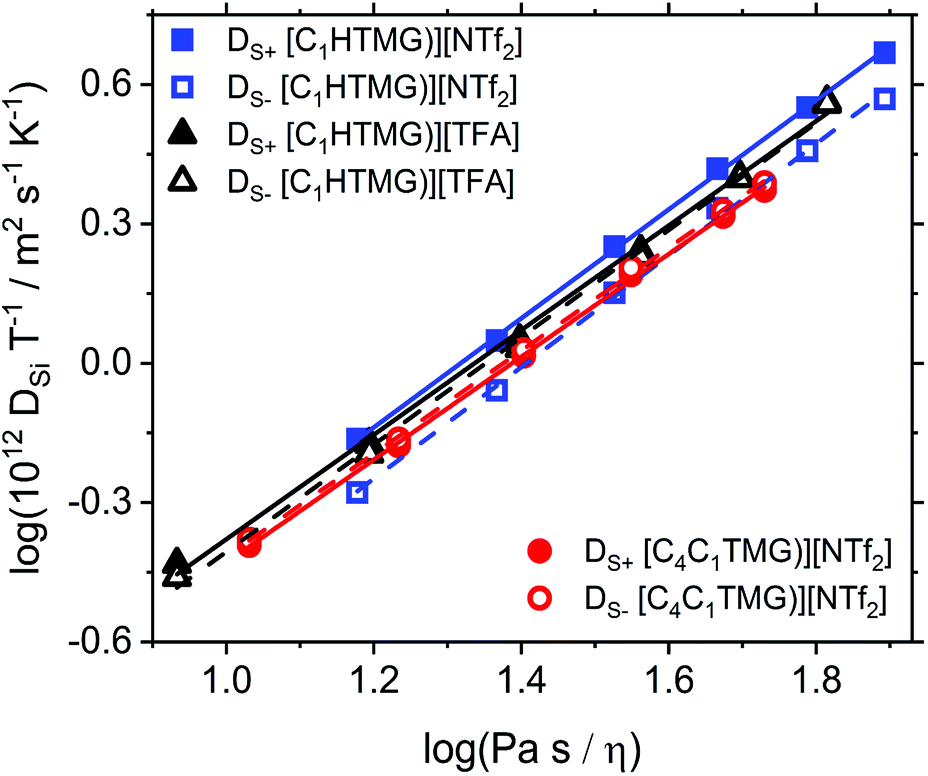
Stokes–Einstein–Sutherland relation, velocity cross-correlation and distinct diffusion coefficients
The Stokes–Einstein–Sutherland (SES) plot is an empirical viscosity correlation that relates the diffusion coefficients to the reciprocal viscosity (fluidity).21 The obtained SES-plot of the individual self-diffusion coefficients is shown in Fig. 6. All of the investigated ILs yield straight lines in the SES plot with slopes around unity (Table S21†). The exponents found for the cations were observed to be smaller than the ones for the anions in the same IL. Analogous plots can be performed for the viscosity scaling of the distinct diffusion coefficients Ddij calculated from the velocity cross-correlation coefficients (VCC) fij (7–10). These quantities are another interpretation of IL transport properties if self-diffusion and conductivity data are experimentally available. Contrary to the situation usually found in electrolyte solutions, the Ddij and VCC are all negative quantities in bulk ILs so that the velocities of the ions are anti-correlated in the ensemble as a result of the momentum conservation.5 The SES plot for the distinct diffusion coefficients is shown in Fig. 7 and their values could also be fitted linearly (see Table S22 and S23†). The VCC of the [NTf2] ILs obey the order f−− < f++ < f+− consistent with the findings for a number of other [NTf2] ILs investigated.21,61 In the protic [TFA] IL the order of f−− and f++ is reversed with smaller difference between the two quantities at all viscosities. As the anion–anion VCCs are largest in magnitude and most negative for the [NTf2] ILs, the anti-correlations of the ion velocities averaged over an ensemble are largest for these interactions. Then again for [C1HTMG][TFA] the cation–cation VCC are dominant. At the same viscosity the unlike-charged ions VCC f+− is the least negative in [C1HTMG][TFA]. This means that the anti-correlation of cation and anion is less pronounced leading to a higher discrepancy between expected and measured conductivity. Harris reported that the order of the like-ion VCCs may be related to the ion size and liquid structure and that the magnitude of ΔNE is proportional to the difference between f+− and the arithmetic mean of the like-ionic VCCs f−− and f++.31 This large difference compared to both the protic and aprotic [NTf2] IL is also found in [C1HTMG][TFA]. It reproduces the findings and quantifications of the larger deviation from ideal behaviour found by other approaches above although there are other assumptions about their origin in literature. However the findings also show that the deviation is related to the anion–cation combination and not to the difference of protic and aprotic ILs per se.
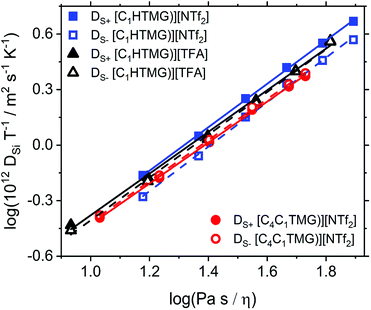 |
| | Fig. 6 Stokes–Einstein–Sutherland plot of the self-diffusion coefficients DSi as a function of fluidity (inverse viscosity). Solid lines are the linear fits for the cations, dashed ones for the anions. | |
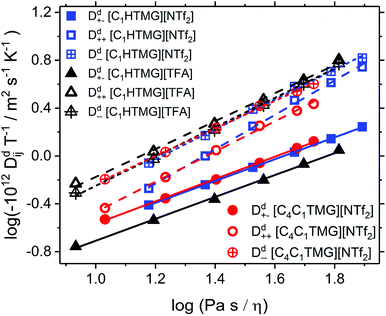 |
| | Fig. 7 Stokes–Einstein–Sutherland plot of the distinct self-diffusion coefficients Ddij as a function of fluidity (inverse viscosity). Note that all distinct diffusion coefficients are negative quantities so that −Ddij is plotted and the order of the VCCs is reversed. Solid lines are the linear fits for the Dd+−, dashed ones for the Dd++ and dotted for Dd−− lines are the linear fits for the Dd+−, dashed ones for the Dd++ and dotted for Dd−−. | |
Conclusions
We synthesised a series of protic and aprotic ILs based on the TMG cation. The used anions stem from a variety of acids with different pKa values. Although this type of IL shows beneficial characteristics for several implementations it is has not been comprehensively investigated so far. The cations are derivatives of super strong bases and have a delocalised π-system like the intensively investigated and applied imidazolium and pyridinium cations. The length of the attached alkyl side chain was varied for the sake of a systematic investigation. Most of these ILs have, to the best of our knowledge, not been reported in the literature before. We measured important fundamental properties such as thermal transitions and densities as well as the transport quantities viscosity, conductivity and self-diffusion coefficients. The ILs show a wide range of diverse phase-transition behaviours and many of them are RTILs or exhibit supercooled states. Temperature dependence of viscosity, molar conductivity and self-diffusion coefficients are empirically well described by the VFT (11) or Litovitz eqn (12). Scaling of and correlation between the transport properties were analysed by the Nernst–Einstein, Walden and Stokes–Einstein–Sutherland relations. The discrepancy between ideal electrolyte behaviour and experimental quantities was quantified by means of the ionicity IHR as reciprocal Haven ratio, fractional Walden approach and ionicity IW from Walden plot. All the TMG ILs show transport properties comparable to other ILs subclasses together with high ionicities, especially when compared to other PILs with more acidic cation protons/lower pKa values of the constituting base. Lower ionicity values were also found for the PILs that incorporate anions from acids with higher pKa values. Also the velocity-cross-correlation coefficients of the unlike-ions in [C1HTMG][TFA] exhibit less anticorrelation. This is the cause for its reduced conductivity in relation to the diffusive properties compared to the [NTf2] ILs. The results show that smaller discrepancies between expected and measured conductivity can be achieved for PILs with high ΔpKa between constituting acid and base. Furthermore the TMG PILs and AILs show comparable transport properties which are more related to the size of the cation rather than to the occurrence of an acidic proton in the PILs. These ‘pseudo AILs’ show characteristics similar to their alkylated analogues. This makes the TMG-based PILs promising candidates for practical applications that combine the advantages of PILs, such as economic synthesis and improved transport properties, due to lower molecular weight with the higher ionicity values usually found for AILs. These results provide a better understanding of guanidinium-based ILs, the difference between the PIL and AIL subclasses and the interrelations of their transport properties.
Conflicts of interest
There are no conflicts of interest to declare.
Acknowledgements
We gratefully acknowledge financial support by the German Research Foundation, DFG, grant number HE 2403/21-1.
References
- J. P. Hallett and T. Welton, Chem. Rev., 2011, 111, 3508–3576 CrossRef CAS PubMed.
- M. Watanabe, M. L. Thomas, S. Zhang, K. Ueno, T. Yasuda and K. Dokko, Chem. Rev., 2017, 117, 7190–7239 CrossRef CAS.
- G. G. Eshetu, M. Armand, H. Ohno, B. Scrosati and S. Passerini, Energy Environ. Sci., 2016, 9, 49–61 RSC.
- K. Dong, X. Liu, H. Dong, X. Zhang and S. Zhang, Chem. Rev., 2017, 117, 6636–6695 CrossRef CAS.
- K. R. Harris, T. Makino and M. Kanakubo, Phys. Chem. Chem. Phys., 2014, 16, 9161–9170 RSC.
- R. Hayes, G. G. Warr and R. Atkin, Chem. Rev., 2015, 115, 6357–6426 CrossRef CAS PubMed.
- P. A. Hunt, C. R. Ashworth and R. P. Matthews, Chem. Soc. Rev., 2015, 44, 1257–1288 RSC.
- T. Welton, Biophys. Rev., 2018, 10, 691–706 CrossRef CAS PubMed.
- C. A. Angell, N. Byrne and J.-P. Belieres, Acc. Chem. Res., 2007, 40, 1228–1236 CrossRef CAS PubMed.
- T. L. Greaves and C. J. Drummond, Chem. Rev., 2015, 115, 11379–11448 CrossRef CAS PubMed.
- K. Dong, S. Zhang and J. Wang, Chem. Commun., 2016, 52, 6744–6764 RSC.
- M. S. Miran, H. Kinoshita, T. Yasuda, M. A. B. H. Susan and M. Watanabe, Phys. Chem. Chem. Phys., 2012, 14, 5178 RSC.
- K. Abdur-Rashid, T. P. Fong, B. Greaves, D. G. Gusev, J. G. Hinman, S. E. Landau, A. J. Lough and R. H. Morris, J. Am. Chem. Soc., 2000, 122, 9155–9171 CrossRef CAS.
- M. S. Miran, H. Kinoshita, T. Yasuda, M. A. B. H. Susan and M. Watanabe, Chem. Commun., 2011, 47, 12676 RSC.
- J. Nowicki, M. Muszyński and J.-P. Mikkola, RSC Adv., 2016, 6, 9194–9208 RSC.
- S. Li, Y. Lin, H. Xie, S. Zhang and J. Xu, Org. Lett., 2006, 8, 391–394 CrossRef CAS PubMed.
- S. Fang, L. Yang, J. Wang, M. Li, K. Tachibana and K. Kamijima, Electrochim. Acta, 2009, 54, 4269–4273 CrossRef CAS.
- X. Lu, J. Yu, J. Wu, Y. Guo, H. Xie and W. Fang, J. Phys. Chem. B, 2015, 119, 8054–8062 CrossRef CAS.
- A. Castiglia, H. M. El Sehrawi, T. Orbegozo, D. Spitzner, B. Claasen, W. Frey, W. Kantlehner and V. Jäger, Zeitschrift für Naturforsch. B, 2012, 67, 337–346 CAS.
- G. Yu, D. Zhao, L. Wen, S. Yang and X. Chen, AIChE J., 2012, 58, 2885–2899 CrossRef CAS.
- K. R. Harris, J. Mol. Liq., 2016, 222, 520–534 CrossRef CAS.
- D. R. MacFarlane, M. Forsyth, E. I. Izgorodina, A. P. Abbott, G. Annat and K. Fraser, Phys. Chem. Chem. Phys., 2009, 11, 4962 RSC.
- K. Ueno, H. Tokuda and M. Watanabe, Phys. Chem. Chem. Phys., 2010, 12, 1649–1658 RSC.
- M. Yoshizawa, W. Xu and C. A. Angell, J. Am. Chem. Soc., 2003, 125, 15411–15419 CrossRef CAS PubMed.
- C. Schreiner, S. Zugmann, R. Hartl and H. J. Gores, J. Chem. Eng. Data, 2010, 55, 4372–4377 CrossRef CAS.
- H. Tokuda, K. Hayamizu, K. Ishii, M. A. B. H. Susan and M. Watanabe, J. Phys. Chem. B, 2004, 108, 16593–16600 CrossRef CAS.
- F. Philippi, D. Rauber, J. Zapp and R. Hempelmann, Phys. Chem. Chem. Phys., 2017, 19, 23015–23023 RSC.
- B. Kirchner, F. Malberg, D. S. Firaha and O. Hollóczki, J. Phys. Condens. Matter, 2015, 27, 463002 CrossRef PubMed.
- G. W. Driver, Y. Huang, A. Laaksonen, T. Sparrman, Y.-L. Wang and P.-O. Westlund, Phys. Chem. Chem. Phys., 2017, 19, 4975–4988 RSC.
- M. Gouverneur, J. Kopp, L. van Wüllen and M. Schönhoff, Phys. Chem. Chem. Phys., 2015, 17, 30680–30686 RSC.
- K. R. Harris, J. Phys. Chem. B, 2016, 120, 12135–12147 CrossRef CAS PubMed.
- O. Hollóczki, F. Malberg, T. Welton and B. Kirchner, Phys. Chem. Chem. Phys., 2014, 16, 16880–16890 RSC.
- H. K. Kashyap, H. V. R. Annapureddy, F. O. Raineri and C. J. Margulis, J. Phys. Chem. B, 2011, 115, 13212–13221 CrossRef CAS PubMed.
- D. W. McCall and D. C. Douglass, J. Phys. Chem., 1967, 71, 987–997 CrossRef CAS.
- H. G. Hertz, K. R. Harris, R. Mills and L. A. Woolf, Berichte der Bunsengesellschaft für physikalische Chemie, 1977, 81, 664–670 CrossRef CAS.
- K. R. Harris, J. Phys. Chem. B, 2010, 114, 9572–9577 CrossRef CAS PubMed.
- H. J. Schoenert, J. Phys. Chem., 1984, 88, 3359–3363 CrossRef CAS.
- T. Rüther, M. Kanakubo, A. S. Best and K. R. Harris, Phys. Chem. Chem. Phys., 2017, 19, 10527–10542 RSC.
- H. Vogel, Phys. Z., 1921, 22, 645–646 CAS.
- G. Tammann and W. Hesse, Zeitschrift für anorganische und allgemeine Chemie, 1926, 156, 245–257 CrossRef CAS.
- T. A. Litovitz, J. Chem. Phys., 1952, 20, 1088–1089 CrossRef CAS.
- K. R. Harris and M. Kanakubo, J. Phys. Chem. B, 2016, 120, 12937–12949 CrossRef CAS PubMed.
- K. R. Harris and M. Kanakubo, J. Chem. Eng. Data, 2016, 61, 2399–2411 CrossRef CAS.
- K. R. Harris, M. Kanakubo, D. Kodama, T. Makino, Y. Mizuguchi, M. Watanabe and T. Watanabe, J. Chem. Eng. Data, 2018, 63, 2015–2027 CrossRef CAS.
- E. Gómez, N. Calvar and Á. Domínguez, in Ionic Liquids - Current State of the Art, InTech, 2015 Search PubMed.
- CRC Handbook of Chemistry and Physics, ed. W. M. Haynes, Taylor & Francis Group, Boca Raton, 95th edn, 2014 Search PubMed.
- D. H. Wu, A. D. Chen and C. S. Johnson, J. Magn. Reson. Ser. A, 1995, 115, 260–264 CrossRef CAS.
- G. Annat, D. R. MacFarlane and M. Forsyth, J. Phys. Chem. B, 2007, 111, 9018–9024 CrossRef CAS PubMed.
- W. S. Price, P. Stilbs, B. Jönsson and O. Söderman, J. Magn. Reson., 2001, 150, 49–56 CrossRef CAS PubMed.
- G. H. Sørland, Dynamic Pulsed-Field-Gradient NMR, Springer Berlin Heidelberg, Berlin, Heidelberg, 2014, vol. 110 Search PubMed.
- C. S. Johnson, Prog. Nucl. Magn. Reson. Spectrosc., 1999, 34, 203–256 CrossRef CAS.
- S. J. Gibbs and C. S. Johnson, J. Magn. Reson., 1991, 93, 395–402 Search PubMed.
- R. Mills, J. Phys. Chem., 1973, 77, 685–688 CrossRef CAS.
- M. Holz, S. R. Heil and A. Sacco, Phys. Chem. Chem. Phys., 2000, 2, 4740–4742 RSC.
- L. G. Longsworth, J. Phys. Chem., 1960, 64, 1914–1917 CrossRef CAS.
- K. R. Harris, B. Ganbold and W. S. Price, J. Chem. Eng. Data, 2015, 60, 3506–3517 CrossRef CAS.
- A. Martinelli, M. Maréchal, Å. Östlund and J. Cambedouzou, Phys. Chem. Chem. Phys., 2013, 15, 5510 RSC.
- J. N. A. Canongia Lopes and A. A. H. P. Pádua, J. Phys. Chem. B, 2006, 110, 3330–3335 CrossRef CAS PubMed.
- A. E. Andreatta, A. Arce, E. Rodil and A. Soto, J. Chem. Thermodyn., 2009, 41, 1317–1323 CrossRef CAS.
- J.-M. Andanson, N. Papaiconomou, P.-A. Cable, M. Traïkia, I. Billard and P. Husson, Phys. Chem. Chem. Phys., 2017, 19, 28834–28840 RSC.
- K. R. Harris, L. A. Woolf, M. Kanakubo and T. Rüther, J. Chem. Eng. Data, 2011, 56, 4672–4685 CrossRef CAS.
- K. Tsunashima, M. Fukushima and M. Matsumiya, Electrochemistry, 2012, 80, 904–906 CrossRef CAS.
- J. Vila, P. Ginés, J. M. Pico, C. Franjo, E. Jiménez, L. M. Varela and O. Cabeza, Fluid Phase Equilib., 2006, 242, 141–146 CrossRef CAS.
- O. Zech, A. Stoppa, R. Buchner and W. Kunz, J. Chem. Eng. Data, 2010, 55, 1774–1778 CrossRef CAS.
- K. Tsunashima and M. Sugiya, Electrochem. Commun., 2007, 9, 2353–2358 CrossRef CAS.
- H. Tokuda, K. Hayamizu, K. Ishii, M. A. B. H. Susan and M. Watanabe, J. Phys. Chem. B, 2005, 109, 6103–6110 CrossRef CAS PubMed.
- J. Vila, L. M. Varela and O. Cabeza, Electrochim. Acta, 2007, 52, 7413–7417 CrossRef CAS.
- S. Papović, S. Gadžurić, M. Bešter-Rogač and M. Vraneš, J. Chem. Thermodyn., 2016, 102, 367–377 CrossRef.
- J. Haddad, D. Pontoni, B. M. Murphy, S. Festersen, B. Runge, O. M. Magnussen, H.-G. Steinrück, H. Reichert, B. M. Ocko and M. Deutsch, Proc. Natl. Acad. Sci. U. S. A., 2018, 115, E1100–E1107 CrossRef CAS PubMed.
- M. Martinez, Y. Molmeret, L. Cointeaux, C. Iojoiu, J. C. Leprêtre, N. El Kissi, P. Judeinstein and J. Y. Sanchez, J. Power Sources, 2010, 195, 5829–5839 CrossRef CAS.
- S. K. Davidowski, F. Thompson, W. Huang, M. Hasani, S. A. Amin, C. A. Angell and J. L. Yarger, J. Phys. Chem. B, 2016, 120, 4279–4285 CrossRef CAS PubMed.
- H. Tokuda, S. Tsuzuki, M. A. B. H. Susan, K. Hayamizu and M. Watanabe, J. Phys. Chem. B, 2006, 110, 19593–19600 CrossRef CAS PubMed.
- B. E. Mbondo Tsamba, S. Sarraute, M. Traïkia and P. Husson, J. Chem. Eng. Data, 2014, 59, 1747–1754 CrossRef CAS.
Footnote |
| † Electronic supplementary information (ESI) available: Syntheses of the ionic liquids and intermediates as well as the corresponding NMR spectra; experimental parameters, obtained data and fit results. See DOI: 10.1039/c8ra07412g |
|
| This journal is © The Royal Society of Chemistry 2018 |
Click here to see how this site uses Cookies. View our privacy policy here. 
 Open Access Article
 This Open Access Article is licensed under a Creative Commons Attribution-Non Commercial 3.0 Unported Licence
 ab,
Frederik Philippi
ab,
Frederik Philippi