 Open Access Article
Effect of thermal treatment of Pd decorated Fe/C nanocatalysts on their catalytic performance for formic acid oxidation
Weiping Li *a,
Tianxiang Zhoua,
Zhilu Lea,
Mengyin Liao*b,
Hesheng Liua,
Bing Na
 a,
Bin Wanga,
Haiying Zhoua and
Heng Yanb
aJiangxi Province Key Laboratory of Polymer Micro/Nano Manufacturing and Devices, East China University of Technology, Nanchang 330013, China. E-mail: liweiping@ecit.cn; Fax: +86-791-83897792; Tel: +86-791-83897792
bInstitute of Energy Conversion, Jiangxi Academy of Sciences, Nanchang 330096, China. E-mail: lmy1324@126.com; Fax: +86-791-88175782; Tel: +86-791-88330501
First published on 16th October 2018
Abstract
The thermal treatment of bimetallic nanocatalysts plays an important role in determining their catalytic performance. Here tuning the surface oxidized metal species of bimetallic Pd–Fe electrocatalysts for the formic acid (FA) oxidation reaction is reported and a correlation between the surface oxidized metal species of the Pd–Fe nanoparticles and their catalytic activities is proposed. The structural details of the Pd–Fe/C catalysts are characterized by X-ray diffraction, X-ray photoelectron spectroscopy and high-sensitivity low-energy ion scattering (HS-LEIS). Cyclic voltammetry measurements demonstrated that the mass activity of the Pd–Fe nanoparticles with a molar ratio of Pd/Fe = 1/15 is about 7.4 times higher than that of Pd/C. This enhancement could be attributed to the synergistic effect between Pd(0) and Pd oxidized species on the surface of the Pd–Fe/C treated sample and electronic effects. This finding demonstrates the importance of surface oxidized metal species at the nanoscale in harnessing the true electrocatalytic potential of bimetallic nanoparticles and opens up strategies for the development of highly active bimetallic nanoparticles for electrochemical energy conversion.
1. Introduction
While direct formic acid fuel cells (DFAFCs) have attracted considerable research interest due to their promising high conversion efficiency, low pollution, and high power density for a wide range of applications, a key challenge to the ultimate commercialization of the energy conversion devices is the development of robust, active, and low-cost catalysts.1 Currently, the tailored design of Pd-based bimetallic catalysts (e.g., PdFe, PdAu, PdNi, PdCo, PdCu, etc.) has been an important focal area of research and development of active, robust, and low cost catalysts for achieving the ultimate commercialization of fuel cells.2–6 The enhanced electrocatalytic activity in such catalysts has been attributed to serious factors, such as lattice,7,8 electronic6 and Pd-skin effects9–12 and so on. Furthermore, some of these factors can be controlled in different ways. For instance, the thermal treatment can induce changes in catalyst properties such as particle size, shape, alloying degree, surface enrichment, and so forth.13–16 Most of the studies have focused on bimetallic catalyst systems largely due to the relative simplicity of structural characterization, whereas a limited amount of work has centered on surface oxidized metal species of the bimetallic catalyst including our previous work.17,18The fundamental studies on surfaces have exhibited that the activity of an electrocatalyst can be designed by its surface electronic structure, which, if properly controlled, can thoroughly enhance the electrocatalytic activity.19–23 However, achievement of this enhancement in nanomaterials has been challenging due to its difficulty in controlling surface structure at the nanoscale. While precise control over surface structure is critical to obtain the most optimum catalytic activity,19,21 and mastering the ability to control surface structure for nanoparticles is a critical step toward applications in direct formic acid fuel cells. For instance, V. R. Stamenkovic et al.24 showed a fundamental relationship in electrocatalytic trends on Pt3M (M = Ni, Co, Fe, Ti, V) surfaces between the experimentally determined surface electronic structure (the d-band centre) and activity for the oxygen-reduction reaction. Zhong et al.25 prepared PtNiCo catalysts via thermal treatment, focusing on understanding the effects of lattice strain and surface properties (surface oxidation state) on activity and stability. Wei et al.13 reported the synergetic effect of Co alloying and heat-treatment in inert, reducing, and oxidative atmosphere on ORR activity and the activity enhancement was attributed to Pd surface oxide formation. Neergat et al.14 studied the Pd–Co catalysts with various compositions and heat-treatment in an oxygen-containing atmosphere, it was found that the catalysts formed oxides and the ORR activity of the catalyst subjected to the oxidative thermal treatment was higher than that of Pd. However, a direct correlation between tailored surface oxidized metal species of nanoparticles and their catalytic activities, particularly in a low pH environment mimicking a proton-exchanged membrane electrolyte, still remains elusive due to the fact that few metals are stable in acid and that a very limited number of techniques can allow quantification of surface oxidized metal species of nanoparticles.20
In this paper, we report the results from a study of the surface oxidized metal species of Pd–Fe nanoparticles with different bimetallic composition before and after thermal treatment. The Pd–Fe/C nanocatalyst was successfully synthesized using a spontaneous displacement reaction, followed by thermal treatment under controlled temperature and atmosphere. The bimetallic surface structure is determined by X-ray photoelectron spectroscopy (XPS), high-sensitivity low-energy ion scattering (HS-LEIS). By tuning the surface oxide of the Pd–Fe nanoparticles, we established a direct correlation between surface oxidized metal species and catalytic activities of Pd–Fe nanoparticles for the FA electro-oxidation reaction. We find that the intrinsic activities of Pd–Fe nanoparticles with a bulk nanoparticle composition of Pd/Fe = 1/15 can be enhanced by at least an order of magnitude, thereby demonstrating the importance of surface oxidized metal species for energy conversion nanomaterials.
2. Experimental
2.1. Synthesis of PdFe nanoparticles
The Pd–Fe/C nanocatalyst was synthesized via a two-step procedure.26,27 Firstly, the Fe core was synthesized by means of FeSO4 reduction using NaBH4 with violent shaking in argon atmosphere at room temperature. Secondly, a spontaneous displacement reaction between PdCl42− and Fe atoms in the outer layer of the Fe nanoparticles was applied to synthesize the Pd–Fe/C nanocatalyst. In the first step, 10 mg Vulcan XC-72 carbon particles were dispersed in 6 mL water under sonication condition for 120 min. After that, the mixture was degassed by stirring and purged with argon for at least 30 min to make sure that the mixture was free from dissolved O2. Then 9.6 mg NaBH4 were added to the carbon containing water and 2 mL of FeSO4 (0.09 M) was added drop-wise into the mixture to reduce Fe2+ to Fe0, which was violent shake for 15 min till the hydrogen was released completely. In the second step, a solution of 3.93 mg K2PdCl4 (1 g/100 mL) was added drop-wise in the Fe/C suspension. After 20 min ultrasonic blending, the resulting powders were collected by filtration and washed with deionized water until no chloride anion in the filtrate, and drying in a vacuum oven overnight, by which the Pd–Fe/C nanocatalyst (molar ratio, Pd/Fe = 1/15) was obtained.2.2. Assembly of PdFe nanoparticles on carbon and subsequent thermal treatment
The preparation of the carbon-supported catalysts followed our earlier protocols with slight modifications. Briefly, the protocol involved assembly of the as-synthesized nanoparticles on carbon support, followed by thermal treatment under controlled temperature and atmosphere. The thermal treatment involved heating the catalyst from room temperature (RT) to 300 °C under N2/O2 (5% oxygen and 95% nitrogen by volume) and holding at this temperature for 2 h for Pd–Fe/C, followed by cooling to RT. The actual loading was controlled in the range 40 to 50% by the total mass of Pd and Fe.2.3. Structural and compositional characterizations
A Technai F30 transmission electron microscope (TEM) operating at 300 keV was employed to evaluate the particle size and its distribution as well as morphology. The samples for TEM were dispersed in ethanol by ultra-sonication and then mounting the dispersed particles onto copper grids covered with a holey carbon film and then dried in air.Powder X-ray diffraction data (XRD) were collected on a Panalytical X'Pert PRO X-ray diffractometer using Cu KR radiation in scan-step mode from 2θ = 10–90°. The measurements were done in reflection geometry and the diffraction (Bragg) angles 2θ were scanned at a step of 0.0167°. Each data point was measured for at least 20 s and several scans were taken on each sample. The scans were combined to reduce the effect of the instrument's instability and improve the statistical accuracy of the diffraction data.
X-ray photoelectron spectroscopy (XPS) characterization was conducted to assess the surface composition and chemical states of the samples on a PHI-Quantum 2000 spectrometer. Samples originally in powder form were pressed into a wafer for analysis as required. Binding energies were calibrated by referencing C1s at 284.6 eV as previous reference recommended.
The high-sensitivity low-energy ion scattering (HS-LEIS) test was carried out on an IonTOF Qtac100 low-energy ion scattering analyzer, with a 20Ne+ beam energy of 5 keV with a sample current 1.6 nA and a low ion flux equal to 445 pA cm−2 and the scattering angle was 145°.
2.4. Electrochemical characterization
The electrochemical measurements of catalysts were tested using an electrochemical workstation (CHI750d). A common three-electrode electrochemical cell was used for the measurements.28 The working electrode was prepared by ultrasonicating 10 mg of the catalyst powder with 5 mL of aqueous solution containing 1 mL of isopropanol and 20 μL of a 0.25 wt% Nafion solution (diluted from a 5 wt% Nafion solution with ethanol, DuPont). 10 μL of the homogeneous catalyst ink was then dropcast onto a glassy carbon (GC) electrode and let it dry at room temperature. Cyclic voltammetry (CV) was conducted with a Pt flag counter electrode, a freshly polished GC working electrode (5 mm, Pine Instruments), and a saturated calomel electrode reference electrode. The potentials reported here are in reference to the saturated calomel electrode (SCE). All electrochemical experiments were recorded at room temperature. For assessing the electrocatalytic activity of the working electrode, cyclic voltammetry was obtained in 0.1 M HClO4 + 0.5 M FA solution with a scan rate of 50 mV s−1. For the durability test, the chronoamperometric experiments were carried out at 0.1 V for 3000 s in the same electrolyte.3. Results and discussion
3.1. Composition and morphology
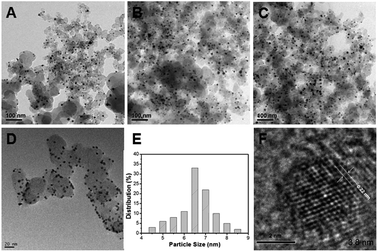
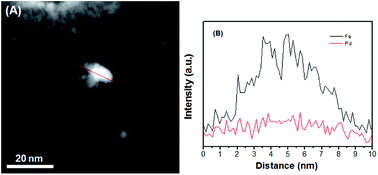
In the present work, the question of how the thermal treatment influences the catalytic performance was investigated by examining carbon-supported Pd–Fe nanoparticle treated at 300 °C as function of Pd/Fe molar ratios. Fig. 1 shows the TEM images of (A) Pd–Fe/C (Pd/Fe = 1/5) treated sample, (B) Pd–Fe/C (Pd/Fe = 1/10) treated sample, (C) Pd–Fe/C (Pd/Fe = 1/15) treated sample and (D) Pd–Fe/C catalyst. It can be seen that all the metal particles are well dispersed on the carbon. The average particle for the (D) Pd–Fe/C catalyst is 3.8 nm. The average particle for the Pd–Fe/C (Pd/Fe = 1/5, 1/10 and 1/15) treated at 300 °C catalysts is 7.1 ± 0.6 nm, 6.9 ± 0.7 nm and 6.8 ± 0.7 nm in sequence. These image results indicate that the thermal treatment has produced the increased particle size. From Fig. 1E, it can be seen that the average size for Pd–Fe/C (Pd/Fe = 1/15) treated sample with a narrow size distributions. Zhou et al.29 investigated the effect of particle size on formic acid electrooxidation using carbon supported Pd nanoparticles with different sizes (2.7–9.0 nm) and reported that 5–7 nm Pd nanoparticles are most favorable for formic acid electrooxidation. Note that the Pd–Fe nanoparticles synthesized in this work are within the optimal size range. Based on the HRTEM image of Pd–Fe/C (Pd/Fe = 1/15) treated sample (Fig. 1F), the observed lattice fringe of 0.22 nm, corresponding likely to Pd (111) plane, is indicative of the highly-crystalline nature of the particles. However, the observation of no significant structure in the Pd–Fe nanoparticle was not surprising.To further obtain the Pd–Fe nanostructure in the Pd–Fe/C catalyst, the elemental analysis was carried out by Cs-corrected high angle annular dark field-scanning transmission electron microscopy (HAADF-STEM). Fig. 2 shows the line profiles for Pd and Fe element obtained by scanning e-beam across single PdFe nanoparticle in Pd–Fe/C(Pd/Fe = 1/15) treated at 300 °C. It can be clearly seen that the Pd peak (red line) is slightly lower than the Fe peak (black line), indicating that Pd and Fe existed in this Pd–Fe nanoparticle. It is difficult to demonstrate the structure of Pd–Fe nanoparticle.
3.2. Nanocrystal phase properties
XRD patterns of the prepared catalysts are shown in Fig. 3. The positions of characteristic diffraction peaks of face-centered cubic structure for Pd and PdO are labeled as triangle and square, respectively. From Fig. 3, the diffraction peak at 20–25° observed in all the XRD patterns of the carbon-supported nanocatalysts is due to the (002) reflection of the graphitic nature of Vulcan XC-72 carbon support. For Pd/Fe = 1/5, 1/10, 1/15 treated samples (curves a, b and c), the diffraction peaks at about 40.23°, 46.66° and 68.30° can be attributed to the Pd (111), (200) and (220) reflections respectively, which are similar to that for Pd nanoparticles.26 For Pd/Fe = 1/5, 1/10 and 1/15 treated samples (Fig. 3 curve a, b and c), the main peak located at about 33.8° is assigned to PdO (101), the other four weak located at about 40.2°, 54.8°, 60.4°, and 71.5° are attributed to PdO (110), (112), (103) and (202), respectively.30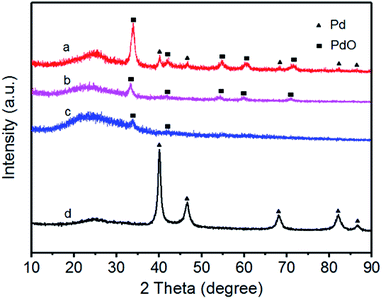 | ||
| Fig. 3 XRD patterns for (a) Pd–Fe/C (Pd/Fe = 1/5) treated at 300 °C, (b) Pd–Fe/C (Pd/Fe = 1/10) treated at 300 °C, (c) Pd–Fe/C (Pd/Fe = 1/15) treated at 300 °C and (d) Pd–Fe/C catalyst. | ||
As can be observed clearly, there are Pd and PdO diffraction peaks for 1/5 treated sample, whereas only PdO diffraction peaks for 1/10 and 1/15 treated samples. Moreover, the relatively intensity of the main peak at around 33.8° becomes thinner gradually as the Pd feeding decreases, indicating the amount of PdO decrease or the crystallinity is lower. The absence of any diffraction peaks for Fe is most likely due to the heavy atom effect from Pd as a result of the formation of oxidized Pd or Pd (0) rich in the surface.31 Li et al.32 synthesized the PdFe nanorods and their XRD patterns showed that no Fe diffraction peaks were observed for PdFe-NR sample. Zhang et al.33 prepared the PdFe-nanoleaves through a wet chemistry-based solution phase reduction and the XRD results indicated that no obvious diffraction peaks for Fe, Fe2O3, or other Fe oxides were observed. It suggested that most of the Fe (primarily associated with the Fe-rich sheets) was either amorphous in nature or fine-scaled nanocrystalline. Therefore, we deduced that most of oxidized Pd or Pd (0) was deposited on the surface of the Pd–Fe bimetallic nanoparticles.
3.3. Nanocrystal surface composition
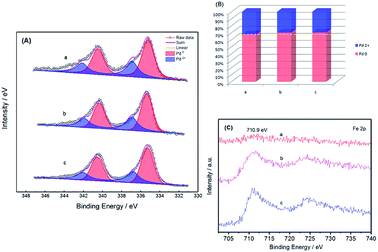
The chemical states of Pd and Fe after thermal treatment were also investigated by XPS. Fig. 4 shows the Pd 3d and Fe 2p regions for Pd–Fe/C catalysts treated at 300 °C with different Pd/Fe ratios. As is shown in Fig. 4A, the most intense set of doublet (Pd 3d3/2 and 3d5/2 at 335.35 and 340.60 eV for Pd–Fe/C treated sample is characteristic of metallic Pd, which show a shift to a higher binding energy as compared with 335.1 eV for pure Pd 3d3/2.34 The upshift of the binding energy for Pd in Pd–Fe/C could be ascribed to the electron transfer from Fe to Pd due to the formation of the Pd–Fe bimetallic nanocatalysts and the lower electronegativity of Fe. The second and weaker set of doublet (at 336.82 and 342.08 eV for Pd–Fe/C) could be assigned to Pd in oxidized forms such as PdO and PdO2 species. From Fig. 4B and Table 1, The ratio of Pd2+/(Pd2+ + Pd0) was found to be in the order of Pd–Fe/C (Pd/Fe = 1/5) > Pd–Fe/C (Pd/Fe = 1/10) > Pd–Fe/C (Pd/Fe = 1/15) treated at 300 °C catalysts. Interestingly, Fig. 4C presents the XPS spectra for the Fe 2p region, characterized by the 2p peaks at 710.92 eV and intense satellite peaks at higher binding energies of 724.56 eV, which can be assigned to the formation of Fe3O4 species.35 No obvious peaks of metallic Fe (708 eV) were observed, which indicated that Fe oxides were the predominant species on the Pd–Fe surface. The formation of Fe oxides is due to the oxidation of Fe atoms on the surface. With decreasing Pd feeding for Pd/Fe = 1/5, 1/10, 1/15 treated at 300 °C samples, the peaks of Fe 2p for Pd–Fe/C nanocatalysts became sharper. Therefore, the relative ratios of the oxidized species to the reduced one seem to be quite dependent on the feeding and thermal treatment. From Table 1, we can see that Pd and Fe atomic fractions determined by ICP-AES were on the verge of the feeding ratio. And no Pd can be detected in the filtrated solution after displacement, indicating a completely spontaneous displacement of Pd and Fe during synthesis. Therefore, we deduced that most of Pd (0) or Pd oxidized species were deposited on the surface of Pd–Fe/C catalysts.| Nanocatalysts | ICP-AES(Pd/Fe) | Surface composition Pd2+/(Pd2++Pd0) (%) |
|---|---|---|
| Pd/Fe = 1/5 (a) | 1/3.94 | 32.4 |
| Pd/Fe = 1/10 (b) | 1/8.89 | 29.8 |
| Pd/Fe = 1/15 (c) | 1/13.45 | 29.6 |
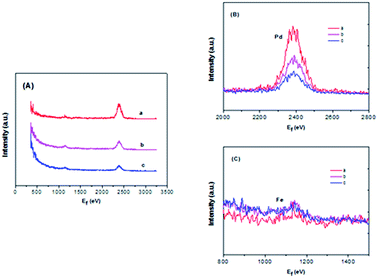
In order to obtain sufficient evidence to explain the formation of the decorated structure in the catalyst, high-sensitivity low-energy ion scattering (HS-LEIS) measurements have been carried out because HS-LEIS is a surface-sensitive analytical technique used to characterize the chemical and structural makeup of materials and a powerful technique for understanding the atomic composition of the outmost atomic layer of the surface.36 In Fig. 5, it is known that the Ne+ ions can provide better sensitivities for heavier elements but not suitable for the measurement of lighter elements. Fig. 5B and C clearly shows that Pd and Fe co-exist on the outmost surface of the Pd–Fe/C (Pd/Fe = 1/5, 1/10, 1/15) treated samples, and with decreasing Pd feeding for Pd–Fe/C (Pd/Fe = 1/5, 1/10, 1/15), the intensity of the Pd signal obviously decreased and that of the Fe signal snugly increased due to the weaker sensitivity for Fe compared with Pd. Therefore, these HS-LEIS results provide further evidence for the formation of the most of Pd (0) or Pd oxidized species deposited on the surface.
3.4. Electrocatalytic activity for formic acid oxidation reaction
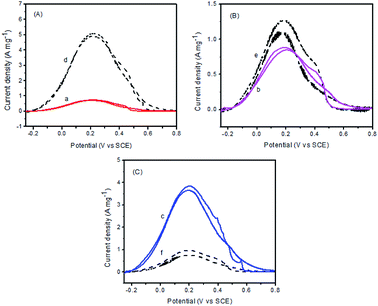
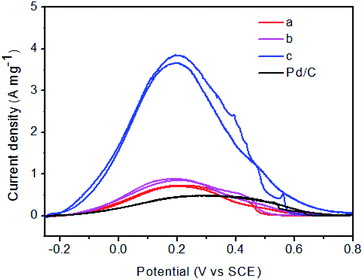
As will be discussed in details, on the basis of the above structural characterization results, surface oxidized metal species have played important roles in the enhancement of the catalytic activity. Cyclic voltammetric measurements were performed to assess the electrocatalytic activities of these catalysts for formic acid oxidation. Fig. 6 shows a typical set of voltammograms for Pd–Fe/C catalysts and Pd–Fe/C catalysts treated at 300 °C in N2-saturated 0.1 M HClO4 + 0.5 M FA solution with a scan rate of 50 mV s−1 at room temperature in the potential range of −0.25–0.8 V. From Fig. 6A, it is important to note that, for Pd–Fe/C (Pd/Fe = 1/5) catalyst (curve d), the current density is much higher than the Pd–Fe/C (Pd/Fe = 1/5) catalyst treated at 300 °C (curve a). Moreover, like Pd–Fe/C (Pd/Fe = 1/10) catalyst (curve e in Fig. 6B), the current density is slightly higher than the Pd–Fe/C (Pd/Fe = 1/10) catalyst treated at 300 °C (curve b). However, in contrast to the Pd–Fe/C (Pd/Fe = 1/15) catalyst (curve f in Fig. 6C), the current density is much lower than the Pd–Fe/C (Pd/Fe = 1/15) catalyst treated at 300 °C (curve c).Fig. 7 shows the cyclic voltammetric curves for FA oxidation for Pd–Fe/C treated at 300 °C with different Pd/Fe ratios and Pd/C catalysts. When the atomic ratio of Pd and Fe atoms was 1/15, the catalytic activity was found to display a maximum. When the atomic ratio of Pd and Fe atoms reached 1/5 and 1/10, the catalytic activity was found to markedly decrease. The catalytic activity of the Pd–Fe/C (Pd/Fe = 1/15) treated sample (3.7 A mg−1) is 4.1 times that of the Pd–Fe/C (Pd/Fe = 1/10) treated sample (0.9 A mg−1), 5.3 times that of the (Pd/Fe = 1/5) treated sample (0.7 A mg-1), and 7.4 times that of Pd/C (0.5 A mg−1). It is important to note that, the backward peak of Pd–Fe/C treated sample voltammogram is as high as the first forward peak. As reported by Arenz et al.37 the interaction of the formic acid molecule with Pt and Pd atoms is completely different. While Pd has in the entire potential region a propensity to break only the O–H bonds of the HCOOH molecule, Pt has a propensity to break both the C–O and/or C–H bond (at low potential) as well as the O–H bond (at higher potential). Consequently, HCOOH oxidation on Pd atoms proceeds exclusively through the dehydrogenation reaction step, while on Pt at low potentials the dehydration reaction pathway is predominant. Therefore, such a catalytic behaviour of Pd–Fe/C treated sample is very similar to that of Pd/C toward FA oxidation where Pd facilitates the formic acid oxidation via the dehydrogenation step.38 Nevertheless, the generation of minimal COads on the surface of Pd nanoparticles still leads to the rapid decay of catalytic activity.39
The above results provided important information for understanding the origin of the enhanced eletrocatalytic activity of PdFe surfaces toward FA oxidation. From Fig. 1, the particle size of PdFe/C treated samples became larger and Pd active sites on the surface of PdFe nanoparticles became less, which is consistent with XPS data. It is important to note that, the interactions between metal and metal, metal and supporter could be intensified via thermal treatment, whereas it leads to the stronger adsorption of COads on Pd. Gojković et al.40 prepared carbon-supported PtRu electrocatalyst towards methanol oxidation and found that cyclic voltammetry of the sample reflects the amount of Ru in the catalyst and its ability to absorb OH radicals and reaction between methanol residues adsorbed on Pt sites and OH radicals adsorbed on Ru sites was postulated to be rate-determining step. Moreover, density functional theory (DFT) calculations indicated that OH could also adsorb in the parallel-like orientation to the surface with its O atom binding on atop of a Pt atom and its H atom pointing either to the nearest-neighbor Pt or to the diagonal Pt atom.41 For PdFe/C treated samples in acidic electrolytes, Fe is not effective in producing surface oxygenated species to facilitate oxidation of COads, so surface oxidation state (PdO) is helpful to remove the intermediate COads species. We deduced that PdO provide its O atom to the intermediates COads, forming the final product CO2. Moreover, during the formic acid electrochemical oxidation over the Pd surface, HCOOads (HCOO–Pd) is first formed as a reactive intermediate species via breaking the O–H bond in HCOOH.39,42,43 Once HCOOads is formed, it then can decompose to CO2 through a transition state, for example a tilted bridge-bonded configuration with two Pd O bonds and an H atom approaching to the Pd site,42 indicating that the Pd0 active sites play an important role in formic acid oxidation. Therefore, appropriate proportion of Pd(0) and Pd oxidized species was one of most important factors to influence current densities.As shown in XPS analysis, there is apparently electronic interaction between Pd and Fe. However, the eletrocatalytic activity of Pd–Fe/C (Pd/Fe = 1/5) treated sample decreased, indicating that electronic interaction alone could not be responsible for the enhanced electrocatalytic activity of the Pd–Fe/C treated samples in the FA oxidation. Moreover, Fe may induct geometrically a catalytic enhancement by separating the active Pd sites in the way resisting potential poisoning. It might also get hydroxylated to mediate favorably the electron transfer of formic acid oxidation. Therefore, the enhancement of FA oxidation on Pd–Fe/C treated samples could be contributed to the synergistic effect in terms of both the Pd0 surface active sites and removal of intermediate COads species by Pd oxidized species.
To further evaluate the stability of the Pd–Fe/C catalysts for FA oxidation, we compared the current–time curves of selected Pd–Fe/C (Pd/Fe = 1/15) before (curve f) and after (curve c) thermal treatment samples with that of Pd/C catalysts at 0.1 V. As shown in Fig. 8, a decrease in the current density with time was found in all the samples because the influence of generated CO2 cannot be eliminated, which leads to the marked decrease at the beginning. The “final” intrinsic activity of Pd/C, Pd/Fe = 1/15 (curve f) and Pd/Fe = 1/15 treated at 300 °C (curve c) catalysts after 3000 s is 0.01, 0.20 and 0.47 A mg−1, respectively. This “final” activity of the Pd/Fe = 1/15 treated at 300 °C catalyst is about 47 times as high as that of Pd/C catalyst. It indicates that the electrocatalytic durability of Pd/Fe = 1/15 treated sample for formic acid oxidation is much higher than that of Pd/C catalyst. The above results demonstrate the superiority of Pd/Fe = 1/15 treated sample over the Pd/Fe = 1/15 and Pd/C samples in terms of both the catalytic activity and stability towards formic acid oxidation.
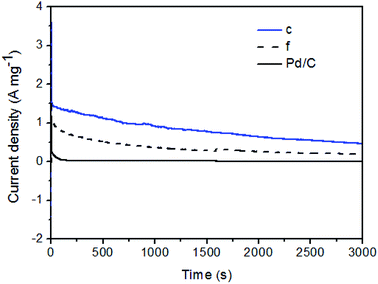 | ||
| Fig. 8 Chronoamperometric data for Pd/C and Pd–Fe/C (Pd/Fe = 1/15) (f) and treated at 300 °C (c) catalysts in N2-saturated 0.1 M HClO4 + 0.5 M HCOOH solution at a given potential of 0.1 V vs. SCE. | ||
4. Conclusions
In summary, we present a correlation between electrocatalytic activities and surface oxidized metal species of Pd–Fe bimetallic nanoparticles. Our finding demonstrates that tuning the surface oxidized metal species is critical to enhance the catalytic activity and that, without it, the as-measured catalytic activity may not be representative of the true catalytic potential of nanoparticles. The combined weight of the results of TEM, XRD, XPS and HS-LEIS measurement has provided evidence supporting the correlation between electrocatalytic activities and surface oxidized metal species. The Pd–Fe/C (Pd/Fe = 1/15) treated sample showed a significant activity increase for FA oxidation compared with Pd/C nanocatalysts. The enhanced FA oxidation activities of Pd–Fe/C(Pd/Fe = 1/15) treated sample can be attributed to the synergistic effect in terms of both the Pd(0) surface active sites and removal of intermediate COads species by Pd oxidized species. This study will provide an effective route for designing excellent Pd based catalysts for FA oxidation.Conflicts of interest
There are no conflicts to declare.Acknowledgements
The authors would like to thank the Natural Science Foundation of China (Grant NSFC 21663013 and 41807365) and the Jiangxi Provincial Key Technology R&D Program (20161BBE50096) for financial supports. Part of work was supported by the Open Project Program of Jiangxi Engineering Research Center of Process and Equipment for New Energy, East China Institute of Technology.Notes and references
- E. Antolini, Energy Environ. Sci., 2009, 2, 915–931 RSC.
- Y. Zhou, C. Du, G. Han, Y. Gao and G. Yin, Electrochim. Acta, 2016, 217, 203–209 CrossRef CAS.
- G. Zhang, Y. Wang, X. Wang, Y. Chen, Y. Zhou, Y. Tang, L. Lu, J. Bao and T. Lu, Applied Catalysis B: Environmental, 2011, 102, 614–619 CrossRef CAS.
- L. Shen, H. Li, L. Lu, Y. Luo, Y. Tang, Y. Chen and T. Lu, Electrochim. Acta, 2013, 89, 497–502 CrossRef CAS.
- X. Wang and Y. Xia, Electrochem. Commun., 2008, 10, 1644–1646 CrossRef CAS.
- S. Hu, L. Scudiero and H. Su, Electrochim. Acta, 2012, 83, 354–358 CrossRef CAS.
- M. Ren, J. Chen, Y. Li, H. Zhang, Z. Zou, X. Li and H. Yang, J. Power Sources, 2014, 246, 32–38 CrossRef CAS.
- C. Mira, J. J. Calvino, J. A. Pérez-Omil, J. M. Rodríguez-Izquierdo and S. Bernal, Catal. Today, 2012, 180, 174–183 CrossRef CAS.
- z. A. A. Ensafi, M. Jafari-Asl and B. Rezaei, J. Electroanal. Chem., 2014, 731, 20–27 CrossRef.
- J. Chen, Y. Li, Z. Gao, G. Wang, J. Tian, C. Jiang, S. Zhu and R. Wang, Electrochem. Commun., 2013, 37, 24–27 CrossRef CAS.
- Z. Li, M. Li, M. Han, X. Wu, Y. Guo, J. Zeng, Y. Li and S. Liao, J. Power Sources, 2015, 278, 332–339 CrossRef CAS.
- Y. N. Wu, S. J. Liao, Y. L. Su, J. H. Zeng and D. Dang, J. Power Sources, 2010, 195, 6459–6462 CrossRef CAS.
- Y. C. Wei, C. W. Liu, H. W. Lee, S. R. Chung, S. L. Lee, T. S. Chan, J. F. Lee and K. W. Wang, Int. J. Hydrogen Energy, 2011, 36, 3789–3802 CrossRef CAS.
- R. Rahul, R. K. Singh and M. Neergat, J. Electroanal. Chem., 2014, 712, 223–229 CrossRef CAS.
- L. Zhu, J. Zheng, C. Yu, N. Zhang, Q. Shu, H. Zhou, Y. Li and B. H. Chen, RSC Adv., 2016, 6, 13110–13119 RSC.
- L. Zhu, S. Shan, V. Petkov, W. Hu, A. Kroner, J. Zheng, C. Yu, N. Zhang, Y. Li and R. Luque, J. Mater. Chem. A, 2017, 5(17), 7869–7875 RSC.
- L. Zhu, H. Zhang, W. Hu, J. Zheng, N. Zhang, C. Yu, H. Ye, Z. Yang and D. B. H. Chen, ChemCatChem, 2018, 10(9), 1998–2002 CrossRef CAS.
- L. Zhu, Z. Yang, J. Zheng, W. Hu, N. Zhang, Y. Li, C. J. Zhong, H. Ye and B. Chen, J. Mater. Chem. A, 2015, 3, 11716–11719 RSC.
- H. A. Gasteiger, N. Markovic, P. N. R. Jr and E. J. Cairns, J. Phys. Chem., 1993, 97(46), 326–332 CrossRef.
- S. Chen, W. Sheng, N. Yabuuchi, P. J. Ferreira, L. F. Allard and S. H. Yang, J. Phys. Chem. C, 2009, 113 Search PubMed.
- H. A. Gasteiger, N. Markovic, P. N. J. Ross and E. J. Cairns, J. Phys. Chem., 1994, 98, 617–625 CrossRef CAS.
- J. K. Nørskov, T. Bligaard, J. Rossmeisl and C. H. Christensen, Nat. Chem., 2009, 1, 37–46 CrossRef PubMed.
- W. Yu, M. D. Porosoff and J. G. Chen, Chem. Rev., 2012, 112, 5780–5817 CrossRef CAS PubMed.
- V. R. Stamenkovic, B. S. Mun, M. Arenz, K. J. Mayrhofer, C. A. Lucas, G. Wang, P. N. Ross and N. M. Markovic, Nat. Mater., 2007, 6, 241 CrossRef CAS PubMed.
- B. N. Wanjala, R. Loukrakpam, J. Luo, P. N. Njoki, D. Mott, C. J. Zhong, M. Shao, L. Protsailo and T. Kawamura, J. Phys. Chem. C, 2010, 114, 17580–17590 CrossRef CAS.
- M. Liao, Q. Hu, J. Zheng, Y. Li, H. Zhou, C. J. Zhong and B. H. Chen, Electrochim. Acta, 2013, 111, 504–509 CrossRef CAS.
- M. Liao, J. Xiong, M. Fan, J. Shi, C. Luo, C. J. Zhong and B. H. Chen, J. Power Sources, 2015, 294, 201–207 CrossRef CAS.
- T. Maiyalagan, A. B. A. Nassr, T. O. Alaje, M. Bron and K. Scott, J. Power Sources, 2012, 211, 147–153 CrossRef CAS.
- W. Zhou and J. Y. Lee, J. Phys. Chem. C, 2008, 112, 3789–3793 CrossRef CAS.
- Q. Wu, Z. Rao, L. Yuan, L. Jiang, G. Sun, J. Ruan, Z. Zhou and S. Sang, Electrochim. Acta, 2014, 150, 157–166 CrossRef CAS.
- X. Teng, D. Black, N. J. Watkins, Y. Gao and H. Yang, Nano Lett., 2003, 3, 261–264 CrossRef CAS.
- W. Li and P. Haldar, Electrochem. Commun., 2009, 11, 1195–1198 CrossRef CAS.
- Z. Zhang, K. L. More, K. Sun, Z. Wu and W. Li, Chem. Mater., 2011, 23, 1570–1571 CrossRef CAS.
- J. Moulder, W. Stickle, P. Sobol and K. Bomben, Handbook of X-ray photoelectron spectroscopy, physical electronics, Eden Prairie MN: Inc, 1995, p. 119 Search PubMed.
- B. Han and C. Xu, Int. J. Hydrogen Energy, 2014, 39, 18247–18255 CrossRef CAS.
- H. H. Brongersma, M. Draxler, M. D. Ridder and P. Bauer, Surf. Sci. Rep., 2007, 62, 63–109 CrossRef CAS.
- M. Arenz, V. Stamenkovic, T. J. Schmidt, K. Wandelt, P. N. Ross and N. M. Markovic, Phys. Chem. Chem. Phys., 2003, 5, 4242–4251 RSC.
- N. Hoshi, K. Kida, M. Nakamura, M. Nakada and K. Osada, J. Phys. Chem. B, 2006, 110, 12480–12484 CrossRef CAS PubMed.
- H. Miyake, T. Okada, G. Samjeské and M. Osawa, Phys. Chem. Chem. Phys., 2008, 10, 3662–3669 RSC.
- S. L. Gojković, T. R. Vidaković and D. R. Đurović, Electrochim. Acta, 2003, 48, 3607–3614 CrossRef.
- Y. Yu and X. Wang, Catal. Lett., 2011, 141, 1872–1882 CrossRef CAS.
- E. Jeroro and J. M. Vohs, Catal. Lett., 2009, 130, 271–277 CrossRef CAS.
- Y. Wang, Y. Qi, D. Zhang and C. Liu, J. Phys. Chem. C, 2014, 118, 2067–2076 CrossRef CAS.
| This journal is © The Royal Society of Chemistry 2018 |

