
 Open Access Article
 This Open Access Article is licensed under a Creative Commons Attribution-Non Commercial 3.0 Unported Licence
Construction of myoglobin–amphiphilic alginate caprylamide–graphene composite modified electrode for the direct electron transfer between redox proteins and electrode and electrocatalysis of myoglobin†
Xiuqiong Chenab,
Huiqiong Yan*ab,
Wei Sunb,
Guangying Chena,
Changjiang Yub,
Wen Fengb and
Qiang Lin *ab
*ab
aKey Laboratory of Tropical Medicinal Plant Chemistry of Ministry of Education, College of Chemistry and Chemical Engineering, Hainan Normal University, Haikou 571158, China. E-mail: yanhqedu@163.com; linqianggroup@163.com; Tel: +86 0898 65884995 Tel: +86 0898 65889422
bKey Laboratory of Water Pollution Treatment & Resource Reuse of Hainan Province, College of Chemistry and Chemical Engineering, Hainan Normal University, Haikou 571158, Hainan, China
First published on 13th November 2018
Abstract
To achieve the dispersion of the hydrophobic graphene (GR), the amphiphilic alginate caprylamide (ACA) was synthesized to fabricate electroactive Nafion/Mb–ACA–GR/CILE for the accurate determination of trichloroacetic acid (TCA). SEM observation, FT-IR and UV-Vis spectroscopic analysis indicated that ACA could tightly immobilize Mb and GR on the electrode surface by constructing biointerfaces, which not only provided Mb a suitable microenvironment to maintain its biological activity, but also shortened the distances between the active centers of Mb with carbon ionic liquid electrode (CILE), thus promoting the electron transfer rate. The electrochemical characterization of Nafion/Mb–ACA–GR/CILE showed that the direct electron transfer of Mb was realized on the modified electrode, which was attributed to the high electrical conductivity and excellent electrocatalytic activity of GR and good biocompatibility of ACA. Moreover, Nafion/Mb–ACA–GR/CILE exhibited good electrocatalytic activity towards TCA with the linear range from 2.5 to 47.3 mmol L−1 and lower KMapp value of 8.3 mmol L−1. Moreover, the modified electrode also revealed good stability, reproducibility and accurate detection of tap-water, exhibiting great potential for the applications as the third-generation electrochemical biosensors.
1 Introduction
Trichloroacetic acid (TCA), a type of organohalide pollutant, has become one of the major environmental issues for its extensive application in industry, agriculture and public healthcare.1 Since it also appears in drinking water as a result of chlorine disinfection and has high solubility in water, TCA has been considered to be harmful to aquatic life and humans.2 Therefore, accurate determination and regular monitoring of TCA concentration has received considerable attention in recent years. Among the various methods for the detection of TCA, electrochemical biosensing based on the direct electrochemistry between an electrode and the immobilized redox protein is particularly promising owing to its high selectivity, high sensitivity and relatively low cost.3–5Myoglobin (Mb) is one of the ideal redox proteins because of its known structure, commercial availability, and relatively low molecular weight, and its direct electron transfer is attributed to the bioactive heme Fe(III)/Fe(II) redox couple.6 However, the direct electron transfer between the redox protein and the surface of bare electrodes is often difficult to achieve, which is attributed to the deeply embedded redox active center in the structure of proteins, the unfavorable orientation of protein molecules and the irreversible adsorption of denatured proteins on the electrode surface.7–9 For these reasons, many materials such as polymers, metal oxide nanoparticles, and graphene10–12 have been applied to modify the substrate electrode. This could help to direct the proteins in favorable orientation towards the electrode thus decreasing the distances between the active centers of redox proteins and the substrate electrode as well as accelerating the electron transfer rate.13 Among the abovementioned materials, graphene is one of the most perspective functional materials for the fabrication of electrochemical biosensors because of its high surface area, good mechanical strength, high electrical conductivity and excellent electrocatalytic activity.14,15 Graphene (GR) is a sheet of two-dimensional (2D) single layer sp2 hybridized carbon atoms packed into a dense honeycomb-like crystal structure.16,17 It has attracted a tremendous amount of interest for the application in the electrochemistry and electrochemical sensing fields due to its extraordinary physicochemical and structural properties since its discovery in 2004.18 Gan and Hu had reviewed the potential applications for electrochemistry and electroanalysis of GR.19 Wu et al.20 used chitosan-dispersed GR to immobilize cytochrome C for the electrocatalytic determination of nitric oxide. Sun et al.16 adopted graphene and titanium dioxide nanocomposite-modified carbon ionic liquid electrode for the electrocatalytic determination of TCA. Zhan et al.8 employed Co2Al layered double hydroxide–GR nanocomposite and chitosan to immobilize hemoglobin on the CILE for the electrocatalytic determination of TCA. In addition, the electrochemical behavior of GR modified electrode towards other important electroactive substances had been also reported.21
Since the single GR sheets are prone to irreversible aggregation due to the van der Waals forces and π–π restacking in aqueous medium, the dispersion of graphene is poor, which is disadvantageous for the construction of various potentially useful graphene-based biosensors.22,23 In practical electrochemical applications, the common method to improve the dispersion of GR is chemical functionalization. However, the functionalization process would certainly destroy the extraordinary structure of GR, which may result in the significant reduction of the electrical conductivity and other properties.24 Therefore, other methods without involving functionalization of GR should be proposed to improve the dispersion of GR for the construction of electrochemical biosensors.
It has been reported that aqueous surfactants can facilitate direct electron transfer between the substrate electrode and the redox protein of myoglobin.25,26 The interactions between the surfactant and the protein promote the formation of dynamic complexes that could inhibit irreversible adsorption of the protein on the electrode surface and assist in favorably orienting the protein to the hydrophobic electrode surface. This has been regarded as the main reason for difficulty in achieving direct electron transfer between redox proteins and electrode.7,27 In addition, alginate, as an anionic natural polymer, possesses unique biocompatible property that could provide a desirable microenvironment for the immobilization of the protein while retaining its structure and activity, thus leading to the wide application in the construction of electrochemical biosensors with enhanced analytical performance.28,29 As a result of available hydroxyl and carboxyl groups on the backbone of alginate, chemical modification could be achieved with the aid of 1-ethyl-3-(3-dimethyl-aminopropyl)carbodiimide hydrochloride (EDC·HCl).30 Moreover, modification of alginate by introducing hydrophobic groups onto its hydrophilic backbone could make it amphiphilic, similar to the surfactant, which could enhance its affinity for the hydrophobic GR.31 Hence, we could utilize amphiphilic alginate derivative to disperse GR, which could not only promote efficient electron transfer between the electrode and the protein, but also retain the protein bioactivity and the GR physicochemical property.
In this study, the amphiphilic alginate caprylamide (ACA) was prepared by amide linkage attachment of octylamine onto the carboxylate group of alginate. Then, the mixture of Mb, ACA and GR was cast on the surface of carbon ionic liquid electrode (CILE) to fabricate the novel modified electrode, abbreviated as Nafion/Mb–ACA–GR/CILE, whose preparation procedure is illustrated in Scheme 1. The secondary structure of Mb in the ACA–GR film was characterized by UV-Vis and FTIR spectroscopy. In addition, the morphology and the electrochemical performance of Nafion/Mb–ACA–GR/CILE were investigated by scanning electron microscopy (SEM) and cyclic voltammetry, respectively. The main objective of this study was to fabricate the biointerfaces by amphiphilic ACA to promote the electron transfer rate between the redox protein and the underlying electrode for the new biosensor material, which is capable of achieving the desired properties. To the best of our knowledge, the attempt to use biocompatible and amphiphilic alginate derivatives to disperse GR and immobilize the redox protein for the construction of electrochemical biosensors has been rarely reported.
 | ||
| Scheme 1 Schematic of the fabrication of Nafion/Mb–ACA–GR/CILE. | ||
2 Experimental
2.1 Reagent and materials
Graphene (GR, >98.3%) was purchased from Sinocarbon Technology Co. Ltd., China. Myoglobin (Mb, MW = 17.8 kDa) and Nafion (5% ethanol solution) were purchased from Sigma, USA. Ionic liquid N-hexylpyridinium hexafluorophosphate (HPPF6) was purchased from Lanzhou Greenchem (ILS, LICP, CAS, China). Graphite powder (particle size 30 mm) was purchased from Shanghai Colloid Chem. Co., China. Liquid paraffin and KCl were purchased from Aladdin Chemical Reagent Co., Ltd., Shanghai, China. Trichloroacetic acid (TCA) was purchased from Tianjin Kemiou Chemical Ltd. Co., China. The chemicals were of analytical grade and used without further purification. 0.1 mol L−1 pH 7.0 phosphate buffer solution (PBS) were used as the supporting electrolyte.In addition, the alginate caprylamide (ACA) was prepared based on our previous study,32 which was synthesized by the amidation reaction through alginate coupling with octylamine in the presence of EDC·HCl. The structure of the as-synthesized ACA was confirmed by FT-IR and 1H NMR, which are shown in the ESI in Fig. 1S and 2S,† respectively. FTIR (KBr pellet method): 3445 cm−1, hydroxyl O–H stretching; 2854 cm−1, aliphatic C–H stretching, 1380 cm−1, aliphatic –CH2– bending. 1H NMR (400 MHz, D2O) δ 5.0–3.5 (m, alginate backbone), 3.0 (t, –CH2–NH– of octyl), 1.4–0.8 (t, –(CH2)6– of octyl), 0.6 (s, –CH3 of octyl). Elemental composition of ACA determined by elemental analysis: C, 32.47; N, 1.26; H, 5.32; S, 0.38. According to the data collected by elemental analysis, the substitution degree of ACA was calculated as 0.25.
2.2 Apparatus
A CHI 750B electrochemical workstation with the conventional three-electrode system composed of the modified electrode as working electrode, the platinum wire electrode as auxiliary electrode and the saturated calomel electrode (SCE) as reference electrode were used for cyclic voltammetry measurements at ambient temperature. The colloidal interface activity of ACA was evaluated by fluorescence spectroscopy and dynamic light scattering (DLS). Fluorescence measurement was performed on a Hitachi F7000 fluorescence spectrophotometer using pyrene as a fluorescence probe, which was an efficient way to detect self-aggregation property of the formation of micelles by intra- or intermolecular associations of amphiphilic polymers.31 The size and zeta potential of the polymeric micelles were determined by dynamic light scattering using a Malvern Nano-ZS90 Zetasizer (UK) at a scattering angle of 90° at 25 °C by employing an (He-Ne) argon laser (λ = 633 nm). The morphology of the composite materials on the electrode surface and the secondary structure of Mb in the composite matrix were characterized by SEM, FTIR and UV-Vis spectroscopy. The morphology observation was conducted on a JSM-7100F scanning electron microscope (Electron, Japan). FT-IR and UV-Vis measurements were respectively performed on a Tensor 27 Fourier transform infrared spectrometer (Bruker, Germany) and a Cary 50 probe spectrophotometer (Varian, Australia).2.3 Fabrication of the modified electrode
A carbon ionic liquid electrode (CILE) was prepared using the HPPF6 as the binder and the modifier. In short, 3.2 g of graphite powder, 1.6 g of HPPF6 and 1.0 mL of liquid paraffin were mixed thoroughly in a mortar to form a homogeneous carbon paste. Then, a certain amount of this carbon paste was filled into one end of a glass tube, and a copper wire was inserted through the opposite end to establish an electrical contact, thus constructing the CILE.Subsequently, the CILE was polished to obtain a mirror-like surface with a piece of weighing paper. Then, 8.0 μL of homogeneously mixed suspension solution composed of 6 mg mL−1 Mb, 1.0 mg mL−1 GR and 1.6 mg mL−1 ACA was cast on the surface of CILE directly and left to dry at 4 °C overnight. After the surface of CILE was dry, 5.0 μL of 0.5% Nafion solution was spread evenly onto the surface of the modified electrode to further consolidate the composite film. Nafion with excellent film-forming ability could improve the stability of protein immobilized on the electrode surface and prevent its leakage from electrode into the solution. This resultant electrode was abbreviated as Nafion/Mb–ACA–GR/CILE. For comparison, the modified electrodes, namely, Nafion/ACA–GR/CILE, Nafion/Mb–ACA/CILE and Nafion/Mb–GR/CILE were prepared by the similar procedure.
3 Results and discussion
3.1 Colloidal interface activity of ACA
Since pyrene is very sensitive to the environment and can be encapsulated in the hydrophobic microdomains formed by alkyl chains, the amphiphilic property of ACA could be assessed through fluorescence measurements using pyrene as the fluorescent probe.33 There are five electronic vibration peaks observed in the pyrene fluorescence spectrum of ACA. The ratio value of the first peak at 372 nm (I1) to the third peak at 383 nm (I3) is related to the micro-environmental polarity surrounding pyrene molecules,34 which decreases with the reduction of the micro-environmental polarity. When the hydrophobic octyl groups drive ACA to form self-aggregated micelles, the ratio value of I1/I3 significantly decreases. The corresponding onset concentration was the critical aggregation concentration (CAC) of ACA (Fig. 1A), which was the lowest concentration of self-aggregate formation by intramolecular or intermolecular association.35 As ACA was grafted with a certain amount of hydrophobic octylamine (degree of substitution of 0.25), its molecular self-aggregation ability in aqueous solution was much larger than that of alginate. As shown in Fig. 1A, ACA revealed good amphipathy with a low CAC value of 0.51 g L−1, whereas that of sodium alginate was 2.13 g L−1. These results indicated that the amidation reaction by octylamine could endow alginate with good amphiphilic functionality.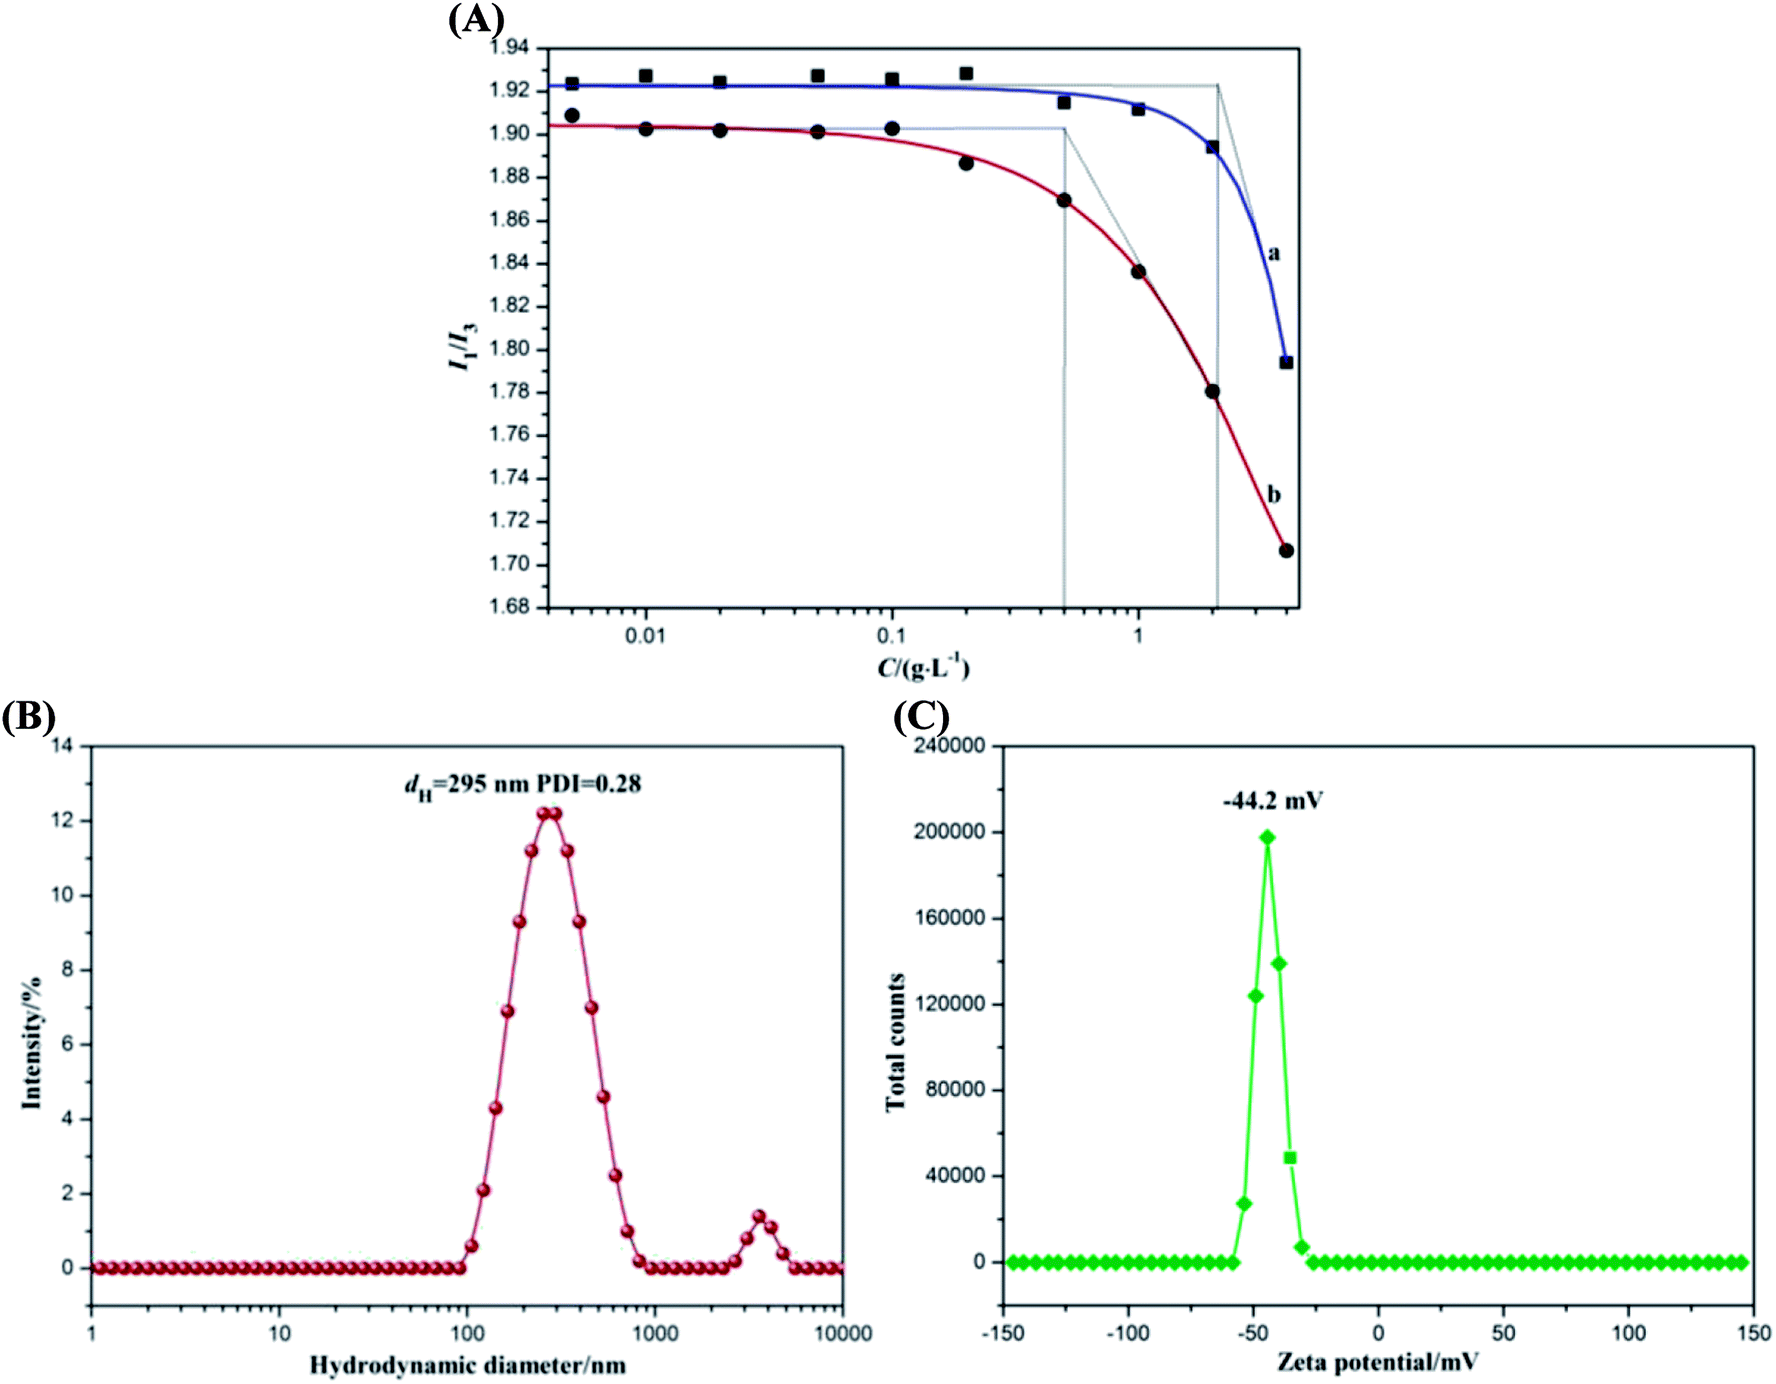 | ||
| Fig. 1 (A) Plots of pyrene fluorescence intensity I1/I3 vs. the concentration of (a) sodium alginate and (b) ACA solutions. (B) Hydrodynamic diameter distribution and (C) zeta potential distribution of ACA self-aggregated micelle. | ||
The colloidal property of ACA was investigated by dynamic light scattering using Malvern Nano-ZS90 Zetasizer. The hydrodynamic diameter distribution and zeta potential distribution of ACA self-aggregated micelles are presented in Fig. 1B and C. In Fig. 1B, the ACA self-aggregated micelles exhibited a narrow size distribution involving two ranges, and their average hydrodynamic diameter (dH) was 295 nm with the PDI of 0.28. These results indicated that the molecular flexibility of ACA was enhanced by hydrophobic association.36 In addition, the ACA micelles showed a relatively high negative zeta potential at about −44.2 mV as a result of the presence of the residual free-curling carboxyl groups, as shown in Fig. 1C. ACA micelles are generally considered to be stable in aqueous solution when the absolute value of zeta potential is higher than 30 mV, as the strong repulsion forces prevent the aggregation among the micelles.37 The abovementioned results were ascribed to the partial grafting of hydrophobic octyl groups onto the main chains of the alginate molecule, which could destroy the original intramolecular hydrogen bonding to enhance its molecular flexibility. Therefore, ACA displayed good colloidal interface activity, which was beneficial for the dispersion of GR sheets via hydrophobic associations, thus facilitating direct electron transfer between the substrate electrode and the redox protein of myoglobin.
3.2 Morphology and spectroscopic analysis of the composite materials on the electrode surface
The morphology of the composite materials on the electrode surface was examined by SEM, with the results shown in Fig. 2. It can be observed that the single GR revealed representative sheet-like shape with slightly scrolled edges.16 Due to the hydrophobic property of GR, most GR nanosheets gathered together to form a loose and laminar cluster structure, as shown in Fig. 2a. This fluffy structure was ineffective for electron transfer and easily resulted in the disengagement of GR from the electrode surface. In spite of the partial grafting of hydrophobic octyl groups, the ACA could still generate a good film on the electrode surface (Fig. 2b). Owing to the hydrophobic association and film-forming property of ACA, GR could be well dispersed and tightly adhered on the electrode surface, as shown in Fig. 2c. Additionally, the Mb–ACA–GR composite mainly exhibited the morphology of ACA with the increase in surface roughness (Fig. 2d), indicating that the GR and Mb were successfully immobilized on the electrode surface. It was the biointerfaces constructed by ACA that shortened the distances between the active centers of Mb with the substrate electrode and protected Mb from denaturation, thus facilitating electron transfer rate and stability of Nafion/Mb–ACA–GR/CILE.38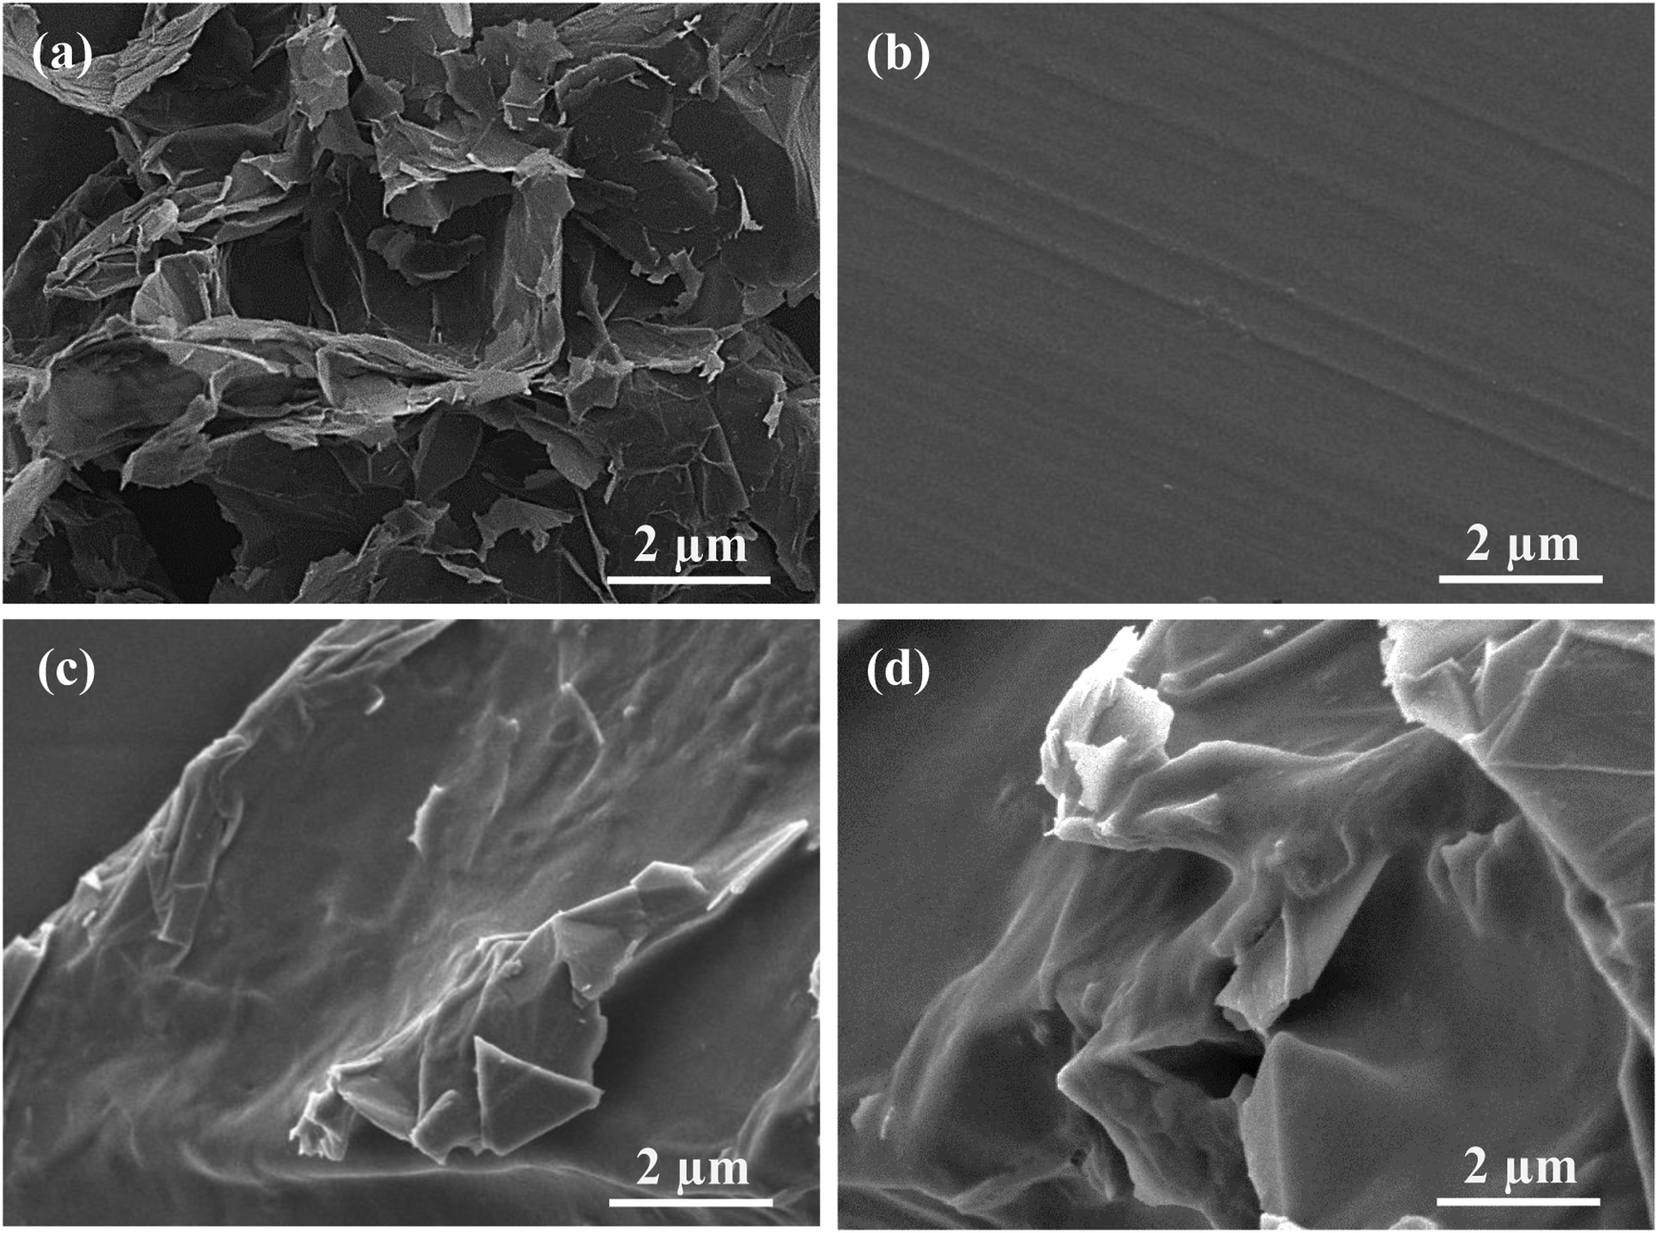 | ||
| Fig. 2 SEM images of (a) GR, (b) ACA, (c) ACA–GR and (d) Mb–ACA–GR composite. | ||
The biological activity of Mb in the Mb–ACA–GR composite was evaluated by detecting the secondary structure of redox proteins by conducting FT-IR and UV-Vis spectroscopy. FT-IR spectra of Mb and Mb–ACA–GR composite are presented in Fig. 3A. It is clearly observed that Mb displays characteristic peaks at 1654.89 and 1541.91 cm−1, which are respectively ascribed to the amide I and II infrared absorbance. After Mb, ACA and GR were mixed together; as a result, the amide I and II peaks of Mb appeared at 1651.50 and 1538.10 cm−1. In contrast, the Mb–ACA–GR composite exhibited relatively weak characteristic peaks of Mb because of the hydrogen bonding or shielding effect stemmed from the ACA–GR composite. However, their positions and shapes were similar to that of Mb. As the shapes and positions of the amide I and II infrared absorbance peaks of Mb can provide detailed information on the secondary structure of the polypeptide chain,6 the above results indicated that Mb could retain its native structure in Mb–ACA–GR composite during the fabrication of the modified electrode.
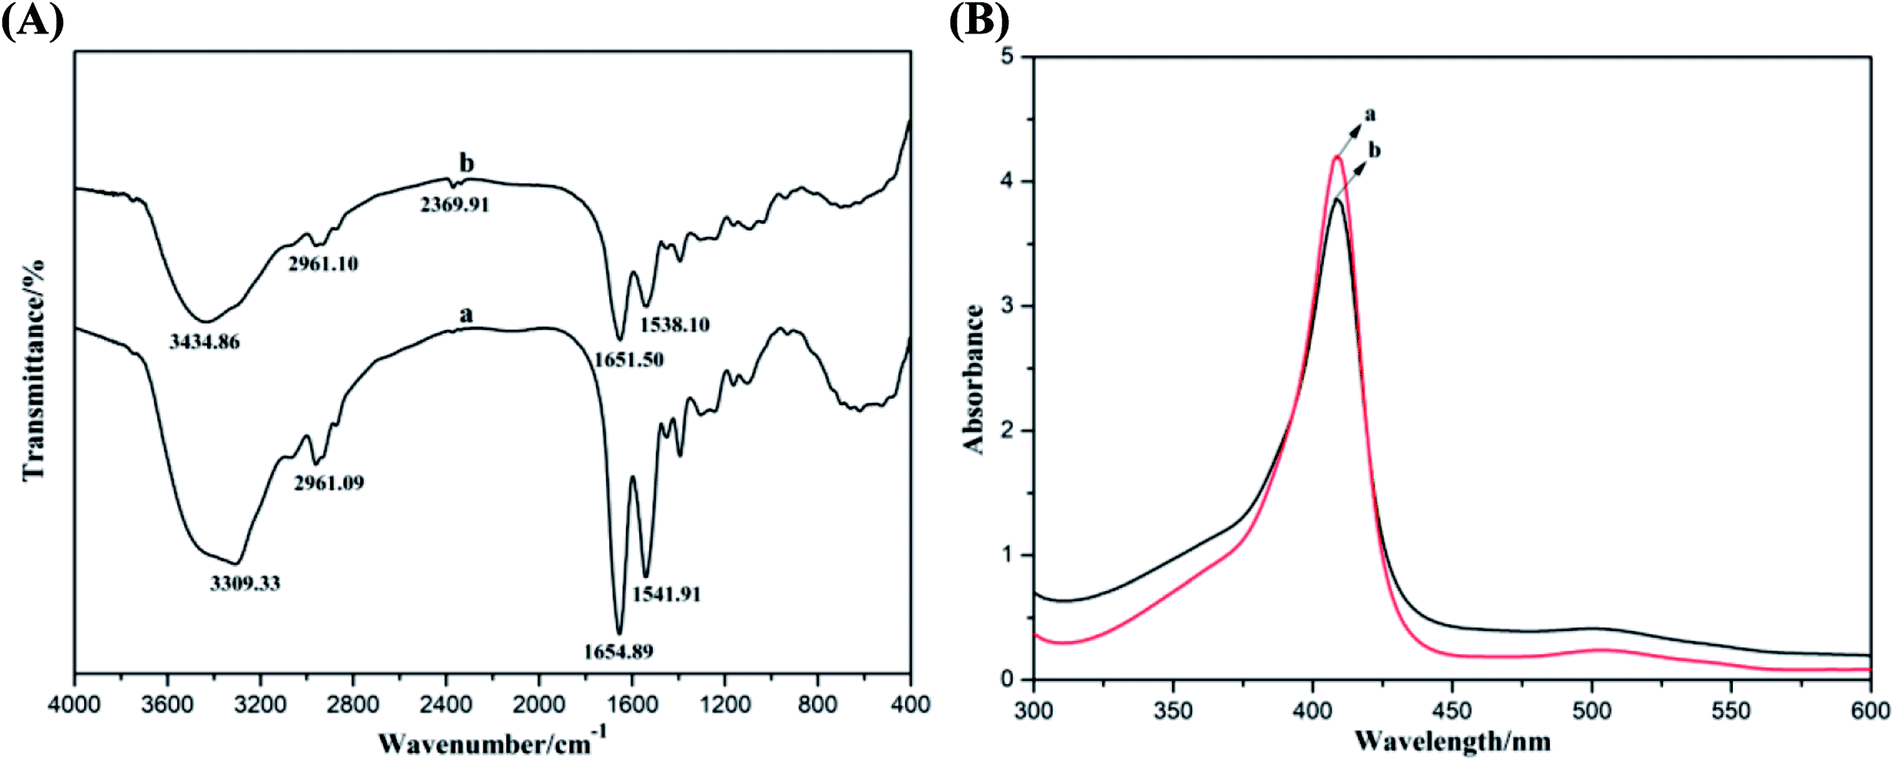 | ||
| Fig. 3 (A) FT-IR spectra and (B) UV-Vis absorption spectra (in PBS) of (a) Mb and (b) Mb–ACA–GR composite. | ||
The probable denaturation or the conformational variations of Mb could be also examined via the UV-Vis adsorption spectroscopy by testing the change in the shape and position of the Soret absorption peaks attributed to the four iron heme groups of Mb.39 Fig. 3B shows the UV-Vis absorption spectra of Mb and Mb–ACA–GR mixture in pH 7.0 PBS. It can be seen that Mb and the mixture solution of Mb–ACA–GR reveal very similar Soret peaks at the same position (408 nm). This result indicated that Mb molecules retained its native structure in the mixture of Mb–ACA–GR, and ACA revealed good biocompatibility towards maintaining the biological activity of Mb.
3.3 Direct electrochemistry of the modified electrode
The effects of Mb, ACA and GR on the electrochemical properties of the modified electrode were investigated by cyclic voltammetry. Direct electrochemical tests of the modified electrode were performed in a 10 mL electrochemical cell containing 0.1 mol L−1 pH 7.0 PBS. Before the measurements, PBS was deaerated with highly purified N2 for 30 min and then, nitrogen atmosphere was maintained over the cell during the experiments. Cyclic voltammograms of the different modified electrodes in deaerated pH 7.0 PBS at a scan rate of 100 mV s−1 are presented in Fig. 4A. It can be seen that there are no distinct redox peaks in the cyclic voltammogram of Nafion/ACA–GR/CILE due to the absence of electroactive substances of Mb, elucidating that the direct electron transfer was performed between redox proteins and the electrode surface. Attributed to the redox reaction of immobilized Mb, Nafion/Mb–GR/CILE, Nafion/Mb–ACA/CILE and Nafion/Mb–ACA–GR/CILE exhibited a pair of symmetric redox peaks. GR with high electrical conductivity and excellent electrocatalytic activity can be used as a good electronic mediator of Mb, and is conducive towards enhancing the electron transfer rate. However, Nafion/Mb–GR/CILE exhibited lower electrochemical response in comparison with that of Nafion/Mb–ACA/CILE and Nafion/Mb–ACA–GR/CILE owing to the fluffy structure of GR. As a result of good biocompatibility of ACA that could provide Mb suitable microenvironment to maintain its biological activity, Nafion/Mb–ACA/CILE displayed higher redox peak currents than Nafion/Mb–GR/CILE, indicating that ACA had more influence on the electron transfer of Mb than GR.40 Moreover, the synergistic effects of ACA and GR made Nafion/Mb–ACA–GR/CILE present the biggest redox peak currents among the modified electrodes. This result could be explained by the fact that ACA with good colloidal interface activity could not only disperse GR sheets via hydrophobic associations, but also tightly immobilize Mb and GR on the electrode surface. Therefore, the biointerfaces constructed by ACA during the fabrication of Nafion/Mb–ACA–GR/CILE could protect Mb from denaturation and shorten the distances between the active centers of Mb with CILE, thus accelerating the electron transfer rate.38 As shown in the cyclic voltammogram of Nafion/Mb–ACA–GR/CILE, the cathodic peak potential (Epc) and the anodic peak potential (Epa) respectively appeared at −0.295 V and −0.208 V. Its formal peak potential (E0′) was calculated as −0.252 V (vs. SCE), a typical value of the active center of Mb Fe(III)/Fe(II) redox couple,6 implying that most of the Mb retained its original structure after being incorporated in ACA–GR matrix. Therefore, the direct electron transfer of Mb was attributed to the heme Fe(III)/Fe(II) redox couple in the Mb molecules, which could be realized on the Nafion/Mb–ACA–GR/CILE with fast electron transfer rate. | ||
Fig. 4 (A) Cyclic voltammograms of (a) Nafion/ACA–GR/CILE, (b) Nafion/Mb–GR/CILE and (c) Nafion/Mb–ACA/CILE and (d) Nafion/Mb–ACA–GR/CILE in pH 7.0 PBS with the scan rate as 100 mV s−1. (B) Cyclic voltammograms of Nafion/Mb–ACA–GR/CILE in pH 7.0 PBS at different scan rates (from a to r: 150, 200, 250, 300, 350, 400, 450, 500, 550, 600, 650, 700, 750, 800, 850, 900, 950, 1000 mV s−1, respectively). (C) Linear relationship of the cathodic and anodic peak current (Ip) versus scan rate (v). (D) Linear relationship of the anodic and cathodic peak potential (Ep) versus ln![[thin space (1/6-em)]](https://www.rsc.org/images/entities/char_2009.gif) v. v. | ||
The effects of scan rate on the cyclic voltammograms of Nafion/Mb–ACA–GR/CILE are shown in Fig. 4B. With the increase in scan rate from 150 to 1000 mV s−1, a pair of symmetric redox peaks with nearly equal redox peak currents appeared because of the reduction and reoxidation of electroactive Mb Fe(III)/Fe(II) redox couple upon cyclic scanning, and the redox peak current increased linearly with scan rate, as shown in Fig. 4C. The linear regression equations were calculated as Ipc (μA) = 148.784v (V s−1) + 8.539 (n = 21, γ = 0.998) and Ipa (μA) = −104.508v (V s−1) − 3.829 (n = 21, γ = 0.997). These results indicated that the electron transfer of Nafion/Mb–ACA–GR/CILE was a surface-controlled thin-layer electrochemical reaction.16 The surface concentration (Γ*) of electroactive Mb on the surface of Nafion/Mb–ACA–GR/CILE could be calculated using Faraday's law (Γ* = Q/nAF), where Q is the integration charge of the reduction peak, n is the number of electron transferred, A is the surface area of the electrode, and F is the Faraday constant.41 The charge value (Q) was nearly constant at different scan rates and the average value of Γ* was obtained as 1.79 × 10⁻⁹ mol cm−2, which was much larger than that of monolayer coverage (2.0 × 10⁻¹¹ mol cm−2).42 These results indicated that the ACA–GR composite film contained multilayers of Mb, which may result from the laminar cluster structure of GR with the increased surface area. Additionally, the redox peak potentials were also shifted with the increase in scan rate (Fig. 4D), and the redox peak potentials exhibited linear relationship with natural logarithm of scan rate (lnv) according to the equations Epc (V) = −0.059lnv (V s−1) − 0.329 (n = 13, γ = 0.987) and Epa (V) = 0.039lnv (V s−1) − 0.294 (n = 13, γ = 0.968). Based on the Laviron's equation,43,44 the electrochemical parameters of the electrode reaction, namely, the values of the number of electrons transferred (n), the electron transfer coefficient (α) and the apparent heterogeneous electron transfer rate constant (ks) were calculated as 1.09, 0.398 and 0.886 s−1, respectively. The high apparent heterogeneous electron transfer rate constant indicated a fast electron transfer rate with high efficiency.
3.4 Electrocatalytic ability to TCA
Since TCA usually exists in drinking water as a result of chlorine disinfection, it has been regarded as a very toxic water pollutant to aquatic life and humans even at very low concentrations. Thus, accurate determination and regular monitoring of TCA concentration has received considerable attention in recent years.1 The electrocatalytic activity of Nafion/Mb–ACA–GR/CILE to TCA was also investigated by cyclic voltammetry. The electrocatalysis of TCA was performed in a 10 mL electrochemical cell containing 0.1 mol L−1 deaerated pH 7.0 PBS with various concentrations of TCA, with the results presented in Fig. 5. It can be observed that the cyclic voltammogram of Nafion/ACA–GR/CILE in the presence of TCA (curve a) did not reveal a direct reduction peak, indicating that the Mb played a major role in the electrocatalysis of TCA. The redox proteins possessing good electrocatalytic activity to TCA made Nafion/Mb–ACA–GR/CILE reveal the reduction peak in PBS in the presence of TCA.41 With the increase in TCA concentration, the reduction peak current gradually improved, while the oxidation peak current disappeared, which is a typical characteristic of the electrocatalytic reaction. The electrocatalytic reaction may involve the reduction of Mb Fe(III) to Mb Fe(II) and oxidation of Mb Fe(II) to Mb Fe(III) in the presence of TCA by the direct electron transfer on the electrode surface,38,41,45 which can be expressed with the following equations (eqn (1) and (2)):| MbFe(III) + e → MbFe(II) | (1) |
| 2MbFe(II) + Cl3CCOOH + H+ → 2MbFe(III) + Cl2CHCOOH + Cl− | (2) |
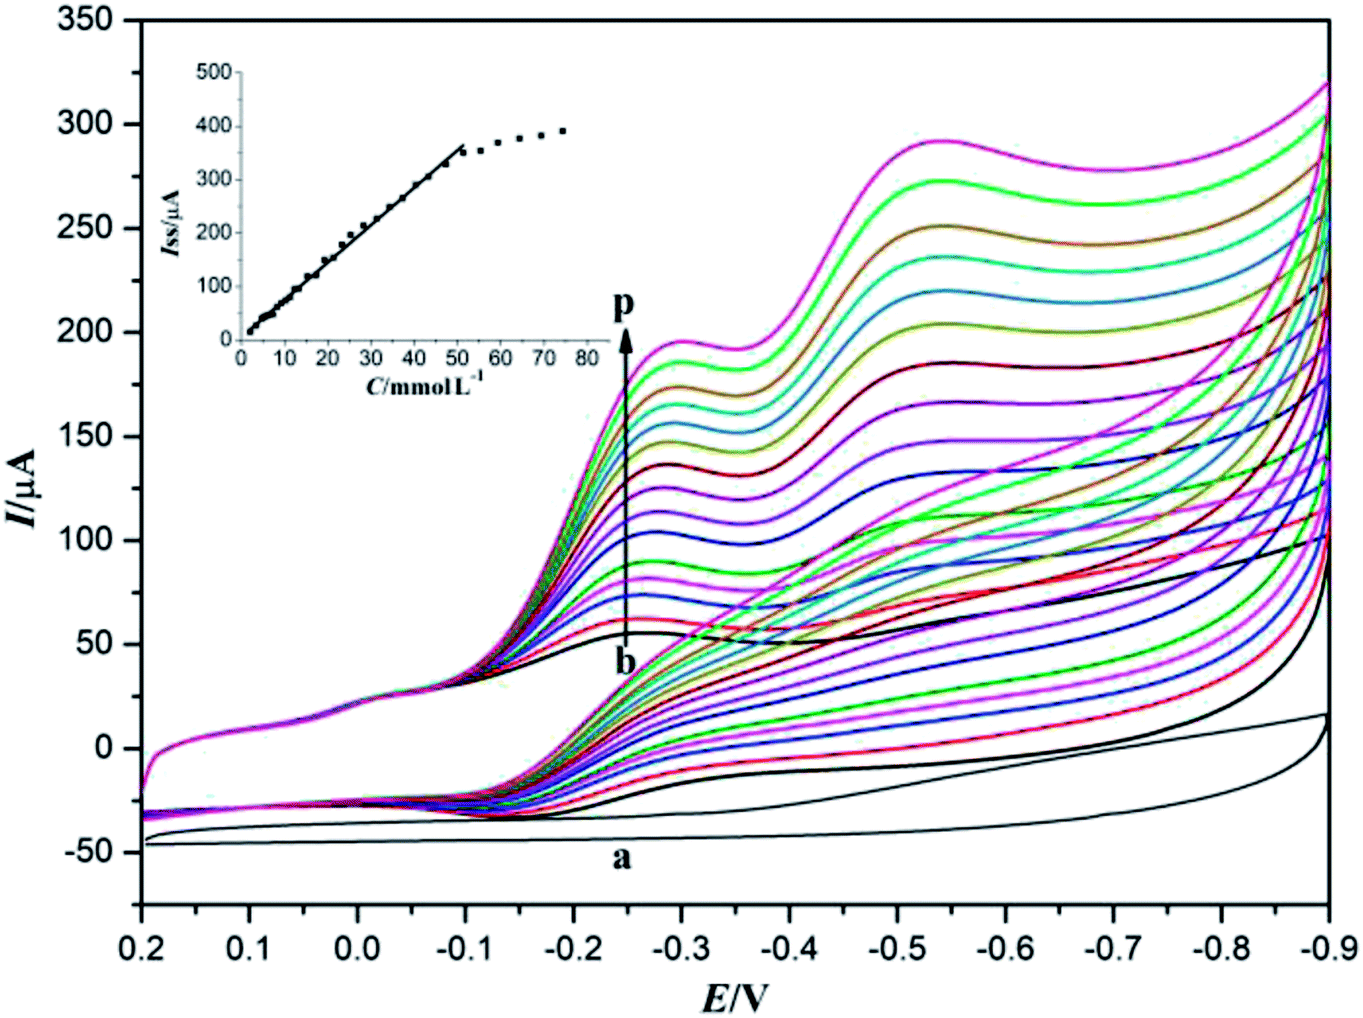 | ||
| Fig. 5 Cyclic voltammograms of Nafion/ACA–GR/CILE in pH 7.0 PBS with 17.3 mmol L−1 TCA (curve a) and Nafion/Mb–ACA–GR/CILE in pH 7.0 PBS containing 2.5, 4.8, 7.3, 9.3, 13.3, 17.3, 21.3, 25.3, 31.3, 37.3, 43.3, 47.3, 59.3, 69.3, 79.3 mmol L−1 TCA (curves b–p), respectively, with the scan rate of 100 mV s−1. Inset: Linear relationship of catalytic reduction peak currents and the TCA concentration. | ||
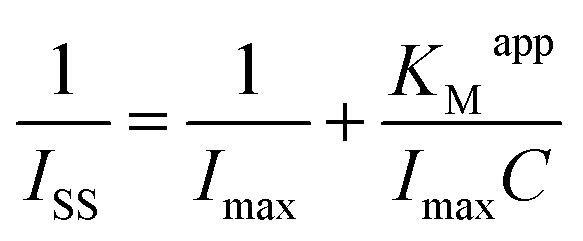
In addition, the catalytic reduction peak currents proportionally increased with the increase in TCA concentration in the range from 2.5 to 47.3 mmol L−1. The linear regression equation was fitted as Iss (μA) = 6.998C (mmol L−1) + 5.371 (n = 12, γ = 0.995) and the detection limit was calculated as 0.114 mmol L−1 (3σ). When the TCA concentration exceeded 47.3 mmol L−1, the catalytic reduction peak currents began to level off and reached a plateau, implying a Michaelis–Menten kinetic process. The apparent Michaelis–Menten constant (KMapp), being indicative of the enzyme–substrate kinetics, could be calculated by the Lineweaver–Burk equation:46
| Modified electrode formulation | ks (s−1) | Linear range (mmol L−1) | Detection limit (mmol L−1) | KMapp (mmol L−1) | References |
|---|---|---|---|---|---|
| Nafion/Mb–Co3O4–Au/IL-CPE | 0.799 | 2.0–20.0 | 0.5 | 4.7 | 6 |
| CS/Mb/3D RGO–Au/CILE | 0.71 | 0.2–36.0 | 0.06 | 9.88 | 38 |
| Nafion/Mb/NiO/GR/CILE | — | 0.002–0.21 | 0.002 | 10.67 | 47 |
| Nafion/Mb–SA–Fe3O4–GR/CILE | 0.234 | 1.4–119.4 | 0.174 | 29.1 | 48 |
| Nafion/Mb–SA–TiO2/CILE | 0.511 | 5.3–114.2 | 0.152 | 32.3 | 49 |
| Nafion–BMIMPF6/Mb/CILE | 0.532 | 1.6–19.6 | 0.2 | 90.8 | 50 |
| Nafion/Mb–ACA–GR/CILE | 0.886 | 2.5–47.3 | 0.114 | 8.3 | This work |
3.5 Real samples determination and interference
The capability of Nafion/Mb–ACA–GR/CILE to determine TCA in real samples was evaluated via a recovery study. The recovery performance of Nafion/Mb–ACA–GR/CILE was studied by spiking TCA at different concentrations (5, 10, 15 and 20 mmol L−1) in tap-water. At the same time, a standard GC-MS method was used for comparison. As shown in Table 2, the recovery of the electrochemical biosensor was in the range from 98.5% to 104% with small RSD value in the range from 1.6% to 3.9%, which was desirably consistent with the GC-MS results. In addition, the effect of some possible interfering substances, which might exist in tap-water, was also evaluated. When the concentrations of Na+, K+ Ca2+, Mg2+, Fe3+, Cl−, NO3−, SO42− and PO43− in the sample were 100 times of TCA, no significant interference was found. Additionally, similar molecules, such as dichloroacetic acid and monochloroacetic acid at 20 times of the TCA concentration did not interfere with the catalytic reduction peak, with the current changes below ±5%. These results indicated that the as-fabricated electrochemical biosensor had excellent accuracy for the detection of tap-water.| Samples | Added (mmol L−1) | Electrochemical biosensor | GC-MS | ||||
|---|---|---|---|---|---|---|---|
| Found (mmol L−1) | Recovery (%) | RSD (%) | Found (mmol L−1) | Recovery (%) | RSD (%) | ||
| 1 | 5 | 5.2 | 104.0 | 3.9 | 5.3 | 106.0 | 5.7 |
| 2 | 10 | 10.1 | 101.0 | 1.6 | 10.3 | 103.0 | 3.1 |
| 3 | 15 | 14.8 | 98.7 | 2.3 | 14.6 | 97.3 | 2.7 |
| 4 | 20 | 19.9 | 99.5 | 1.8 | 19.7 | 98.5 | 2.1 |
3.6 Stability and reproducibility
The stability and reproducibility of Nafion/Mb–ACA–GR/CILE were characterized by measuring the cyclic voltammetric peak currents. The Nafion/Mb–ACA–GR/CILE could stay at nearly constant current values upon the continuous cyclic voltammetric sweep for 120 cycles. When stored at 4 °C for more than 2 weeks, the Nafion/Mb–ACA–GR/CILE retained 97.7% of the initial current response. After 1 month, the peak current response decreased about 8.4%. The good long-term stability can be attributed to the good biocompatibility of ACA and film-forming property of Nafion that retained proteins' bioactivity and prevented their leakage. Additionally, the electrocatalytic ability of Nafion/Mb–ACA–GR/CILE towards TCA by cyclic voltammetry was also tested to investigate its reproducibility. The relative standard deviation (RSD) of 12 successive measurements for current determinations of 20 mmol L−1 TCA was 6.7%, which indicated acceptable reproducibility. On the basis of the abovementioned results, Nafion/Mb–ACA–GR/CILE exhibited good stability and reproducibility.4 Conclusion
In the present study, the biocompatible and amphiphilic ACA was used to disperse GR and immobilize Mb for the fabrication of electroactive Nafion/Mb–ACA–GR/CILE. Due to the good colloidal interface activity, ACA could tightly immobilize Mb and GR on the electrode surface by constructing the biointerfaces, which not only provided Mb a suitable microenvironment to maintain its biological activity, but also shortened the distances between the active centers of Mb with CILE, promoting the electron transfer rate. As a result of the high electrical conductivity and excellent electrocatalytic activity of GR and good biocompatibility of ACA, the as-fabricated Nafion/Mb–ACA–GR/CILE exhibited a pair of symmetric redox peaks, and exhibited good electrocatalytic activity towards TCA with the linear range from 2.5 to 47.3 mmol L−1 and low KMapp value of 8.3 mmol L−1. Furthermore, the modified electrode also presented good stability, reproducibility and accurate detection of tap-water, thus possessing great potential for applications in the electroanalytical field.Conflicts of interest
There are no conflicts to declare.Acknowledgements
We gratefully thank the financial support from the Natural Science Foundation of Hainan Province (218QN233) and the National Natural Science Foundation of China (21566009).Notes and references
- T. Zhan, X. Wang, Y. Zhang, Y. Song, X. Liu, J. Xu and W. Hou, Sens. Actuators, B, 2015, 220, 1232–1240 CrossRef CAS.
- J. Dojlido, E. Zbieć and R. Ŝwietlik, Water Res., 1999, 33, 3111–3118 CrossRef CAS.
- F. Afkhami, F. Soltani-Felehgari, T. Madrakian and H. Ghaedi, Biosens. Bioelectron., 2014, 51, 379–385 CrossRef PubMed.
- J. Xu, C. H. Liu and Z. F. Wu, J. Solid State Electrochem., 2012, 16, 361–366 CrossRef CAS.
- L. Chen, H. Xie and J. Li, J. Solid State Electrochem., 2012, 16, 3323–3329 CrossRef CAS.
- X. F. Wang, Z. You, H. L. Sha, S. X. Gong, Q. J. Niu and W. Sun, Microchim. Acta, 2014, 181, 767–774 CrossRef CAS.
- J. Rajbongshi, D. K. Das and S. Mazumdar, Electrochim. Acta, 2010, 55, 4174–4179 CrossRef CAS.
- T. Zhan, X. Wang, X. Li, Y. Song and W. Hou, Sens. Actuators, B, 2016, 228, 101–108 CrossRef CAS.
- L. Fang, B. Liu, L. Liu, Y. Li, K. Huang and Q. Zhang, Sens. Actuators, B, 2016, 222, 1096–1102 CrossRef CAS.
- K. Y. Hwa and B. Subramani, Biosens. Bioelectron., 2014, 62, 127–133 CrossRef CAS PubMed.
- D. Wang and L. Chen, Electrochim. Acta, 2009, 54, 4316–4320 CrossRef CAS.
- Z. Wang, S. Liu, P. Wu and C. Cai, Anal. Chem., 2009, 81, 1638–1645 CrossRef CAS PubMed.
- F. A. Armstrong and G. S. Wilson, Electrochim. Acta, 2000, 45, 2623–2645 CrossRef CAS.
- H. Chen, M. B. Müller, K. J. Gilmore, G. G. Wallace and D. Li, Adv. Mater., 2008, 20, 3557–3561 CrossRef CAS.
- Y. W. Zhu, S. Murali, W. W. Cai, X. S. Li, J. W. Suk, J. R. Potts and R. S. Ruoff, Adv. Mater., 2010, 22, 3906–3924 CrossRef CAS PubMed.
- W. Sun, L. L. Cao, Y. Deng, S. X. Gong, F. Shi, G. N. Li and Z. F. Sun, Anal. Chim. Acta, 2013, 781, 41–47 CrossRef CAS PubMed.
- A. K. Geim and K. S. Novoselov, Nat. Mater., 2007, 6, 183–191 CrossRef CAS PubMed.
- H. Liang, X. Miao and J. Gong, Electrochem. Commun., 2012, 20, 149–152 CrossRef CAS.
- T. Gan and S. S. Hu, Microchim. Acta, 2011, 175, 1–19 CrossRef CAS.
- J. F. Wu, M. Q. Xu and G. C. Zhao, Electrochem. Commun., 2010, 12, 175–177 CrossRef CAS.
- M. Zhou, Y. M. Zhai and S. J. Dong, Anal. Chem., 2009, 81, 5603–5613 CrossRef CAS PubMed.
- Y. Zhou, Q. Bao, L. A. L. Tang, Y. Zhong and K. P. Loh, Chem. Mater., 2009, 21, 2950–2956 CrossRef CAS.
- J. Shen, Y. Hu, C. Li, C. Qin and M. Ye, Small, 2009, 5, 82–85 CrossRef CAS PubMed.
- Y. C. Si and E. T. Samulski, Nano Lett., 2008, 8, 1679–1682 CrossRef CAS PubMed.
- A. K. Udit, K. D. Hagen, P. J. Goldman, A. Star, J. M. Gillan, H. B. Gray and M. G. Hill, J. Am. Chem. Soc., 2006, 128, 10320–10325 CrossRef CAS PubMed.
- W. Shan, H. Liu, J. Shi, L. Yang and N. Hu, Biophys. Chem., 2008, 134, 101–109 CrossRef CAS PubMed.
- A. K. Udit, M. G. Hill and H. B. Gray, Langmuir, 2006, 22, 10854–10857 CrossRef CAS PubMed.
- M. Cheong and I. Zhitomirsky, Colloids Surf., A, 2008, 328, 73–78 CrossRef CAS.
- H. Y. Zhao, W. Zheng, Z. X. Meng, H. M. Zhou, X. X. Xu, Z. Li and Y. F. Zheng, Biosens. Bioelectron., 2009, 24, 2352–2357 CrossRef CAS PubMed.
- J. S. Yang, Y. J. Xie and W. He, Carbohydr. Polym., 2011, 84, 33–39 CrossRef CAS.
- H. Yan, X. Chen, J. Li, Y. Feng, Z. Shi, X. Wang and Q. Lin, Carbohydr. Polym., 2016, 136, 757–763 CrossRef CAS PubMed.
- X. Chen, H. Yan, W. Sun, Y. Feng, J. Li, Q. Lin, Z. Shi and X. Wang, Polym. Bull., 2015, 72, 3097–3117 CrossRef CAS.
- K. Kalyanasundaram and J. K. Thomas, J. Am. Chem. Soc., 1977, 99, 2039–2044 CrossRef CAS.
- L. Q. Yang, B. F. Zhang, L. Q. Wen, Q. Y. Liang and L. M. Zhang, Carbohydr. Polym., 2007, 68, 218–225 CrossRef CAS.
- J. S. Yang, Q. Q. Zhou and W. He, Carbohydr. Polym., 2013, 92, 223–227 CrossRef CAS PubMed.
- H. R. Nie, A. H. He, J. F. Zheng, S. S. Xu, J. X. Li and C. C. Han, Biomacromolecules, 2008, 9, 1362–1365 CrossRef CAS PubMed.
- Y. An, M. Chen, Q. Xue and W. Liu, J. Colloid Interface Sci., 2007, 311, 507–513 CrossRef CAS PubMed.
- F. Shi, J. Xi, F. Hou, L. Han, G. Li, S. Gong, C. Chen and W. Sun, Mater. Sci. Eng., C, 2016, 58, 450–457 CrossRef CAS PubMed.
- W. Sun, Y. Guo, Y. Lu, A. Hu, F. Shi, T. Li and Z. Sun, Electrochim. Acta, 2013, 91, 130–136 CrossRef CAS.
- C. F. Ding, M. L. Zhang, F. Zhao and S. S. Zhang, Anal. Biochem., 2008, 378, 32–37 CrossRef CAS PubMed.
- W. Sun, Y. Q. Guo, X. M. Ju, Y. Y. Zhang, X. Z. Wang and Z. F. Sun, Biosens. Bioelectron., 2013, 42, 207–213 CrossRef CAS PubMed.
- S. F. Wang, T. Chen, Z. L. Zhang, X. C. Shen, Z. X. Lu, D. W. Pang and K. Y. Wong, Langmuir, 2005, 21, 9260–9266 CrossRef CAS PubMed.
- E. Laviron, J. Electroanal. Chem., 1974, 52, 355–393 CrossRef CAS.
- E. Laviron, J. Electroanal. Chem., 1979, 101, 19–28 CrossRef CAS.
- T. Zhan, M. Xi, Y. Wang, W. Sun and W. Hou, J. Colloid Interface Sci., 2010, 346, 188–193 CrossRef CAS PubMed.
- R. A. Kamin and G. S. Wilson, Anal. Chem., 1980, 52, 1198–1205 CrossRef CAS.
- N. Maleki, A. Safavi, F. Sedaghati and F. Tajabadi, Anal. Biochem., 2007, 369, 149–153 CrossRef CAS PubMed.
- X. Chen, H. Yan, Z. Shi, Y. Feng, J. Li, Q. Lin and X. Wang, Polym. Bull., 2017, 74, 75–90 CrossRef CAS.
- H. Yan, X. Chen, Z. Shi, Y. Feng, J. Li, Q. Lin, X. Wang and W. Sun, J. Solid State Electrochem., 2016, 20, 1783–1792 CrossRef CAS.
- W. Sun, X. Q. Li and K. Jiao, Electroanalysis, 2009, 21, 959–964 CrossRef CAS.
Footnote |
| † Electronic supplementary information (ESI) available. See DOI: 10.1039/c8ra07117a |
| This journal is © The Royal Society of Chemistry 2018 |