 Open Access Article
Shifts in microbial community structure and diversity in a novel waterfall biofilm reactor combined with MBBR under light and dark conditions
Rui Zhang,
Lutian Wang,
Ping Chen* and
Yuewu Pu *
*
School of Biology and Biological Engineering, South China University of Technology, No. 338, Outer Ring Road, Panyu District, Guangzhou City 510006, China. E-mail: g96123@scut.edu.cn; chenp211@scut.edu.cn
First published on 7th November 2018
Abstract
In this study, a novel, low-cost, easy-maintenance and effective waterfall aeration biofilm reactor (WFBR) was designed to treat wastewater with MBBR. The chemical oxygen demand (COD), nitrogen removal efficiency, and the microbial community structure in this novel system were evaluated for 70 days under light and dark conditions. The COD and ammonium nitrogen (NH3–N) removal efficiency remained at approximately 90% and 100% respectively after 25 days, even if the influent substrate concentration and illumination condition changes. High-throughput sequencing was used to investigate the composition and function of the microbial community in different fillers in the treatment system. Dark padding, illuminate carrier and fabric play the good performance in nitrogen nitrification, denitrification and fixation respectively. The major classes present were Betaproteobacteria (30.2% on average), Cytophagia (19.8%), Gammaproteobacteria (11.7%), Alphaproteobacteria (11.2%), Sphingobacteriia (5.1%), Flavobacteriia (2.6%), Deltaproteobacteria (2.4%), Verrucomicrobiae (0.7%), Chloroplast (0.6%) and Clostridia (0.5%). These results could provide important guidance for the improvement of MBBR or other tradition wastewater treatment process, and could also enrich our theoretical understanding of microbial ecology.
1. Introduction
The challenges associated with wastewater treatment, such as rising energy costs, increasingly stringent effluent requirements, and limited land use for future treatment plants, has led to the increased use of innovative and efficient technologies.1 Biofilm-based technologies for the treatment of municipal and industrial wastewater were developed to overcome several disadvantages faced by conventional floc-based systems and often produce higher effluent quality.2 In the last 20 years, the moving bed biofilm reactor (MBBR) has been established as a simple-yet-robust, flexible and compact technology for wastewater treatment.The establishment and development of an ideal biofilm is integral to the MBBR process, which utilizes microorganisms that are both biofilm-based and floc-based. Suspended carriers are added to the reactors at the treatment plants to retain slow-growing organisms despite the low hydraulic retention time generally incurred at MBBRs.3 MBBRs have been designed to meet a wide range of effluent quality standards, including stringent nutrient limits and also applicable to wide range wastewater flows ranging from 10![[thin space (1/6-em)]](https://www.rsc.org/images/entities/char_2009.gif) 000 to 150
000 to 150![[thin space (1/6-em)]](https://www.rsc.org/images/entities/char_2009.gif) 000 m3 per day.4 MBBRs have become an interesting alternative for wastewater treatment as it is reliable and compact systems due to development in their designs and operation which has resulted in decreased process, significantly lower suspended solid production, consistent production of high quality and reusable water and minimal waste disposal.5 Aeration rate and oxygen transfer efficiency played very important role in the MBBR treatment, while the oxygenation capacity of aerator which used in MBBR usually decreased relatively rapidly, and the replacement of aerator are still a problem in real wastewater treatment.6
000 m3 per day.4 MBBRs have become an interesting alternative for wastewater treatment as it is reliable and compact systems due to development in their designs and operation which has resulted in decreased process, significantly lower suspended solid production, consistent production of high quality and reusable water and minimal waste disposal.5 Aeration rate and oxygen transfer efficiency played very important role in the MBBR treatment, while the oxygenation capacity of aerator which used in MBBR usually decreased relatively rapidly, and the replacement of aerator are still a problem in real wastewater treatment.6
Previous research shows that the nonwoven fabric material itself can be considered a highly permeable ‘rough’ filter in wastewater treatment, the biofilm forming on its surface acts as an effective membrane filter that is capable of retaining small particles.7 And non-woven fabric as a kind of cost effective filler which usually used in wastewater treatment in recent years.7–9 Fibrous flexible carriers and suspended polyethylene paddings are traditional fillers which can be applicated in engineering practice.5,10 Because of the different physical characteristics of these fillers, they have potential to be used in a novel integrated system.
In this study, a novel, low-cost and easy-maintenance waterfall biofilm reactor (WFBR) was designed, which can combine with MBBR treating wastewater without need of forced aeration in the waterfall. To better understand the performance of the reactors, it was necessary to study the microbial communities in the related reactors. Researchers use several methods to study microbes in wastewater including fluorescence in situ hybridization (FISH),11 denaturing gradient gel electrophoresis (DGGE),12,13 and high-throughput sequencing.14–16 The microbial ecology of conventional activated sludge wastewater treatment systems has been studies using next generation sequencing technologies.17–19 However, the effects of the biofilm reactors on the microbial community structure in light and dark condition have rarely been reported.
The overall performance of WFBR combined with MBBR was studied and the microbial community under light and dark conditions was investigated using high-throughput sequencing. Sequences analyses and Functional Annotation of Prokaryotic Taxa (FAPROTAX) analysis were performed to appraise the correlation between microbial community composition and environmental factors. A better understanding of characteristics of pollutant removal and microbial communities in the novel reactor could provide important guidance for the improvement of traditional wastewater treatment systems, and could also enrich our theoretical understanding of microbial ecology in light and dark conditions, which is very important in the real wastewater treatment process.
2. Material and method
2.1 System setup and operation
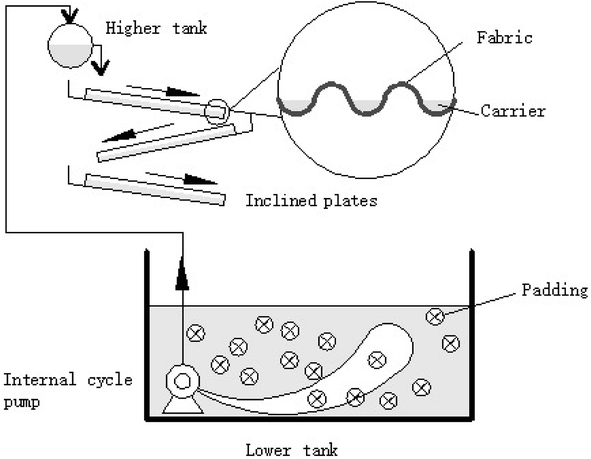
The novel WFBR combined with MBBR system configuration is illustrated in Fig. 1. The effective volume of the lower water tank was 30 L (length 50 cm, width 40 cm and height 20 cm). The main part of the reactor are three layers of inclined plates carried by a steel hob. The materials of inclined plates with a slope of 8° are polyvinyl chloride corrugated tile (length 33 cm, width 28 cm, height 16 mm, wave distance 63 mm, and wave height 8 mm) with polypropylene non-woven fabric covering the plates to serve as a membrane. The fibrous flexible carriers whose unfolding diameter are 120 mm tied a knot per 80 mm which can be aerobic or anaerobic units are put on the wave troughs. Each lower tank containing suspended polyethylene paddings (K3 carriers, AnoxKaldnes™) and filling fraction is 60%. All of the fabric, carriers and paddings are produced by Guangzhou Lvye Environment Protection Equipment Co., Ltd.Wastewater was pumped to the higher tank, which then moved by gravity to pass over the surface of the inclined plate and then down to the lower tank, and the submersible pump push water rotating the water in lower tank in the same time. As the effluent from the units drops into the next plate, the energy consumption is reduced and the sludge recycling is rendered unnecessary. There were two sets of processes operating at the same time under 6000 lux and dark condition respectively. For this reactor, we adopted sequencing batch, closed circuit circulation methods and natural startup strategy. After 25 days of operation, a steady state was obtained and a compact biofilm was formed.
2.2 Characteristics of wastewater
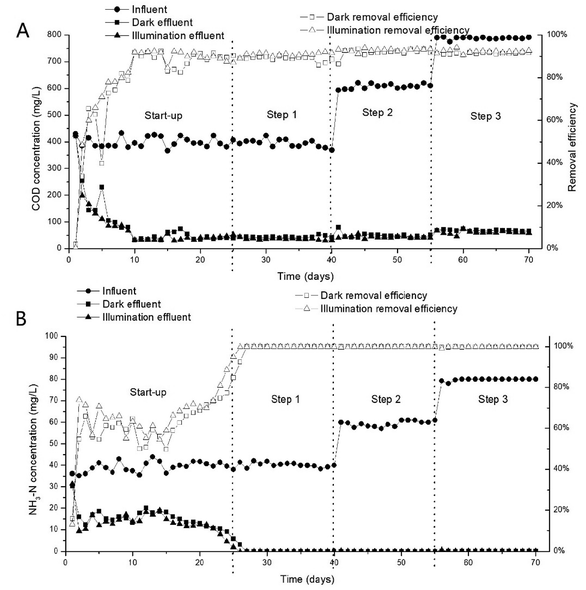
The composition of the synthetic wastewater was referred from previous studies. CH3COONa was the only source of organic carbon, and the influent medium consisted of NH4Cl, KH2PO4, MgSO4·7H2O, CaCl2·2H2O, FeCl3·6H2O, NaHCO3 and trace elements in solution.20 The experiments were divided into three steps, each one for treating wastewater with higher COD and NH3–N concentration than last step. The COD and NH3–N in the influent was 400 mg L−1 and 40 mg L−1(step 1), 600 mg L−1 and 60 mg L−1(step 2), 800 mg L−1 and 80 mg L−1(step 3), respectively. The operating conditions were kept consistent with those of the startup phase (temperature, pH, HRT and internal cycle rate was 25–28 °C, 7 ± 0.3, 8 h and 3.5 L min−1, respectively).2.3 Analytical methods
Wastewater samples were collected every 24 h in 70 days, alongside approximately 100 mL of well-mixed reactor contents from the effluent. The COD was analyzed according to Chinese State Environmental Protection Agency (CSEPA) standard methods (HJ/T399-2007). Ammonium, nitrate, and nitrite concentrations were measured using an ultraviolet spectrophotometer (UV2700, SHIMADZU, Japan). The dissolved oxygen (DO), temperature, and pH were measured using a portable dissolved oxygen meter with a temperature readout (HQ30d, HACH, Loveland, CO, USA) and a digital pH meter (A221, Thermo, Waltham, MA, USA), respectively. The structure of the biofilm was determined using a scanning electron microscope (Car Zeiss EVO LS10, Zeiss British company, Cambridge, UK), the biofilm samples were freeze-dried and metal sputter-coated before acquiring images.2.4 Biomass sample collection and DNA extraction
Biofilm samples for the analysis of the microbial community were collected on the 70th day of operation time when the system was in the period of stable operation. A total of 6 biofilms were collected from the system, including the biofilms from each reactor in different fillers (illuminate fabric, illuminate carriers, illuminate paddings, dark fabric, dark carriers and dark paddings abbreviation as IF, IC, IP, DF, DC and DP respectively).Total DNA from different samples was extracted using the MicroElute Genomic DNA Kit (D3096-01, Omega, Inc., USA) according to manufacturer's instructions. The reagent that was designed to isolate DNA from trace amounts of sample has been shown to be effective for the isolation of DNA from most bacteria. Sample blanks consisted of unused swabs processed through DNA extraction procedure and tested to contain no 16S amplicons. Three replicates of DNA extracts from each sample were pooled together and stored at −80 °C until the subsequent PCR amplification and high-throughput sequencing by Novogene Bioinformatics Technology (Beijing, China).
2.5 PCR amplification and bacterial 16S rDNA sequencing
The bacterial primers 338F (5′-ACTCCTACGGGAGGCAGCAG-3′) and 806R (5′-GGACTACHVGGGTWTCTAAT-3′) were used to amplify the V3–V4 region of the 16S rRNA gene.21 All PCR reactions were carried out with Phusion® High-Fidelity PCR Master Mix (New England Biolabs) in triplicate for every sample. Mix same volume of 1× loading buffer (contained SYB green) with PCR products and operate electrophoresis on 2% agarose gel for detection. Then, the triplicated PCR products were pooled and the mixture PCR products were purified with GeneJET™ Gel Extraction Kit (Thermo Scientific). The amplicons from six samples were quantified and mixed in equidensity ratios. Sequencing libraries were generated using Ion Plus Fragment Library Kit 48 rxns (Thermo Scientific) following manufacturer's recommendations. The library quality was assessed on the Qubit@ 2.0 Fluorometer (Thermo Scientific). At last, the library was sequenced on an Ion S5™ XL platform and 600 bp single-end reads were generated. The high-through sequencing data was assigned to samples based on their unique barcode and truncated by cutting off the barcode and primer sequence. Quality filtering on the raw reads were performed under specific filtering conditions to obtain the high-quality clean reads according to the Cutadapt22 (V1.9.1, http://cutadapt.readthedocs.io/en/stable/) quality controlled process. The reads were compared with the reference database (Silva database, https://www.arb-silva.de/)23 using UCHIME algorithm (UCHIME Algorithm, http://www.drive5.com/usearch/manual/uchime_algo.html)24 to detect chimera sequences, and then the chimera sequences were removed. Then the Clean Reads finally obtained. Raw Ion S5™ XL sequencing data have been deposited to the NCBI sequence read archive (SRA) database with accession number of SRP158493.2.6 Data analysis
Sequences analysis were performed by Uparse software (Uparse v7.0.1001, http://drive5.com/uparse/).25 Sequences with ≥97% similarity were assigned to the same OTUs. Representative sequence for each OTU was screened for further annotation. For each representative sequence, the Silva Database (https://www.arb-silva.de/)23 was used based on Mothur algorithm to annotate taxonomic information. The reads among different samples were normalized to an even depth using a standard of sequence number corresponding to the sample with the least sequences (n = 49![[thin space (1/6-em)]](https://www.rsc.org/images/entities/char_2009.gif) 530) by QIIME script. Subsequent analysis of alpha diversity and beta diversity were performed based on the normalized data.
530) by QIIME script. Subsequent analysis of alpha diversity and beta diversity were performed based on the normalized data.
Alpha diversity is applied in analyzing complexity of species diversity for a sample through 6 indices, including Observed-species, Chao1, Shannon, Simpson, ACE, Good-coverage. All this indices in our samples were calculated with QIIME (Version1.7.0) and displayed with R software (Version 2.15.3). For beta diversity, principal coordinate analysis (PCoA) analysis was conducted based on UniFrac metrics. Weighted UniFrac distance and unweighted pair-group method with arithmetic means (UPGMA) clustering were also calculated by QIIME (Version 1.7.0).
2.7 Functional predictions
The functional contents of our bacterial community dataset were assessed based on 16S rRNA gene sequencing data with FAPROTAX,26 which is a database that maps prokaryotic clades to established metabolic or other ecologically relevant functions, using the current literature on cultured strains. FAPROTAX includes software for converting taxonomic microbial community profiles into putative functional profiles, based on taxa identified in a sample.3. Result and discussion
3.1 Performance of the system
The performance of the system was examined over 70 days, and the DO remained between 7–9 mg L−1 in whole experiment. After 25 days start-up period, the system ran over 45 days in stable continuous operation. As shown in Fig. 2, the COD and NH3–N removal efficiency remained at approximately 90% and 100% respectively after 25 days. Generally, the system displayed good performance in all experiments and there is no significant difference in effluent between light and dark. Although the COD and NH3–N concentration of the influent increased in step 2 and step 3, the effluent COD and NH3–N remained stable, indicating that the system had the ability to withstand fluctuations in the influent substrate concentration under light or dark condition. A possible explanation for the good performance in terms of automatic adaptation to different organic and ammonia nitrogen load ratios is that the bacteria community was diversiform; because the proportion of the initial microbial community changed with influent. As the biomass increased, the microbial reproduction contributed to adaptability of the microbial community structure in the WFBR and MBBR and to the performance of the system.Though MBBR and MABR also showed good stability in response to unsteady states caused by feed variation,27,28 the novel system has a significant advantage in unit project investment and operation cost. The unit investment of a novel integrated system is 350 renminbi (RMB), including 200 RMB for the steel construction, 20 RMB for the inclined plates, 100 RMB for the fillers (including fabric, carrier and padding), and 30 RMB for the pumps (12 W). The operation cost is only that required for electricity without the need for replacing filler and manpower which is most expensive in advanced areas.29,30 Traditional instrument has generally failed to achieve a high level of environmental protection and there have been high costs for all of society,31 so efficient and economical water treatment processes are necessary to future development.32 And this novel system can provide a whole new direction for this development.
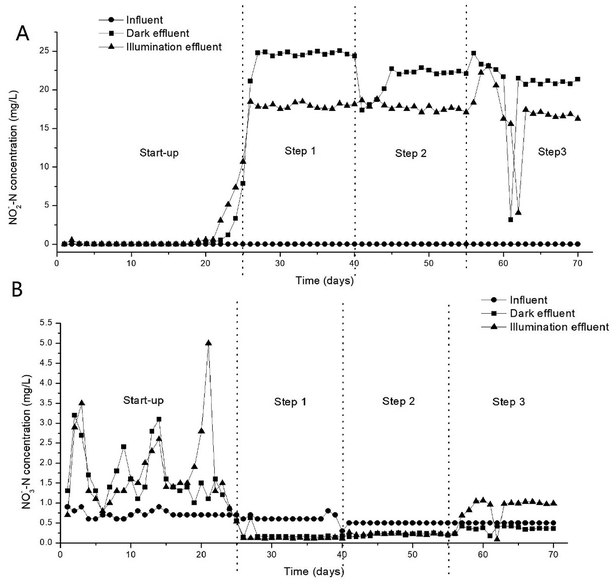
In this study, the system shows good nitrification in all experiments, but the performance of denitrification is different between dark and light conditions. The nitrogen compounds in the effluent mainly existed in the form of NO2−–N and NO3−–N. The NO2−–N and NO3−–N removal results are illustrated in Fig. 3. In start up period, there is nearly no NO2−–N accumulated in light and dark, which showed that complete nitrification occurred in the reactors. Then NO2−–N dramatically increased to 20–25 mg L−1 and 16–18 mg L−1 in dark and light respectively in stabilization period. And the NO3−–N concentration was maintained at a very low level in the same time. It showed that simultaneous partial nitrification and denitrification occurred in the reactors and light can promote the process of denitrification. It is different from some previous work which hold higher irradiance resulted in periphytic biofilms with lower denitrification capacity.33 This difference may come from the difference in biofilm structure leads to a difference in microenvironment, which causes a difference in nitrogen cycle related microorganisms and thus the overall denitrification potential of the periphytic biofilms. Therefore the structure of microbial communities attached to DF, DC, IF and IC in the system have been analyzed by scanning electron microscopy (SEM). A possible explanation for the accumulation of NO2−–N is that under carbon-deficit conditions, nitrification and denitrification rates are not in equilibrium, resulting in a low SND efficiency.34
3.2 Morphology characteristics of microorganism in biofilm
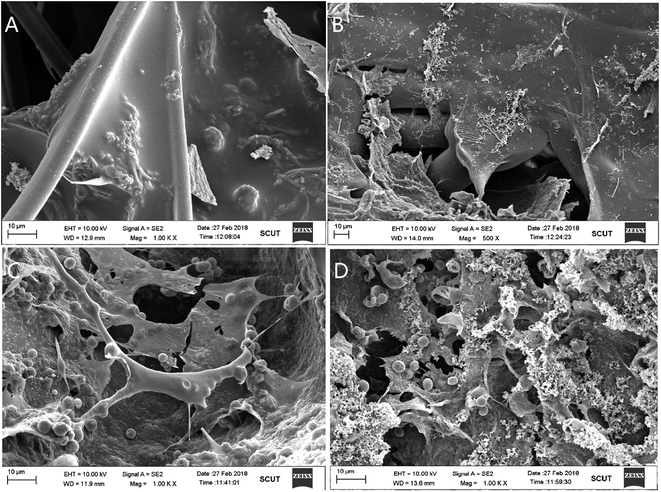
In order to compare the different surface structures of the mature biofilms formed by the four different conditions (DC, DF, IC, IF), scanning electron microscopy (SEM) was used to observed the phenotypic difference which indicated the different microbial types between samples. The results were shown in Fig. 4. The biofilm in dark was dominated by rod-shaped and filamentous microbes, and medium substances in which cells are embedded. The medium substances include inorganic compounds and EPS. The results show that more biomass in DF than DC, which meant that fabric may plays more important role in the treatment than carrier in dark. In contrast, more biomass in IC than IF, so carrier may the more important part of the reactor in the treatment under light. The biofilm at the interface in DF predominantly consisted of long-rod bacteria and the biofilm in DC predominantly consisted of short-rod and filamentous bacteria. In contrast, the biofilm in light was dominated by cocci and rod-shaped bacteria. Further comparing with the differences in the surface structure of the dark biofilms, the biofilm in light was more compact, and the gap structure more homogeneous. Research has indicated that an excessively loose biofilm leads to poor adhesion.35 This means that extracellular polymeric substances (EPS) are secreted less often, the growth situation is not ideal, and that the efficiency of nitrogen removal in biofilm reactors is diminished.363.3 Microbial community composition and biodiversity variation
In order to further analyze the microbial communities of the 6 biofilms, the 16S rRNA genes were sequenced by Ion S5™ XL platform high-throughput sequencing and the statistical analysis based on the operational taxonomic units (OTUs) clustered from the pyrosequencing reads is shown in Table 1.| Index | OTUs | Shannon | Simpson | Chao 1 | ACE | Coverage |
|---|---|---|---|---|---|---|
| DC | 205 | 4.29 | 0.91 | 237.8 | 244.332 | 0.999 |
| DF | 209 | 4.16 | 0.9 | 229.1 | 238.796 | 0.999 |
| DP | 228 | 3.9 | 0.82 | 263.0 | 267.678 | 0.999 |
| IC | 254 | 5.38 | 0.95 | 271.2 | 270.293 | 0.999 |
| IF | 252 | 4.13 | 0.87 | 269.9 | 280.614 | 0.999 |
| IP | 277 | 5.22 | 0.94 | 399.5 | 315.302 | 0.999 |
Microbial community richness was evaluated by the Chao 1 index and ACE index. Meanwhile, community α-diversity was estimated by Shannon index and Simpson index.37 Result clearly showed that the IP and DP samples achieved the highest value of Chao 1 index and ACE index in each system. This means that the biofilm in paddings have the highest community richness than other fillers. And the IC and DC showed the highest value of Shannon index and Simpson index, which indicated that the highest diversity biofilm attached in carrier. Overall, the biofilm in light had the higher diversity and richness than dark. It was reported that the efficient and stable operation of bioreactors relied upon the microbial community stability in the ecosystem during the nutrients removal process.38 That might be the reason that the effluent of NO2−–N concentration under light lower than dark in step 3.
3.4 Communities similarity analysis in different fillers
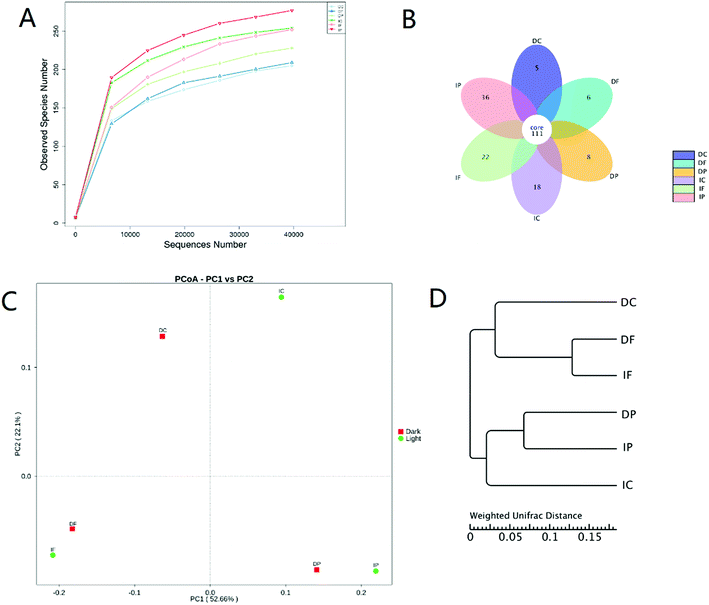
Six rarefaction curves nearly arrived to the curvilinear or plateau phases which indicated that the results represented the majority of bacterial 16S rRNA sequences present in each sample (Fig. 5). This also could be supported by the Coverage index in Table 1, all of which exceeded 0.999 suggested the coverage degree of the Ion S5™ XL sequencing was high and anticipant.Communities similarity could be evaluated by the flower diagram, PCoA analysis of all communities and the cluster analysis (Fig. 5).39,40 The core OTUs in these communities was about 111. And the number of unique OTUs in the light communities are more than these in dark. It indicated that microbial community richness tends to be increased in light condition. This view also was testified by the PCoA analysis and cluster analysis directly. It was clear that the longest relative distance emerged between the communities in IC and DC, which hinted the illumination condition also influenced community similarity in carrier. Nevertheless, samples from IF and DF, IP and DP tended to cluster together, respectively. This means that illumination condition only slightly affected microbial community in fabric and padding. Therefore the WFBR may the main reactor affected by the illumination condition.
3.5 Microbial community composition
Altogether, forty-five classes were recovered from the samples, and the OTUs of unclassified classes only accounted for a small proportion of the total OTUs. Thus, the taxonomic analysis was able to represent the real profile of the microbial community in the system. The relative abundance of the major classes in the bacterial communities (only those with abundance top 10 were considered) was shown in Fig. 6. The major classes were Betaproteobacteria (30.2% on average), Cytophagia (19.8%), Gammaproteobacteria (11.7%), Alphaproteobacteria (11.2%), Sphingobacteriia (5.1%), Flavobacteriia (2.6%), Deltaproteobacteria (2.4%), Verrucomicrobiae (0.7%), Chloroplast (0.6%) and Clostridia (0.5%).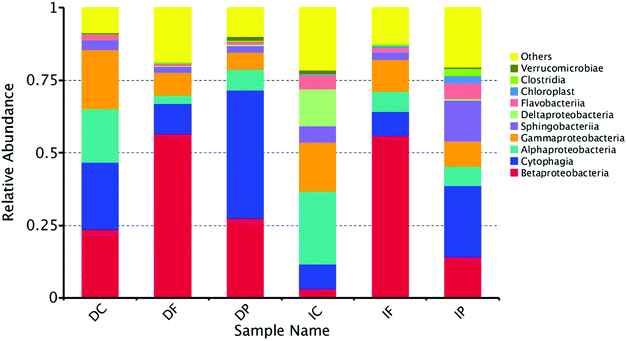 | ||
| Fig. 6 Taxonomic composition of the microbial community at class level revealed by the pyrosequencing of 16S rRNA genes. | ||
It was obvious that Betaproteobacteria occupied the top position in DF and IF communities with the relative abundance of more than 56%, and it also accounted for 23.6%, 27.5% and 14.2% relative abundance in DC, DP and IP respectively. By contrast, the Betaproteobacteria just occupied 3.1% in IC, while the Alphaproteobacteria and Deltaproteobacteria had the highest distribution. And IC nearly the only sample contained the Deltaproteobacteria. Evidence of Deltaproteobacteria in biofilms of MBBR, membrane bioreactors or activated sludge basins treating wastewater has previously been shown.41,42 Deltaproteobacteria is a kind of anaerobic microorganisms, which establish only in the later stages presumably due to their slow growth and requirement for anoxic conditions.43 Previous researches show that illumination can promote the process of biofilm maturation44,45 and the biofilm in light was more compact, and the gap structure more homogeneous. In the same time, IC contribute to a suitable environment for Deltaproteobacteria. Proteobacteria has been widely reported as the dominant bacteria in municipal wastewater and activated sludge.46 Alphaproteobacteria and Gammaproteobacteria showed strong positive correlations with the organic carbons in coastal surface sediments.47 And previous studies also revealed that Betaproteobacteria play a critical role in degradation of organic matter in sewage treatment plants.48 Alphaproteobacteria, Betaproteobacteria and Gammaproteobacteria were abundant in each sample, and That may the reason of high removal efficiency for COD in the whole system whether in dark or light condition. The Cytophagia was the second most common bacterial in samples, and it accounted for 23.1%, 44.2% and 24.5% in DC, DP and IP. Cytophagia have also been reported to lyse green algae, which plays a very important role in the NH3–N removal.49 And the Cytophagia accounted for high distribution in light and dark samples respectively. Therefore the system have showed the high performance of NH3–N.
The Sphingobacteriia have the larger proportion in light samples than dark, and previous works reported that hydrogenotrophic denitrifying class Sphingobacteriia participated in the nitrogen removal process in a membrane biofilm reactor.50 Which may also contributed to the lower effluent of NO2−–N concentration in light than dark. One particularly notable group of microorganisms which come to prominence in the IP belonging to Chloroplast and Clostridia. Previous research shows that the Clostridia establish only in these later stages of biofilm presumably due to their slow growth and requirement for anoxic conditions51 and the Chloroplast produce oxygen through photosynthesis. It means that the structure of the biofilm microbial community encouraged simultaneous aerobic nitrification and anoxic denitrification. Previous studies of bacterial ecology in real wastewater treatment systems mainly detected the same major classes.52–54 And the performance of different biofilm reactor treating synthetic wastewater and real wastewater did not show big differences in major pollutants.55–57 Although there is a little gap between synthetic and real wastewater treatment, these results could provide important guidance for the application of this integrated system in real wastewater treatment in the future.
3.6 Functional annotation of prokaryotic taxa
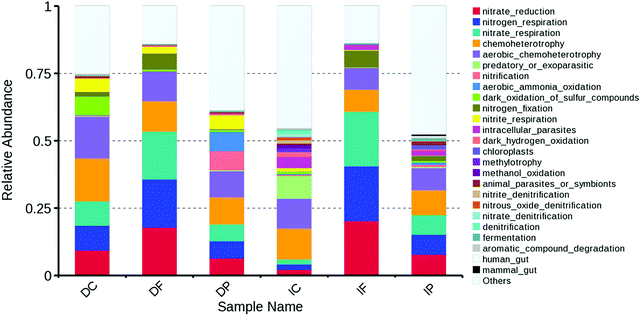
To determine the function of different microbial taxonomic composition within different fillers, we associated each taxonomically annotated OTU with one or more metabolic functions based on extensive literature search, whenever possible. Our complete database for the FAPROTAX is available online at http://www.zoology.ubc.ca/louca/FAPROTAX. A detailed evaluation of FAPROTAX, including a direct comparison with metagenomics, has been provided previously.26 The predictive functional profiling (Fig. 7) indicated that the most predicted metabolic functional categories were related to organic matters and nitrogen translation: nitrate reduction (2.22–20.33%), nitrogen respiration (1.91–17.8%), nitrate respiration (1.92–17.8%), chemoheterotrophy (8.21–15.91%), aerobic chemoheterotrophy (7.95–15.58%), nitrification (0.02–7.2%), aerobic ammonia oxidation (0.02–7.2%), nitrogen fixation (0.25–6.29%), nitrite respiration (0.11–5.2%). It was obviously that the function composition of each sample varies greatly and it means that the different fillers showed different abilities in different conditions (light and dark).Chemoheterotrophy and aerobic chemoheterotrophy function were abundant in each sample, so the whole system showed good performance of COD removal. Nitrate reduction and nitrate respiration also the major function in whole system, and it leads to a decrease in nitrate and accumulation of nitrite in the treatment.
Padding was the most important part for the removal of NH3–N in dark treatment, because DP was nearly the only sample which have aerobic ammonia oxidation and nitrification function (accounted for 7.2% and 7.2% respectively). In contrast, carrier played the most important role for the removal of NO2−–N and NO3−–N in light treatment, because IC have nitrate denitrification, nitrite denitrification, nitrous oxide denitrification and denitrification functions. Fabric have the large proportion of nitrogen fixation function (6.04% in dark, 6.29% in light), and many previous research have described the use of nitrogen fixation systems for the successful treatment of pulp and paper mill wastewater in laboratory-scale and full-scale system.58,59 Apart from the obvious cost and labor savings, a major advantage of these self-regulating systems over those where exogenous nitrogen is added, is that the final effluent nitrogen concentrations are low and stable.60 Therefore, the system will be designed as light WFBR combined with dark MBBR for the better performance of wastewater treatment in future study.
4. Conclusion
A fuel-efficient, stable, novel WABR was designed for MBBR treating wastewater without need of forced aeration, and the fabric, carrier and filler showed different abilities in dark and light condition. The results revealed that the light WABR combined with dark MBBR system will have a better performance for COD and nitrogen removal than pure system. The different ability of pollutants in different illumination condition (light and dark) was compared, and the analysis of high-throughput sequencing data indicated that the microbial communities were highly dependent on the habitat and conditions of each bioreactor, and affected the whole function of the system. The results for the low-cost, easy-maintenance, and effective WABR designed in the study could provide important guidance for the improvement of MBBR or other tradition wastewater treatment process, and could also enrich our theoretical understanding of microbial ecology.Conflicts of interest
The authors declare no conflict of interestAcknowledgements
This work was supported by the Guangdong Provincial Department of Oceans and Fisheries during the 2017 Fishing port construction and fishery industry development project [“Research of biological nitrogen removal and simultaneous dissolved oxygen technology in aquaculture” No: (2017)17]References
- K. Biswas, M. W. Taylor and S. J. Turner, Appl. Microbiol. Biotechnol., 2014, 98, 1429–1440 CrossRef CAS PubMed.
- G. Andreottola, P. Foladori, M. Ragazzi and F. Tatàno, Water Sci. Technol., 2000, 41, 375–382 CrossRef CAS.
- X. J. Wang, S. Q. Xia, L. Chen, J. F. Zhao, N. J. Renault and J. M. Chovelon, Process Biochem., 2006, 41, 824–828 CrossRef CAS.
- J. A. Kawan, H. A. Hasan, F. Suja, O. Jaafar and R. Abd-Rahman, J. Eng. Sci. Technol., 2016, 11, 8 Search PubMed.
- A. Barwal and R. Chaudhary, Rev. Environ. Sci. Bio/Technol., 2014, 13, 285–299 CrossRef CAS.
- S. Sander, J. Behnisch and M. Wagner, Water Sci. Technol., 2017, 75, 890–897 CrossRef CAS PubMed.
- X. Ren, H. K. Shon, N. Jang, Y. G. Lee, M. Bae, J. Lee, K. Cho and I. S. Kim, Water Res., 2010, 44, 751–760 CrossRef CAS PubMed.
- A. Ying, Z. Wang, Z. Wu, D. Yang and Z. Qi, Chem. Eng. J., 2009, 155, 709–715 CrossRef.
- W. Zhang, Desalin. Water Treat., 2016, 57, 2952–2958 CrossRef.
- S. Wang, Y. Pu and C. Wei, J. Environ. Sci. Health A Tox. Hazard Subst. Environ. Eng., 2016, 1–7 Search PubMed.
- C. Paungfoo, P. Prasertsan, P. C. Burrell, N. Intrasungkha and L. L. Blackall, Biotechnol. Bioeng., 2007, 97, 985 CrossRef CAS PubMed.
- N. Boon, W. Windt, W. Verstraete and E. M. Top, Evaluation of nested PCR–DGGE (denaturing gradient gel electrophoresis) with group-specific 16S rRNA primers for the analysis of bacterial communities from different wastewater treatment plants, 2002 Search PubMed.
- Y. Ma, C. Homstrm, J. Webb and S. Kjelleberg, Acta Ecol. Sin., 2003, 23, 1561–1569 Search PubMed.
- L. Cai and T. Zhang, Environ. Sci. Technol., 2013, 47, 5433–5441 CrossRef CAS PubMed.
- Y. Bai, W. Qi, J. Liang and J. Qu, Appl. Microbiol. Biotechnol., 2014, 98, 1841 CrossRef CAS PubMed.
- X. M. Lu and P. Z. Lu, Microb. Ecol., 2014, 67, 612 CrossRef CAS PubMed.
- M. Hu, X. Wang, X. Wen and Y. Xia, Bioresour. Technol., 2012, 117, 72–79 CrossRef CAS PubMed.
- S. L. Mclellan, S. M. Huse, S. R. Mueller-Spitz, E. N. Andreishcheva and M. L. Sogin, Environ. Microbiol., 2010, 12, 378–392 CrossRef CAS PubMed.
- T. Zhang, M. F. Shao and L. Ye, ISME J., 2012, 6, 1137–1147 CrossRef CAS PubMed.
- M. K. Jungles, M. Figueroa, N. Morales, R. H. R. D. Costa, J. L. Campos, A. Mosquera Corral and R. Méndez, J. Chem. Technol. Biotechnol., 2011, 86, 763–768 CrossRef CAS.
- P. Wang, B. Chen and H. Zhang, Acta Ecol. Sin., 2017, 613, 1430 Search PubMed.
- M. Martin, EMBnet J., 2011, 17, 110 Search PubMed.
- C. Quast, E. Pruesse, P. Yilmaz, J. Gerken, T. Schweer, P. Yarza, J. Peplies and F. O. Glöckner, Nucleic Acids Res., 2013, 41, 590–596 CrossRef PubMed.
- R. C. Edgar, B. J. Haas, J. C. Clemente, C. Quince and R. Knight, Bioinformatics, 2011, 27, 2194 CrossRef CAS PubMed.
- R. C. Edgar, Nat. Methods, 2013, 10, 996–998 CrossRef CAS PubMed.
- S. Louca, L. W. Parfrey and M. Doebeli, Science, 2016, 353, 1272 CrossRef CAS PubMed.
- A. H. Birima, M. J. M. M. Noor, T. A. Mohammed, A. Idris, S. A. Muyibi, H. Nagaoka, J. Ahmed and L. A. A. Ghani, Desalin. Water Treat., 2009, 7, 275–284 CrossRef CAS.
- H. Falahti-Marvast and A. Karimi-Jashni, Int. Biodeterior. Biodegrad., 2015, 104, 363–370 CrossRef CAS.
- M. Molinossenante, F. Hernándezsancho and R. Salagarrido, Sci. Total Environ., 2010, 408, 4396–4402 CrossRef CAS PubMed.
- M. Gander, B. Jefferson and S. Judd, Sep. Purif. Technol., 2000, 18, 119–130 CrossRef CAS.
- K. M. Zhang and Z. G. Wen, J. Environ. Manage., 2008, 88, 1249–1261 CrossRef PubMed.
- D. Moran and S. Dann, J. Environ. Manage., 2008, 87, 484–496 CrossRef PubMed.
- Y. Zhao, X. Xiong, C. Wu, Y. Xia, J. Li and Y. Wu, Sci. Total Environ., 2017, 613–614 Search PubMed.
- Y. C. Chiu, L. L. Lee, C. N. Chang and A. C. Chao, Int. Biodeterior. Biodegrad., 2007, 59, 1–7 CrossRef CAS.
- L. T. Mulcahy and K. S. Wen, Water Res., 1987, 21, 451–458 CrossRef CAS.
- E. Ahmadi, M. Gholami, M. Farzadkia, R. Nabizadeh and A. Azari, Bioresour. Technol., 2015, 183, 129–135 CrossRef CAS PubMed.
- C. Liu, H. Wang, W. Xing and L. Wei, Appl. Microbiol. Biotechnol., 2013, 97, 9377–9387 CrossRef CAS PubMed.
- R. Hai, Y. Wang, X. Wang, Y. Li and Z. Du, PLoS One, 2014, 9, e90175 CrossRef PubMed.
- L. Wen, W. Zhang and Z. Yu, Bioresour. Technol., 2013, 142, 625–632 CrossRef PubMed.
- V. Patel, H. Munot, Y. S. Shouche and D. Madamwar, Bioresour. Technol., 2014, 161, 362–370 CrossRef CAS PubMed.
- K. Kimura, N. Yamato, H. Yamamura and Y. Watanabe, Environ. Sci. Technol., 2005, 39, 6293 CrossRef CAS PubMed.
- C. M. Santegoeds, T. G. Ferdelman, G. Muyzer and B. D. De, Appl. Environ. Microbiol., 1998, 64, 3731–3739 CAS.
- K. Biswas and S. J. Turner, Appl. Environ. Microbiol., 2012, 78, 855–864 CrossRef CAS PubMed.
- Q. Liao, Y. J. Wang, Y. Z. Wang, X. Zhu, X. Tian and J. Li, Bioresour. Technol., 2010, 101, 5315 CrossRef CAS PubMed.
- S. Costa, S. Ganzerli, I. Rugiero, S. Pellizzari, P. Pedrini and E. Tamburini, Water, 2017, 9, 108 CrossRef.
- D. Baudišová, A. Benáková and F. Wanner, Silva Gabreta, 2012, 18, 79 Search PubMed.
- H. Sinkko, K. Lukkari, L. M. Sihvonen, K. Sivonen, M. Leivuori, M. Rantanen, L. Paulin and C. Lyra, PLoS One, 2013, 8, e67061 CrossRef CAS PubMed.
- X. C. Liu, Y. Zhang, Y. M. Yu, Z. Y. Wang and W. Z. Lv, J. Environ. Sci., 2007, 19, 60–66 CrossRef CAS.
- J. J. Cole, Annu. Rev. Ecol. Syst., 1982, 13, 291–314 CrossRef.
- D. Chen, H. Wang, B. Ji, K. Yang, L. Wei and Y. Jiang, Process Biochem., 2015, 50, 1904–1910 CrossRef CAS.
- G. Muyzer and A. J. M. Stams, Nat. Rev. Microbiol., 2008, 6, 441–454 CrossRef CAS PubMed.
- N. Yang, G. Zhan, D. Li, X. He, Y. Zhang, Q. Jiang, H. Liu and C. Wang, Chem. Eng. J., 2018, 20, 18 Search PubMed.
- S. Duntao, H. Yanling, Y. Hong and W. Qingyi, Bioresour. Technol., 2015, 186, 163–172 CrossRef PubMed.
- Y. Q. Liu, B. Moy, Y. H. Kong and J. H. Tay, Enzyme Microb. Technol., 2010, 46, 520 CrossRef CAS PubMed.
- M. Ak and O. Gunduz, Water, Air, Soil Pollut., 2013, 224, 1–16 CrossRef CAS.
- C. Barca, C. Gérente, D. Meyer, F. Chazarenc and Y. Andrès, Water Res., 2012, 46, 2376–2384 CrossRef CAS PubMed.
- I. Nilsson, A. Möller, B. Mattiasson, M. S. T. Rubindamayugi and U. Welander, Enzyme Microb. Technol., 2006, 38, 94–100 CrossRef CAS.
- F. Kargi and S. Ozmihçi, Bioresour. Technol., 2004, 94, 113–117 CrossRef CAS PubMed.
- M. A. Dennis, M. L. Cotter, A. H. Slade and D. J. Gapes, Water Sci. Technol., 2004, 50, 269 CrossRef CAS PubMed.
- P. J. Welz, J. B. Ramond, L. Braun, S. Vikram and R. H. M. Le, J. Environ. Manage., 2018, 207, 192 CrossRef CAS PubMed.
| This journal is © The Royal Society of Chemistry 2018 |

