 Open Access Article
Creative Commons Attribution 3.0 Unported Licence
Performance enhancement of asymmetric supercapacitors with bud-like Cu-doped Mn3O4 hollow and porous structures on nickel foam as positive electrodes†
Xiaobo Chen a,
Cheng Chena,
Tianzhi Xua,
Yingjie Xua,
Weiwei Liua,
Wen Yangb and
Peizhi Yang
 *b
*b
aSchool of New Energy and Electronic Engineering, Yancheng Teachers University, Yancheng, 224051, PR China
bKey Laboratory of Education Ministry for Advance Technique and Preparation of Renewable Energy Materials, Yunnan Normal University, Kunming, 650500, PR China. E-mail: pzhyang@hotmail.com
First published on 22nd October 2018
Abstract
Cu-doped Mn3O4 hollow nanostructures supported on Ni foams as high-performance electrode materials for supercapacitors were successfully synthesized through a facile hydrothermal method and subsequent calcination. The morphology, structure, and electrochemical performance of the as-prepared Mn3O4 nanostructures can be tuned just by varying the Cu doping content. Benefiting from the unique bud-like hollow structure, the 1.5 at% Cu-doped Mn3O4 sample has a high specific capacitance of 257.6 F g−1 at 1 A g−1 and remarkable stability (about 90.6% retention of its initial capacitance after 6000 electrochemical cycles). Besides, an asymmetric supercapacitor (ASC) cell based on the 1.5 at% Cu-doped Mn3O4 exhibits a high specific capacitance of 305.6 F g−1 at 1 A g−1 and an energy density of 108.6 W h kg−1 at a power density of 799.9 W kg−1. More importantly, the ASC shows good long-term stability with 86.9% capacity retention after charging/discharging for 6000 cycles at a high current density of 5 A g−1.
1. Introduction
In recent years, supercapacitors (SCs) have been widely recognized in a wide range of energy storage applications due to their properties such as their faster charging–discharging, higher specific power density, and longer cycling life compared to batteries.1,2 In particular, asymmetric supercapacitors (ASCs), which usually include a faradic electrode (as energy source) and a capacitive electrode (as power source) in one system, have been considered a promising strategy to increase the potential window and the energy density.3 The capacitive electrode materials generally involve various metal oxides,4–6 metal hydroxides,7,8 metal sulphides,9,10 metal carbonate hydroxides11,12 and conductive polymers.7,13 Among these materials, hausmannite (Mn3O4) has shown promising potential in the field of supercapacitors on account of its low-cost, low toxicity, environmental benignity14 and satisfactory supercapacitive performance.15–17 Compared with MnO2, Mn3O4 has much superior properties, such as uniform structure, stable performance and easily obtained pristine phase Mn3O4.18However, the direct application of pure Mn3O4 in supercapacitors is limited owing to its low electronic conductivity, low specific capacitance values and non-ideal rate performances.7 Doping of various elements such as Sn,19 Cr,2 Co2 and Ni2 into Mn3O4 compounds has been found to be effective way to promote its conductivity and capacitance. It is obvious that doping with the selective metal ions may overcome the limitations of electronic states and also generate new phenomena. Su et al.20 reported the utilization of Cu-doped δ-MnO2 as electrode material for a supercapacitor electrode, and exhibited higher capacitance and better cycle performance than that of the undoped samples. To our best knowledge, we have also not found the report on the preparation of Cu-doped Mn3O4 as electrode materials for supercapacitors.2 Moreover, the capacitive behavior of Mn3O4 electrode critically depends on its crystal structure and morphology.16 Therefore, the majority of studies on Mn3O4 electrode material for supercapacitors have focused on achieving the highest capacitance by adjusting growth conditions to obtain Mn3O4 with desirable morphologies. These morphologies include nanospheres,21 nanorods,22 nanosheets,23 and nanofibers.24 The unique bud-like morphology of Mn3O4 will be reported in this paper.
In this work, we explore the effect of Cu doping on the supercapacitor performance of Mn3O4-based electrodes, synthesized by a one-pot hydrothermal method. The effects of Cu doping on the modification of structure, surface morphology and electrochemical performance have been studied exhaustively and discussed in detail.
2. Experimental
All chemicals reagents were of analytical-reagent grade and purchased from Zhanyun Chemical Reagent Co., Ltd (Shanghai, China) without further purification. Prior to use, the fresh Ni foam was slightly etched in an ultrasonic bath with 3 M HCl to remove oxides, and then washed thoroughly with deionized water and ethanol respectively. The Mn3O4 (or Cu-doped Mn3O4) samples were obtained by thermally annealing MnCO3 (or Cu-doped MnCO3) precursors in the presence of nitrogen gas flow, and the MnCO3 (or Cu-doped MnCO3) precursor was synthesized by a modified procedure according to reference.25 Mn(CH3COO)2·4H2O (3.48 g), urea (CO(NH2)2) (5.07 g) and of NH4F (1.63 g) were dissolved one by one in 10 min interval with constant stirring in 70 mL of ethanol solution to form a homogenous solution. Doping concentration of cupric nitrate (Cu(NO3)2·6H2O) was 0, 0.5, 1, 1.5 and 2 at%, which refers to the molar ratio of Cu to Mn in the reactants. The total volume was then brought up to 350 mL with distilled water and transferred into ten 50 mL Teflon-lined autoclaves with 8 pieces of cleaned Ni foams (1 × 1 cm2 in sizes) in each autoclave. The autoclave was kept at 160 °C for 16 h in an electric oven and cooled down to room temperature. Finally, the precursors grown Ni foam were collected by washing with distilled water and ethanol, then dried in a vacuum furnace at 60 °C for 6 h and further calcined in nitrogen gas at 400 °C for 3 h. The total mass loading on nickel foam was around 2 mg cm−2 for all the five fabricated electrodes.The crystalline structures of the samples was characterized by X-ray diffraction (XRD) with use of a Smartlab-9 X-ray diffractometer with Cu Kα radiation (λ = 1.5418 Å). The microstructure and chemical composition of the Cu-doped Mn3O4 samples was characterized by scanning electron microscopy (SEM, Zeiss Supra 35VP, USA) equipped with an energy-dispersive X-ray spectroscopy (EDS). The chemical composition of the Cu-doped Mn3O4 samples was also were determined by means of an inductively-coupled plasma (ICP) mass spectrometer (ICP-AES, Horiba Jobin Yvon). Specific surface areas were measured with a Brunauer–Emmett–Teller (BET) sorptometer (SSA-4300, Beijing Builder, Inc.) using N2 adsorption at 77 K. To evaluate the electrochemical performance of the fabricated electrodes, cyclic voltammetry (CV), galvanostatic charge–discharge (GCD), and electrochemical impedance spectroscopy (EIS) measurements were conducted in a three-electrode cell in N2-saturated 1.0 M Na2SO4 aqueous solution. The electrochemical performances were recorded on a conventional CHI660E setup comprising a saturated calomel electrode (SCE) reference electrode, a counter electrode of Pt sheet, and a working electrode of Ni foam supported prepared Mn3O4-based electrode.
3. Results and discussion
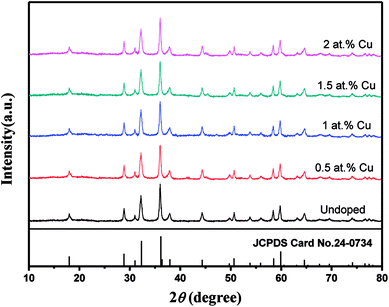
As shown in Fig. S1,† the MnCO3 and Cu-doped MnCO3 precursors with rhodochrosite structure (JCPDS card no. 44-1472) were first synthesized. Fig. 1 shows the XRD patterns of the pure Mn3O4 and Cu-doped Mn3O4 powders scraped from Ni foam. It can be seen that all samples possess similar XRD patterns and all diffraction peaks can be indexed to the hausmannite Mn3O4 (JCPDS no. 24-0734). Six dominant diffraction peaks centered at 2θ = 18.0°, 28.9°, 32.3°, 36.1°, 38.0°, and 58.5° can be attributed to the crystal planes of (101), (112), (103), (211), (004), (321), and (224), respectively. This means Cu dopant has no influence on the crystal structure of the Mn3O4. No diffraction peak corresponding to the Cu species is seen in all the samples, probably owing to the low content of Cu in the Mn3O4 sample or the uniform doping of Cu ion into the Mn3O4 nanoparticles.The Cu/Mn atomic ratios of various Cu-doped Mn3O4 were also determined by ICP spectrometer and EDS, and listed as in Table 1. The representative EDS microanalysis of 1.5 at% Cu-doped Mn3O4 is shown in Fig. 2(a), which also confirms that Cu dopants have been successfully introduced into the Mn3O4. The atomic ratio of Cu/Mn was found to be linearly proportional to the concentration of Cu in the initial reaction solution. The elemental mapping of 1.5 at% Cu-doped Mn3O4 are shown in Fig. 2(b), which intuitively shows the distribution of Mn, Cu, O. It is suggested that the Cu is uniformly distributed in the sample.
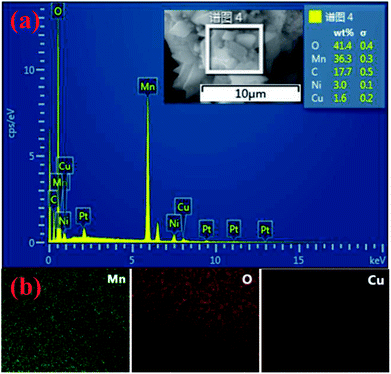 | ||
| Fig. 2 (a) Elemental mapping of Mn, Cu, and O for 1.5 at% Cu-doped Mn3O4; (b) EDS of 1.5 at% Cu-doped Mn3O4. | ||
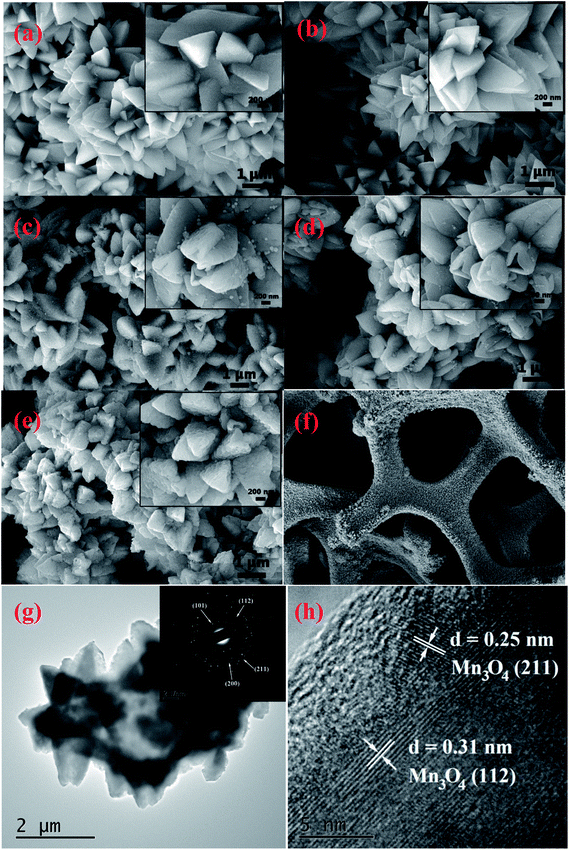
The morphologies of the samples were examined using SEM to investigate the effects of Cu doping on the nanostructure. In Fig. 3(a–e), we show the SEM images of undoped and Cu-doped Mn3O4 samples. The SEM images indicate that the Cu doping strongly affects the nanostructure of Mn3O4 sample. The insets of the SEM are the higher magnification SEM images. Fig. 3(a) shows the SEM image of the surface morphology of the undoped Mn3O4 sample. It is clearly shown that the sample consists of numerous octahedral crystals with edge lengths of nearly 1 μm. All of these crystalline grains interconnect with each other to form flower-like morphology. After 0.5 at% copper dopping, there is no obvious change in morphology. When 1 at% copper is doped into Mn3O4 sample, Fig. 3(c) indicate that a significant morphological transformation occurred. The sample shows an interesting structure composed bud-like hollow structure of Mn3O4 particles. As doping content of Cu is increased to 1.5 at%, more and more Mn3O4 grains are transformed to hollow structure. The formation of this hollow structure is assumed to take place through a self-assembly process similar to that described by Meher et al.26 in the case of MnO2. Therefore, the incorporation of Cu dopants may have a significant influence on the hausmannite Mn3O4, leading to the formation of hollow structure. However, as doping concentration of Cu reached 2 at%, the hollow morphology disappeared, and coarse grains were produced. As for the bud-like hollow structure of moderate Cu-doped Mn3O4 particles, it is assumed that the formation of micrometer sized hollow spheres is analogous to that reported previously.25,27,28 It can be explained as a fundamental solid-state phenomenon, the so-called Kirkendall effect,27,29 which deals with the movement of the interface between diffusion couples.
Fig. 3(f) shows a typical low-magnification SEM image of the 3D hierarchical structure of the 1.5 at% Cu-doped Mn3O4 grains growing on Ni foam. Obviously, the Mn3O4 grains are uniformly grown on the Ni foam substrate while completely maintaining the 3D grid structure of the pristine Ni foam. The XRD and SEM investigations confirm that although Cu dopant has no influence on the crystal structure the hausmannite Mn3O4, it indeed make apparent change in the morphological structure. The TEM image of the 1.5 at% Cu-doped Mn3O4 further confirms the hollow bud-like morphology (Fig. 3(g)). The SAED pattern (inset in Fig. 3(g)) of the 1.5 at% Cu-doped Mn3O4 shows a crystalline nature with the (1 0 1), (1 1 2), (2 0 0), and (2 1 1) planes of Mn3O4. Moreover, in the HRTEM image (Fig. 3(h)), the lattice fringes are clearly seen and matches well with d-spacing of 0.25 and 0.31 nm, corresponding to (2 1 1) and (1 1 2) planes of Mn3O4, respectively. The results are consistent with the XRD results (Fig. 1).
The specific surface area and pore parameters of undoped and Cu-doped Mn3O4 powders scraped from Ni foam were further investigated by measuring adsorption–desorption isotherms of nitrogen at 77 K. Fig. 4 illustrates the N2 adsorption/desorption isotherms and corresponding Barrett–Joyner–Halenda (BJH) adsorption pore size distribution plots (inset). According to the IUPAC classification, all these samples behave type-IV isotherms. The increase of the Cu doping concentration has a significant effect on the final textural parameters, including the surface areas and pore volume. The BET surface areas are 95.2 m2 g−1 for undoped Mn3O4, 97.8 m2 g−1 for 0.5%, 103.4 m2 g−1 for 1%, 114.5 m2 g−1 for 1.5% and 109.2 m2 g−1 for 2% Cu-doped Mn3O4, respectively. The specific pore volumes of undoped, 0.5 at%, 1 at%, 1.5 at% and 2 at% Cu-doped Mn3O4 are 248, 180, 239, 262 and 251 m3 g−1, respectively. Among the samples studied, 1.5 at% doped Mn3O4 shows the largest BET surface area and special pore volume. It is worthy of note that Cu dopant has no significant influence on the pore size of the Mn3O4 nanostructure. The pore size distribution (insets of Fig. 4) in these samples was similar, featuring pores between 2 nm and 100 nm, which mainly consisted of mesopores and macropores. These multiple mesopores pore size distribution would facilitate the electrolyte ions transfer during electrochemical charging/discharging by providing an efficient transport pathway and more adsorption sites in the interior of the electrodes,30 which is helpful to enhance specific capacitance of the electrodes.
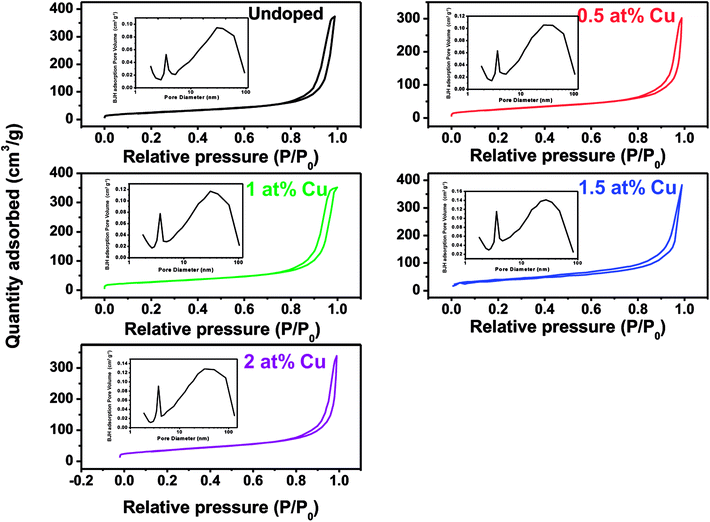 | ||
| Fig. 4 N2 adsorption/desorption isotherms of undoped and Cu-doped Mn3O4 samples (inset: BJH pore size distributions of undoped and Cu-doped Mn3O4 samples). | ||
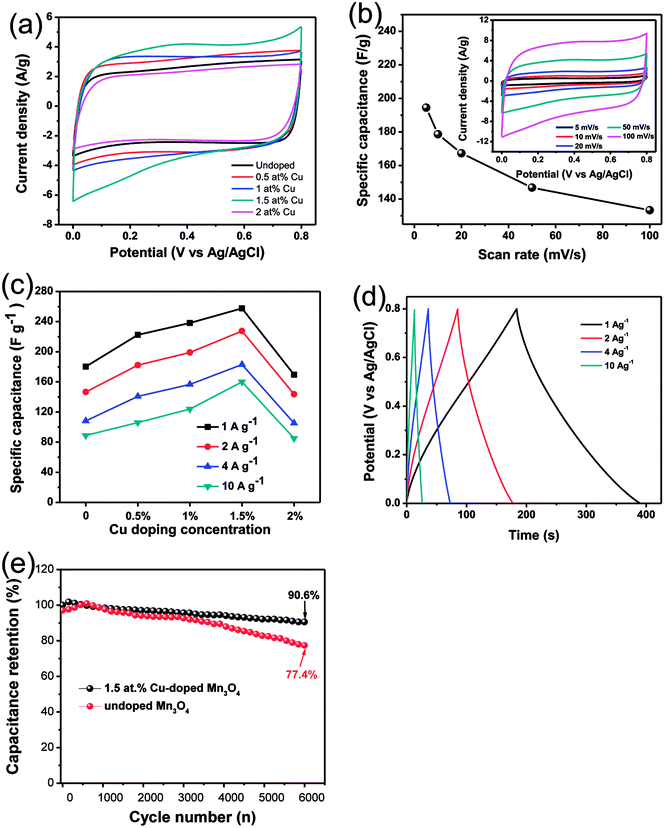
CV has been used to evaluate the electrochemical performances of Cu-doped Mn3O4-based electrodes (Fig. 5(a)). It is clearly illustrate that Cu dopant can affect the CV curve area. It is well known that the larger CV curve area is, the greater specific capacitance will be obtained.31 It can be seen that the CV curve area firstly increases and then decreases with the increase of the Cu doping concentration. It is clearly indicated that the specific capacitance of the 1.5 at% Cu-doped Mn3O4 sample is the maximum. The CV curves of 1.5 at% Cu-doped Mn3O4 sample with the scan rate ranging from 5 to 100 mV s−1 were performed in the potential window of 0 to 0.8 V, as is shown in Fig. 5(b). The CV curves at different scan rates exhibit an approximately rectangular shape, which is an indication of ideal capacitive behavior with excellent reversibility of this electrode material.32 The specific capacitance (C) was calculated from CV curves according to the following equation:33
 | (1) |
GCD experiments were carried out to test the capacitive performance of the undoped and doped Mn3O4 samples. The GCD experiments were carried out from 0 to 0.8 V with different current densities from 1 to 10 A g−1. The influence of discharge current density on the specific capacity of the undoped and doped Mn3O4 electrodes was summarized in Fig. 5(c). And Fig. 5(d) shows the representative charge–discharge curve of 1.5 at% Cu-doped Mn3O4 sample. The ideal charge–discharge characteristic and good reversibility are further confirmed by the linear and symmetric charge–discharge profiles.41 The specific capacitance of the electrode was calculated according to the following equation:
 | (2) |
The cycle stability is a crucial parameter for fast energy storage device. The cycle stability tests of the 1.5 at% Cu-doped Mn3O4 sample was performed at the current density of 2 A g−1 for 6000 times, with undoped Mn3O4 electrode as reference, as shown in Fig. 5(e). For the 1.5 at% Cu-doped Mn3O4 sample, it is worth noting that the two curves present a short-termed increase of specific capacitance in the initial hundreds cycles due to an improvement in the surface wetting of the electrode by the electrolyte during extended cycling.42 After 6000 charge–discharge cycles, 1.5 at% Cu-doped Mn3O4 electrode materials show 90.6% of capacitance retention. For undoped Mn3O4, the specific capacitance presents a slight increase in the initial 750 cycles and thereafter decreased gradually, just 77.4% of initial capacitance can be maintained after 6000 cycles. The results proved that Cu-doped Mn3O4 materials can be served as promising electrode materials for supercapacitors.
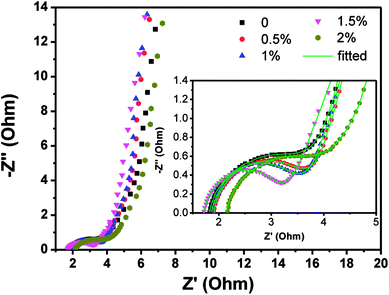
The EIS analyses were carried out using an AC voltage of 5 mV in a frequency range from 0.01 Hz to 100 kHz to better understand the electrochemical properties of undoped and Cu-doped Mn3O4 samples. Fig. 6 shows the Nyquist plots for all samples, two regions of distinct electrochemical response can be seen. At high frequency region, a distorted semicircle is observed; at low frequency, the response is indicative of diffusion process represented by a straight line. It is well known that the power output capability of electrochemical capacitors depends largely upon the equivalent series resistance (ESR).43 The ESR, related with the electrode material's conductivity, has been estimated from the X-intercept of the Nyquist plot.26,44 The ESR values of undoped, 0.5 at%, 1 at%, 1.5 at% and 2 at% Cu-doped Mn3O4 sample were found to be 1.95, 1.71, 1.62, 1.49 and 1.90 Ω, respectively. The ESR value of samples firstly decreases and then increases with increasing Cu dopant content is clearly observed. The 1.5 at% Cu-doped Mn3O4 sample exhibits the lowest ESR, which suggested that the electrode has an easy access to ions for the intercalation and deintercalation.45 The straight sloping line at low frequency represents the diffusion of ions in the electrode material, and the slopes of these straight sloping lines are different. It was observed that the Nyquist plots of the 1.5 at% Cu doped Mn3O4 sample displays more steeply rising behavior in the low frequency region as compared to the other samples, which demonstrates that its capacitive performance is much closer to an ideal supercapacitor. Therefore, the highest specific capacitance of the 1.5 at% Cu-doped Mn3O4 sample can be attributed to the minimum ESR. The above results suggest that the 1.5 at% Cu-doped Mn3O4 sample is a better candidate for supercapacitor application, as it has been already confirmed by the CV and GCD results.
To study the capacitive performance for practical application, the asymmetric supercapacitor (ASC) device was fabricated by 1.5 at% Cu-doped Mn3O4 sample as the positive electrode, graphene (G) coated Ni foams as the negative electrode, polytetrafluoroethylene (PTFE) membrane separator and 1 M Na2SO4 aqueous solution as the electrolyte. This assembled ASC was denoted as Mn3O4 (1.5Cu)//G. To obtain the maximum performance of the Mn3O4 (1.5Cu)//G ASC, it is crucial to keep the charges balanceable with the relationship q+ = q−. In order to get the charge balanceable, the optimum loading mass of AC was decided by the following equation:
| m(Mn3O4(1.5Cu))/m(G) = Cm(G)ΔV(G)/Cm(Mn3O4(1.5Cu))ΔV(Mn3O4(1.5Cu)) | (3) |
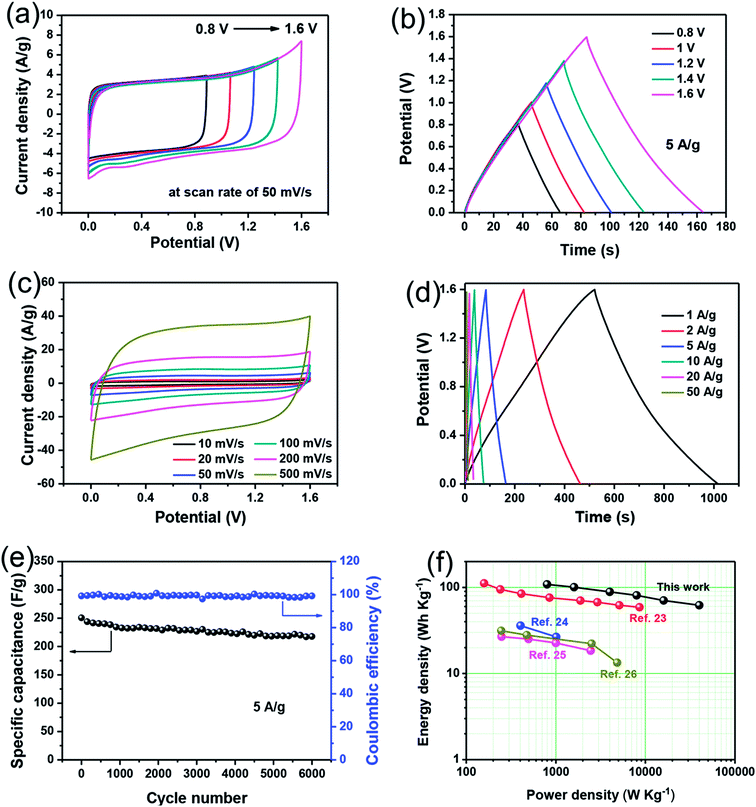
Long-term cycling performance is also one of important factors for supercapacitor applications. The cycling stability of the 1.5 at% Cu-doped Mn3O4//G ASC is evaluated by the repeated charging/discharging measurement at a constant current densities of 5 A g−1 between 0 and 1.6 V. As shown in Fig. 7(e), the specific capacitance of the device decreases gradually with increasing cycling times, and still retains 86.9% of the initial specific capacitance even after 6000 cycles. Meanwhile, its coulombic efficiency maintained high values over 99% at the whole cycles. These results suggest that the 1.5 at% Cu-doped Mn3O4//G ASC delivers good electrochemical stability. Moreover, to evaluate the energy storage ability of the 1.5 at% Cu-doped Mn3O4//G ASC, the Ragone plots based on the galvanostatic discharge curves are displayed in Fig. 7(f). The energy and power density of the ASC devices were calculated based on these equations:47
| E = CmΔV2/2 | (4) |
| P = E/Δt | (5) |
![[thin space (1/6-em)]](https://www.rsc.org/images/entities/char_2009.gif) 993.8 W kg−1, which is superior to many previously reported Mn3O4-based ASCs, such as such as Mn3O4/rGO//GO ASC,48 Mn3O4/AC based ASC,49 Mn3O4/rGO nanocomposite based ASC,50 and Mn3O4–GO double-shell hollow sphere based ASC.51 The superior energy density of the fabricated 1.5 at% Cu-doped Mn3O4//G ASC device can be attributed to its high specific capacitance and wide potential window. Therefore the 1.5 at% Cu-doped Mn3O4 could be a promising electrode material for a high performance supercapacitor.
993.8 W kg−1, which is superior to many previously reported Mn3O4-based ASCs, such as such as Mn3O4/rGO//GO ASC,48 Mn3O4/AC based ASC,49 Mn3O4/rGO nanocomposite based ASC,50 and Mn3O4–GO double-shell hollow sphere based ASC.51 The superior energy density of the fabricated 1.5 at% Cu-doped Mn3O4//G ASC device can be attributed to its high specific capacitance and wide potential window. Therefore the 1.5 at% Cu-doped Mn3O4 could be a promising electrode material for a high performance supercapacitor.
4. Conclusion
In summary, we have successfully fabricated hierarchical Cu-doped Mn3O4 hollow nanostructures on Ni foam by a simple hydrothermal method. The existence of Cu can not only induce the formation of the unique bud-like hollow nanostructure, but also effectively increase the conductivity of the electrode. It was found that Cu doping plays a promotional role in enhancing Mn3O4 behavior in electrochemical capacitors. Electrochemical test confirms that 1.5 at% Cu-doped Mn3O4 could achieve a high specific capacitance (257.6 F g−1 at 1 A g−1) and long-term cycling stability (90.6% capacitance retention after 6000 times repetition at current density of 2 A g−1), holding a promise to be applied in high-performance asymmetric supercapacitor. Meanwhile, a 1.5 at% Cu-doped Mn3O4//G ASC is further fabricated and exhibits a good electrochemical performance with high specific capacitance, excellent long-term cycling stability, and good electrochemical reversibility of the faradaic reaction. As a result, the obtained bud-like Cu-doped Mn3O4 can be a promising electrode material for future energy storage devices.Conflicts of interest
The authors declare no conflict of interest.Acknowledgements
This work was supported by the National Natural Science Foundation of China (Grant No. 11747001), the QingLan project of Jiangsu Province, the Key Applied Basic Research Program of Yunnan Province (Grant No. 2017FA024) and Program for Innovative Research Team (in Science and Technology) in University of Yunnan Province.References
- H. Chen, J. Jiang, L. Zhang, D. Xia, Y. Zhao, D. Guo, T. Qi and H. Wan, J. Power Sources, 2014, 254, 249–257 CrossRef CAS.
- R. Dong, Q. Ye, L. Kuang, X. Lu, Y. Zhang, X. Zhang, G. Tan, Y. Wen and F. Wang, ACS Appl. Mater. Interfaces, 2013, 5, 9508–9516 CrossRef CAS PubMed.
- Z. S. Wu, W. Ren, D. W. Wang, F. Li, B. Liu and H. M. Cheng, ACS Nano, 2010, 4, 5835 CrossRef CAS PubMed.
- S. Stankovich, D. A. Dikin, G. H. Dommett, K. M. Kohlhaas, E. J. Zimney, E. A. Stach, R. D. Piner, S. T. Nguyen and R. S. Ruoff, Nature, 2006, 442, 282–286 CrossRef CAS PubMed.
- S. Liu, K. S. Hui and K. N. Hui, ACS Appl. Mater. Interfaces, 2016, 8, 3258–3267 CrossRef CAS PubMed.
- S. Liu, K. San Hui, K. N. Hui, J. M. Yun and K. H. Kim, J. Mater. Chem. A, 2016, 4, 8061–8071 RSC.
- H. Du, L. Jiao, K. Cao, Y. Wang and H. Yuan, ACS Appl. Mater. Interfaces, 2013, 5, 6643–6648 CrossRef CAS PubMed.
- L. Wang, Z. H. Dong, Z. G. Wang, F. X. Zhang and J. Jin, Adv. Funct. Mater., 2013, 23, 2758–2764 CrossRef CAS.
- L. Niu, J. Wang, W. Hong, J. Sun, Z. Fan, X. Ye, H. Wang and S. Yang, Electrochim. Acta, 2014, 123, 560–568 CrossRef CAS.
- H. Chen, J. Jiang, L. Zhang, H. Wan, T. Qi and D. Xia, Nanoscale, 2013, 5, 8879–8883 RSC.
- S. Liu, K. S. Hui, K. N. Hui, V. V. Jadhav, Q. X. Xia, J. M. Yun, Y. R. Cho, R. S. Mane and K. H. Kim, Electrochim. Acta, 2016, 188, 898–908 CrossRef CAS.
- D. Lee, Q. X. Xia, J. M. Yun and K. H. Kim, Appl. Surf. Sci., 2018, 433, 16–26 CrossRef CAS.
- H. Chen, J. Jiang, L. Zhang, H. Wan, T. Qi and D. Xia, Nanoscale, 2013, 5, 8879–8883 RSC.
- Y. Xiao, Y. Cao, Y. Gong, A. Zhang, J. Zhao, S. Fang, D. Jia and F. Li, J. Power Sources, 2014, 246, 926–933 CrossRef CAS.
- Y. Hu, C. Guan, G. Feng, Q. Ke, X. Huang and J. Wang, Adv. Funct. Mater., 2016, 25, 7291–7299 CrossRef.
- Y. Qiao, Q. Sun, J. Xi, H. Cui, Y. Tang and X. Wang, J. Alloys Compd., 2016, 660, 416–422 CrossRef CAS.
- K. M. Anilkumar, M. Manoj, B. Jinisha, V. S. Pradeep and S. Jayalekshmi, Electrochim. Acta, 2017, 236, 424–433 CrossRef CAS.
- B. G. S. Raj, R. N. R. Ramprasad, A. M. Asiri, J. J. Wu and S. Anandan, Electrochim. Acta, 2015, 156, 127 CrossRef CAS.
- Y. Zhao, W. Ran, D. B. Xiong, L. Zhang, J. Xu and F. Gao, Mater. Lett., 2014, 118, 80–83 CrossRef CAS.
- X. Su, Y. Lin, C. Gao, H. Zhang, M. Sun, L. Zhang and J. Zhang, Appl. Energy, 2014, 134, 439–445 CrossRef CAS.
- C. C. Hu, C. Y. Hung, K. H. Chang and Y. L. Yang, J. Power Sources, 2011, 196, 847–850 CrossRef CAS.
- M. Aghazadeh, A. Bahrami-Samani, D. Gharailou, M. G. Maragheh, M. R. Ganjali and P. Norouzi, J. Mater. Sci.: Mater. Electron., 2016, 27, 8623–8632 CrossRef CAS.
- H. U. Shah, F. Wang, M. S. Javed, N. Shaheen, S. Ali, M. A. Ahmad and K. He, Mater. Lett., 2017, 210, 148–152 CrossRef.
- J. Bhagwan, A. Sahoo, K. L. Yadav and Y. Sharma, Electrochim. Acta, 2015, 174, 992–1001 CrossRef CAS.
- Q. Li, L. Yin, Z. Li, X. Wang, Y. Qi and J. Ma, ACS Appl. Mater. Interfaces, 2013, 5, 10975–10984 CrossRef CAS PubMed.
- S. K. Meher and G. R. Rao, J. Power Sources, 2012, 215, 317–328 CrossRef CAS.
- H. Z. Zeng, J. Mater. Chem., 2006, 16, 649–662 RSC.
- K. N. Tu and U. Gösele, Appl. Phys. Lett., 2005, 86, 093111 CrossRef.
- J. Li, S. Xiong, X. Li and Y. J. Qian, Mater. Chem., 2012, 22, 23254–23259 RSC.
- H. W. Park, B. K. Na, B. W. Cho, S. M. Park and K. C. Roh, Phys. Chem. Chem. Phys., 2013, 15, 17626 RSC.
- M. T. Lee, J. K. Chang and W. T. Tsai, J. Electrochem. Soc., 2007, 154, A875–A881 CrossRef CAS.
- M. Lee, S. K. Balasingam, H. Y. Jeong, W. G. Hong, B. H. Kim and Y. Jun, Sci. Rep., 2015, 5, 8151 CrossRef CAS PubMed.
- K. Liang, X. Z. Tang and W. C. Hu, J. Mater. Chem., 2012, 22, 11062–11067 RSC.
- Y. Zhou, L. Guo, W. Shi, X. Zou, B. Xiang and S. Xing, Materials, 2018, 11, 881 CrossRef PubMed.
- J. W. Lee, A. S. Hall, J. D. Kim and T. E. Mallouk, Chem. Mater., 2012, 24, 1158–1164 CrossRef CAS.
- Y. Tian, D. Li, J. Liu, H. Wang, J. Zhang, Y. Zheng, T. Liu and S. Hou, Electrochim. Acta, 2017, 257, 155–164 CrossRef CAS.
- G. M. An, P. Yu, M. J. Xiao, Z. M. Liu, Z. J. Miao, K. L. Ding and L. Q. Mao, Nanotechnology, 2008, 19, 275709 CrossRef PubMed.
- Z. Rogulski, H. Siwek, I. Paleska and A. Czerwinski, J. Electroanal. Chem., 2003, 543, 175 CrossRef CAS.
- M. Q. Wu, G. A. Snook, G. Z. Chen and D. J. Fray, Electrochem. Commun., 2004, 6, 499 CrossRef CAS.
- J. S. Shaikh, R. C. Pawar, R. S. Devan, Y. R. Ma, P. P. Salvi, S. S. Kolekar and P. S. Patil, Electrochim. Acta, 2011, 56, 2127–2134 CrossRef CAS.
- S. Zhao, T. Liu, D. Hou, W. Zeng, B. Miao, S. Hussain, X. Peng and M. S. Javed, Appl. Surf. Sci., 2015, 356, 259–265 CrossRef CAS.
- J. Yan, Z. Fan, S. Wei, G. Ning, W. Tong, Z. Qiang, R. Zhang, L. Zhi and W. Fei, Adv. Funct. Mater., 2012, 22, 2632–2641 CrossRef CAS.
- Q. T. Qu, B. Wang, L. C. Yang, Y. Shi, S. Tian and Y. P. Wu, Electrochem. Commun., 2008, 10, 1652–1655 CrossRef CAS.
- D. Han, P. Xu, X. Jing, J. Wang, D. Song, J. Liu and M. Zhang, J. Solid State Chem., 2013, 203, 60–67 CrossRef CAS.
- M. Cakici, R. R. Kakarla and F. Alonso-Marroquin, Chem. Eng. J., 2017, 309, 151–158 CrossRef CAS.
- A. Alabadi, S. Razzaque, Z. Dong, W. Wang and B. Tan, J. Power Sources, 2016, 306, 241–247 CrossRef CAS.
- M. Pang, G. Long, J. Shang, J. Yuan, H. Wei, B. Wang, X. Liu, Y. Xi, D. Wang and F. Xu, Chem. Eng. J., 2015, 280, 377–384 CrossRef CAS.
- M. Gao, X. Wu, H. Qiu, Q. Zhang, K. Huang, S. Feng, Y. Yang, T. Wang, B. Zhao and Z. Liu, RSC Adv., 2018, 8, 20661–20668 RSC.
- S. Nagamuthu, S. Vijayakumar and G. Muralidharan, Energy Fuels, 2013, 27, 3508–3515 CrossRef CAS.
- Y. Wang, Z. Ji, X. Shen, K. Xu and A. Yuan, J. Alloys Compd., 2016, 684, 366–371 CrossRef CAS.
- C. Zhang, L. Wang, Y. Zhao, Y. Tian and J. Liang, Carbon, 2016, 107, 100–108 CrossRef CAS.
Footnote |
| † Electronic supplementary information (ESI) available. See DOI: 10.1039/c8ra06989a |
| This journal is © The Royal Society of Chemistry 2018 |

