 Open Access Article
Sensitive fluorescent assay for copper(II) determination in aqueous solution using quercetin–cyclodextrin inclusion†
Shilong Yang ab,
Weina Jiangbc,
Ying Tangad,
Li Xu
 *be,
Buhong Gaoa and
Haijun Xu*c
aAdvanced Analysis and Testing Center, Nanjing Forestry University, Nanjing, 210037, China
bCo-Innovation Center for Sustainable Forestry in Southern China, Nanjing Forestry University, 210037, China. E-mail: xuliqby@njfu.edu.cn
cCollege of Chemical Engineering, Nanjing Forestry University, 210037, China
dCollege of Forestry, Nanjing Forestry University, Nanjing, 210037, China
eCollege of Science, Nanjing Forestry University, Nanjing, 210037, China
First published on 13th November 2018
Abstract
Environmentally friendly probe materials for detecting copper ions were studied in this research. Fluorescent emission of quercetin (Q) was observed in the buffer solution (pH = 7.40), and (2-hydroxypropyl)-β-cyclodextrin (CD) could enhance the fluorescence intensity of Q. The UV/Vis spectrum showed that the Q-CD system was formed. After adding copper ions into the Q-CD system, the fluorescent emission intensity of Q-CD system generated quenching, and other metal ions could not bring change, which meant the Q-CD system showed good selectivity to copper ions. The fluorescence titration spectra showed that the concentration of copper ions was inversely proportional to fluorescence intensity, and gave a good linear change in fluorescence emission intensity in response to the concentration of copper ions ranging from 5.0 × 10⁻⁸ to 8.3 × 10⁻⁶ mol L−1. The calibration curve of the relationship between the intensity and copper ions concentration was y = −9.24x + 844.51 (R2 = 0.997). The detection limit of copper ions was measured to be 2.3 × 10⁻⁸ mol L−1. The probable mechanism was studied by UV/Vis spectrum and Job's plot method. The results indicated that Q-CD-Cu(II) complex was formed and intramolecular charge transfer (ICT) took place. At last, the probe was successfully applied for determination of copper ions in water bodies, vegetables and fruits with good recovery. The study showed that Q-CD system could detect copper ions as a fluorescent probe with high selectivity, sensitivity and larger linearity range.
1. Introduction
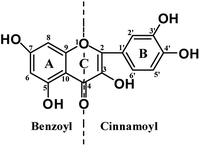
As one of essential trace elements in living organisms, copper ions participate in many biological processes, such as various redox processes, enzyme functions, and so on.1 However, excessive amounts of copper ions in bodies could cause a series of diseases, such as Menkes syndrome, Wilson's disease, familial amyotrophic lateral sclerosis, prion diseases and Alzheimer's disease.2–4 With the development of the industrialization, more and more copper ions from electrical and electronics industries, mining industry, electroplating industry, etc. are being released into environment, which directly influences humans' health. Thus, it is very important to detect copper ions in the environment. Up to now, numerous analytical methods have been studied to detect copper ions, including atomic absorption spectroscopy (AAS), inductively coupled plasma mass spectroscopy (ICP-MS), inductively coupled plasma atomic emission spectroscopy (ICP-AES), electrochemical assays, colorimetric methods and fluorescent probes.5–10 Methods such as AAS, ICP-MS and ICP-AES can detect copper ion with high sensitivity and selectivity but with requirements of large instruments. Compared with other methods, fluorescent probes possess many more advantages, for instance high sensitivity, real-time detection, low cost, and simplicity for implementation. As a consequence, much more attention has been given to fluorescent probes. In recent years, significant emphasis has been placed on the development of new, highly selective fluorescent sensors for copper ions. Thousands of fluorescent sensors for copper ions have been reported.11–15 But the majority of the fluorescent probes are synthesized by organic reaction with some toxic reagents and cumbersome process, only few fluorescent probes come directly from natural products. It is reported that quercetin, biochanin A and isorhamnetin could act as fluorescent probes for detecting copper ions with good selectivity and high sensitivity.16–18 However, the fluorescence intensity of flavonoids is low, which would limit the linearity range for detecting copper ions. In recent years, more and more methods have been developed to improve the fluorescence intensity of fluorescent probes. For example, nucleic acids could enhance the fluorescence intensity of quercetin,19 and silver nanoparticles could help to enhance the fluorescence intensity of the quercetin and nucleic acids system.20 It is reported that the fluorescence intensity of berberine in aqueous medium was greatly enhanced by (2-hydroxypropyl)-β-cyclodextrin (CD).21 In addition, quantum dots, metal ions, surfactants etc. were also used to enhance the fluorescence intensity of some compounds.22–25 Among these, water-soluble CD possesses good biological compatibility and lower toxicity, so CD has good application prospect.Quercetin (Q, Scheme 1) is a natural product widely present in most plants and belongs to flavonoid with good biological activity. Our previous research showed Q could act as fluorescent probes for detecting copper ions, but the fluorescence intensity of Q was low, and the ferrous ions could affect the recognition process of copper ions.16 While in this study, it was amazedly found that CD could greatly enhance the fluorescence intensity of Q in the CH3OH–PBS buffer solution (1![[thin space (1/6-em)]](https://www.rsc.org/images/entities/char_2009.gif) :
:![[thin space (1/6-em)]](https://www.rsc.org/images/entities/char_2009.gif) 99, v/v, pH = 7.40), and the Q-CD system could act as a fluorescent probe for detecting copper ions with high selectivity, sensitivity and larger linearity range. The Q-CD system was obtained by mixing two solutions directly and interacted with each other by supramolecular action without chemical reaction. At last, the content of copper ions in water bodies, vegetables and fruits was measured by the Q-CD system.
99, v/v, pH = 7.40), and the Q-CD system could act as a fluorescent probe for detecting copper ions with high selectivity, sensitivity and larger linearity range. The Q-CD system was obtained by mixing two solutions directly and interacted with each other by supramolecular action without chemical reaction. At last, the content of copper ions in water bodies, vegetables and fruits was measured by the Q-CD system.
2. Results and discussion
2.1 The influence of CD on fluorescent intensity of Q
To study the influence of CD content on the fluorescence emission intensity of Q, various contents of CD were added, and the fluorescence emission spectra of Q were obtained (Fig. 1). In the Fig. 1, it clearly found that Q had a fluorescence emission peak at 543 nm, and CD didn't show any fluorescence emission peak from 500 nm to 700 nm. When adding the CD into Q, the fluorescence emission intensity of Q became stronger with the increasing of CD, at the same time fluorescence emission peak at 543 nm was shifted to 553 nm. When the mass ratio of Q to CD was 1![[thin space (1/6-em)]](https://www.rsc.org/images/entities/char_2009.gif) :
:![[thin space (1/6-em)]](https://www.rsc.org/images/entities/char_2009.gif) 900, the increasing trend became flat. Thus the mass ratio 1
900, the increasing trend became flat. Thus the mass ratio 1![[thin space (1/6-em)]](https://www.rsc.org/images/entities/char_2009.gif) :
:![[thin space (1/6-em)]](https://www.rsc.org/images/entities/char_2009.gif) 900 was decided to be one of experimental conditions in this study.
900 was decided to be one of experimental conditions in this study.
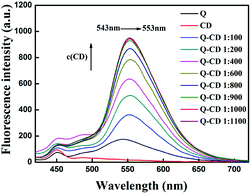 | ||
| Fig. 1 The effect of CD on the fluorescence intensity of Q in CH3OH–PBS buffer solution ([Q] = 1.0 × 10⁻⁵ mol L−1). | ||
The fluorescence emission intensity, maximum emission peak and stability of Q had changed when adding CD, which meant the interaction between Q and CD had taken place. To understand the interaction, UV/Vis spectra, 1H NMR spectra and FT-IR spectra had been studied. In the UV/Vis spectra (Fig. 2), Q had two major absorption bands at 375 nm (band I) and 260 nm (band II), which were characteristic absorptions of flavonoids related to B-ring cinnamoyl system and A-ring benzoyl system, respectively.26 CD had no obvious absorption peak from 220 nm to 600 nm. When adding CD into Q, the absorbance of Q at 327 nm increased, the absorbance of Q at 375 nm decreased and was shifted to 379 nm. These phenomena indicated that Q had interacted with CD, and the Q-CD system formed.
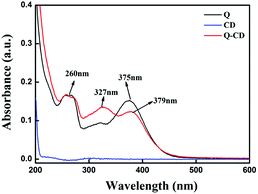 | ||
| Fig. 2 The effect of CD on the UV/Vis absorption spectra of Q in CH3OH–PBS buffer solution ([Q] = 1.0 × 10⁻⁵ mol L−1). | ||
The 1H NMR spectra of CD, Q and Q-CD system were showed as Fig. S1–S3.† The chemical shifts of Q-CD system had obvious change comparing with that of Q (shown in Table S1†). The chemical shifts of 7-OH, 3-OH, 4′-OH and 3′-OH almost disappeared in Q-CD system, at the same time, the chemical shifts of 5-OH and 2′-H and 6′-H shifted to high field, the chemical shifts of 5′-H, 8-H and 6-H shifted to low field. In Q-CD system, Q entered into CD's hydrophobic cavity which interdicted hydrogen-bond interaction between Q and DMSO. So, strong and sharp peaks of four hydroxyl groups in Q were almost gone in Q-CD system. Meanwhile, the chemical shifts of other H of Q also changed slightly under influence by CD. The peak of 5-OH in Q-CD system could still be seen clear although it became weak, which might due to intramolecular hydrogen bonds. These results suggested that Q-CD system is inclusion complex.
The FT-IR spectrum of CD, Q and Q-CD system were showed in Fig. S4 and S5.† The band at 1667 cm−1 for Q, due to carbonyl, disappeared in Q-CD system, which implied that Q had got into CD's cavity.
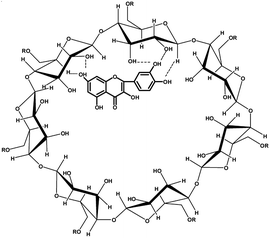
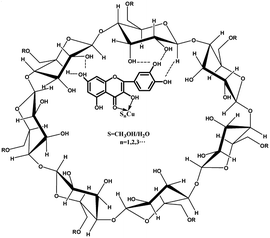
The further experiments showed that the fluorescence emission intensity of Q-CD system showed almost no change within 12 h, however that of Q changed obviously within 5 h (Fig. S6†), which indicated the stability of Q-CD system was higher than that of Q. The better stability of Q-CD system would improve the experimental accuracy and reproducibility. CD is cyclic oligosaccharides with cavity structures, and Q would be limited in the cavity and interacted with CD by weak hydrogen bond and hydrophobic interaction.27–29 The molecular mobility and collisions of Q molecules were limited by the formation of inclusion complexes, which prevented the transmission of energy among Q molecules. As a result, the fluorescence emission intensity and stability were increased as adding CD.30 The most probable structures of Q-CD system was showed as Scheme 2.
2.2 Selectivity of the detection system
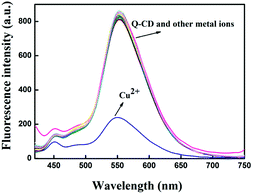
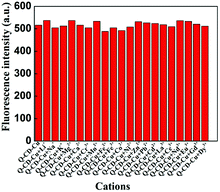
To investigate the selectivity of Q-CD system on different metal ions, each kind of metal ions (Li+, Na+, K+, Mg2+, Ca2+, Cr3+, Mn2+, Fe2+, Fe3+, Co2+, Ni2+, Cu2+, Zn2+, Pb2+, Cd2+, La3+, Ce3+, Nd3+, Eu3+, Gd3+, Dy3+) was added into Q-CD system, respectively. The results were showed in the Fig. 3. When adding Cu2+ into Q-CD system, the fluorescence emission intensity decreased sharply. None of the other metal ions generated obvious influence on fluorescence signals, even at higher concentrations. Fe2+ induced interference for Q as probe to recognize Cu2+, while for the Q-CD system, Fe2+ did not affect the sensing process (Fig. S7†), which indicated Q-CD system could recognize Cu2+ with better selectivity than Q.To study the influence of the other metal ions on the recognition of Q-CD system to Cu2+, each of the other metal ions was added into Q-CD-Cu(II) system, respectively. The results were showed in the Fig. 4. The fluorescence emission intensity of Q-CD-Cu(II) system varied only slightly when adding the other metal ions, which suggested that the recognition process of Cu2+ was hardly influenced by other metal ions. That is, Q-CD system had high selectivity on sensing Cu2+.
2.3 Sensitivity of the detection system
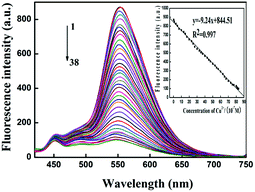
To obtain quantitative relation of Q-CD system on sensing Cu2+, the fluorescence titration experiments were carried out (Fig. 5). It was obviously to find that the fluorescence emission intensity at 553 nm gradually decreased with the Cu2+ concentration increased. The fluorescence emission intensity was inversely proportional to Cu2+ concentration ranging from 5.0 × 10⁻⁸ to 8.3 × 10⁻⁶ mol L−1. The calibration curve of the quantitative relationship between the fluorescence emission intensity and Cu2+ concentration was y = −9.24x + 844.51 (R2 = 0.997). The detection limit of Cu2+ was 2.3 × 10⁻⁸ mol L−1,31 which was lower than that of many other sensors for Cu2+, and the linearity range was larger (Table S2†). The reproducibility of the probe was good (Table S3†). These results indicated Q-CD system had good sensitivity on Cu2+ and the standard curve with good linearity could be used to quantify.2.4 Proposed mechanism
During detecting Cu2+ with Q-CD system as fluorescent probe, fluorescence quenching occurred, which meant Cu2+ interacted with Q-CD system. Combining with previous research results,4,17 Q-CD-Cu(II) complex may be formed in the buffer solution. In order to study the structure of Q-CD-Cu(II) complex, UV-visible spectra, FT-IR spectra and Job's plots experiments were carried out.As mentioned, the UV-visible spectrum of CD had no obvious absorption peak from 220 nm to 600 nm. When adding Cu2+ into CD, the UV-visible spectrum had no obvious change (Fig. S8†). The UV-visible spectra of Q-CD system were shown in Fig. 6. The UV-visible spectrum of Q-CD system in buffer solution showed three major absorption bands at 379 nm (band I), 327 nm and 260 nm. In comparison with Q-CD system absorption spectrum, when Cu2+ added, band I was shifted to 430 nm, which was a characteristic of the formation of the Q-CD-Cu(II) complex. At the same time, the colour of the solution was changed into dark yellow during the coordination reaction (Fig. S9†). Such bathochromic shift can be explained by the extension of the conjugated system. While adding the other ions, the UV-visible absorption spectra of Q-CD system had no obvious change (Fig. S10†), the UV-visible spectra were similar, just like the red line in Fig. 6. The FT-IR spectra of Q-CD and Q-CD-Cu(II) were studied in Fig. S11 and S12.† The main change in the spectra was the shift of C![[double bond, length as m-dash]](https://www.rsc.org/images/entities/char_e001.gif) O. The C
O. The C![[double bond, length as m-dash]](https://www.rsc.org/images/entities/char_e001.gif) O stretching mode of Q-CD system was 1654 cm−1, when adding Cu2+ into the Q-CD system, the νC
O stretching mode of Q-CD system was 1654 cm−1, when adding Cu2+ into the Q-CD system, the νC![[double bond, length as m-dash]](https://www.rsc.org/images/entities/char_e001.gif) O was shifted to 1639 cm−1, which was a characteristic of coordination of C
O was shifted to 1639 cm−1, which was a characteristic of coordination of C![[double bond, length as m-dash]](https://www.rsc.org/images/entities/char_e001.gif) O and Cu2+, which suggested the Q-CD-Cu(II) complex formed.
O and Cu2+, which suggested the Q-CD-Cu(II) complex formed.
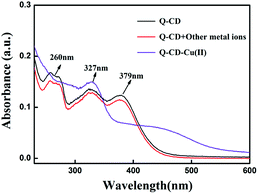 | ||
| Fig. 6 The influence of different cations on UV/Vis absorption spectra of Q-CD system in CH3OH–PBS buffer solution. | ||
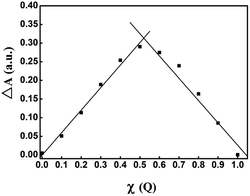
In order to detect the stoichiometric ratio of Cu2+ and Q in Q-CD-Cu(II) complex, Job's plots experiments were done. In order to avoid the influence of absorbance band at 379 nm and 430 nm, the absorption band at 458 nm was chosen for Job's plots curves. The absorbance plots at 458 nm against the molar fraction of Q (χ) have maximum absorbance at χ = 0.52, confirming that the stoichiometric ratio for the complex of Q and Cu2+ was 1![[thin space (1/6-em)]](https://www.rsc.org/images/entities/char_2009.gif) :
:![[thin space (1/6-em)]](https://www.rsc.org/images/entities/char_2009.gif) 1 (Fig. 7). The stability constant (K) of the complex was calculated to be 1.05 × 10⁷, which meant that the stability of Q-CD-Cu(II) complex was very high.
1 (Fig. 7). The stability constant (K) of the complex was calculated to be 1.05 × 10⁷, which meant that the stability of Q-CD-Cu(II) complex was very high.
The UV-visible spectra showed that absorption band at 379 nm was shifted to 430 nm when the Q-CD-Cu(II) complex formed, which indicated the B-ring cinnamoyl system participated in the reaction with Cu2+. As the 3-hydroxy group had a more acidic proton, therefore the 3-hydroxy and 4-carbonyl groups were the first sites to be involved in the complexation process. On the basis of the reports32–34 and our previous researches, the most probable coordination site was between 3-hydroxyl and 4-carbonyl of Q, and the most probable structure of Q-CD-Cu(II) complex was showed as Scheme 3.
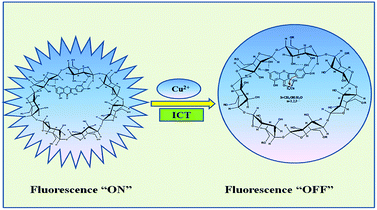
When Cu2+ meet Q-CD system, Q-CD-Cu(II) complex formed, and intramolecular charge transfer (ICT) occurs due to the extension of the conjugated system, subsequently, fluorescence quenching of Q-CD system took place (Scheme 4), which was similar to biochanin A.17
2.5 Detecting Cu2+ in real samples
To demonstrate the feasibility of the probe Q-CD system, we applied this method for detecting Cu2+ in vegetables, fruits, rivers and lakes. The results were obtained by Q-CD system probe and ICP-AES or AAS, respectively (Table 1 and 2). Compared with ICP-AES/AAS method, the results obtained by the Q-CD system probe were also accurate and had good recovery, which proved this method could be used to detect Cu2+ quantitatively.| Samples | Found (ppm) | AAS (ppm) | RSD (%) | Recovery (%) |
|---|---|---|---|---|
| Potato | 0.726 ± 0.015 | 0.781 | 2.00 | 92.99 |
| Tomato | 0.525 ± 0.006 | 0.493 | 1.22 | 106.57 |
| Watermelon | 0.222 ± 0.003 | 0.223 | 1.38 | 99.49 |
| Apple | 0.673 ± 0.007 | 0.651 | 1.18 | 103.45 |
| Samples | Found/c × 108/mol L−1 | ICP-AES/c × 108/mol L−1 | RSD/% | Recovery/% |
|---|---|---|---|---|
| The Shuhe river | 6.479 ± 0.083 | 6.398 | 1.28 | 101.27 |
| The Xiuzhen river | 3.432 ± 0.058 | 3.512 | 1.70 | 97.71 |
| The Grand Canal | 4.623 ± 0.074 | 4.439 | 1.61 | 104.15 |
| The Baima Lake | 7.237 ± 0.074 | 6.928 | 1.02 | 104.46 |
3. Experimental
3.1 Chemicals and instruments
All reagents and solvents were of analytical reagent grade and used without further purification unless otherwise noted. MeOH was chromatographic grade and produced by TEDIA (America). CD was purchased from Sinopharm Chemical Reagent Co., Ltd. (China). Q was extracted from Ginkgo biloba leaves which were collected from Nanjing Forestry University. Phosphate Buffer Solution (PBS) was purchased from Beijing Solarbio Science & Technology Co., Ltd. All solutions were freshly prepared using ultrapure water before experiments and used immediately.PerkinElmer LS55 spectrophotometer was employed to record the fluorescence spectra, and excitation wavelength was 390 nm for all measurements. UV-visible absorption spectra were performed on a PerkinElmer Lambda 950 spectrophotometer. FT-IR spectra were obtained on a Bruker VERTEX 80V. The purified Q was obtained from Waters 1525 HPLC equipped with 2489 UV/Visible Detector, Fraction Collector III and 2707 Autosampler. 1H NMR spectra were performed on a Bruker AVANCE III HD 600/500 spectrometer and ESI-MS on a Thermo Fisher Scientific LTQ Orbitrap XL™. As a comparison, LEEMAN LABS INC. Prodigy ICP-AES or AA900T AAS were also employed to measure the amount of copper ions in samples.
3.2 Extraction and purification
Q was extracted from Ginkgo biloba leaves according to the reported method with some modification.18,35 The chromatogram was shown in Fig. S13.† The fraction at 9.5 min was collected and dried under reduced pressure. Then the yellow product was obtained after washing with water. Mp > 280 °C. ESI-MS (Fig. S14†) m/z, 301.04 [M − H]−. 1H NMR (DMSO-d6 600 MHz, Fig. S15†): 12.52 (s, 1H, 5-OH), 10.79 (s, 1H, 7-OH), 9.60 (s, 1H, 3-OH), 9.36 (s, 1H, 4′-OH), 9.32 (s, 1H, 3′-OH), 7.72 (d, J = 2.16 Hz, 1H, 2′-H), 7.58 (d × d, J1 = 10.68 Hz, J2 = 2.16 Hz, 1H, 6′-H), 6.93 (d, J = 8.46 Hz, 1H, 5′-H), 6.44 (d, J = 1.98 Hz, 1H, 8-H), 6.22 (d, J = 2.04 Hz, 1H, 6-H).3.3 Preparation of the stock solutions
0.1 mmol of each acetate/nitrate salts of different metal ions (Li+, Na+, K+, Mg2+, Ca2+, Cr3+, Mn2+, Fe2+, Fe3+, Co2+, Ni2+, Cu2+, Zn2+, Pb2+, Cd2+, La3+, Ce3+, Nd3+, Eu3+, Gd3+, Dy3+) was dissolved in ultrapure water (10 mL) to afford 1 × 10⁻² mol L−1 aqueous solution. The stock solutions were diluted to desired concentrations when needed.Q-CD system was prepared by mixing the solution of Q in MeOH and the solution of CD in PBS (pH = 7.40) with volume ratio 1![[thin space (1/6-em)]](https://www.rsc.org/images/entities/char_2009.gif) :
:![[thin space (1/6-em)]](https://www.rsc.org/images/entities/char_2009.gif) 99. In the Q-CD system, the concentration of Q was 1 × 10⁻⁵ mol L−1 and the concentration of CD varied according to experimental requirements.
99. In the Q-CD system, the concentration of Q was 1 × 10⁻⁵ mol L−1 and the concentration of CD varied according to experimental requirements.
3.4 Optimizing experimental conditions
For all measurements, the fluorescence emission intensities of Q-CD system were measured in CH3OH–PBS (1![[thin space (1/6-em)]](https://www.rsc.org/images/entities/char_2009.gif) :
:![[thin space (1/6-em)]](https://www.rsc.org/images/entities/char_2009.gif) 99, v/v, pH = 7.40) buffer solution and the excitation wavelength was 390 nm. To obtain stronger fluorescence emission intensity of Q-CD system, the ratio of CD to Q was studied. In the same concentration of Q, the fluorescence emission intensities of Q with different concentration of CD were recorded. The best ratio of CD to Q was selected according to the fluorescence emission intensity.
99, v/v, pH = 7.40) buffer solution and the excitation wavelength was 390 nm. To obtain stronger fluorescence emission intensity of Q-CD system, the ratio of CD to Q was studied. In the same concentration of Q, the fluorescence emission intensities of Q with different concentration of CD were recorded. The best ratio of CD to Q was selected according to the fluorescence emission intensity.
3.5 Procedures for detection of copper ions
To study the selectivity of Q-CD system on different metal ions (Li+, Na+, K+, Mg2+, Ca2+, Cr3+, Mn2+, Fe2+, Fe3+, Co2+, Ni2+, Cu2+, Zn2+, Pb2+, Cd2+, La3+, Ce3+, Nd3+, Eu3+, Gd3+, Dy3+), each metal ions was added into Q-CD system, respectively. In the last solutions, [Cu2+] = 1 × 10⁻⁵ mol L−1, the concentration of other transition metal ions and rare earth ions was 2 × 10⁻⁵ mol L−1, and the concentration of alkali metal ions and alkali earth metal ions was 5 × 10⁻⁵ mol L−1. The fluorescence emission intensities of Q-CD system before and after adding metal ions were recorded.To study the influence of the other metal ions on the recognition of Q-CD system to Cu2+, appropriate Cu2+ was added into Q-CD system to form Q-CD-Cu(II) system, then each of the other metal ions was added into Q-CD-Cu(II) system, respectively. In the last solutions, [Cu2+] = 1 × 10⁻⁵ mol L−1, the concentration of other transition metal ions and rare earth ions was 2 × 10⁻⁵ mol L−1, and the concentration of alkali metal ions and alkali earth metal ions was 5 × 10⁻⁵ mol L−1. The fluorescence emission intensities of Q-CD-Cu(II) system before and after adding the other metal ions were recorded.
To obtain the relationship between the fluorescence emission intensity and the concentration of Cu2+, the fluorescence titration experiments were carried out. The fluorescence emission intensities of Q-CD system with various concentration of Cu2+ were recorded.
3.6 Stoichiometric ratio
The stoichiometric ratio between the Q and Cu2+ in Q-CD-Cu(II) system was determined by Job's method.363.7 Detecting Cu2+ in real samples
To check the application of Q-CD system, we designed experiments to detect Cu2+ in water bodies, vegetables and fruits samples by Q-CD system probe. Water samples were collected from suburban and urban areas in Lianyungang and Huaian. Water samples were filtrated through a 0.22 μm-pore-size membrane. Nitric acid digestion was performed before metal analysis by ICP-AES and fluorescent sensor with this method. To accomplish this, each sample (300 mL) was evaporate to dryness, then HNO3 solution (3%, 300 mL) were added to digest at room temperature for 24 h. Following filtration through a 0.22 μm-pore-size membrane, the concentrations of Cu2+were determined by ICP-AES and fluorescent sensor with this method, respectively. Potato, tomato, watermelon and apple were purchased from supermarket and treated according to literature with some modification.37 The vegetables and fruits were homogenized and dried at 150 °C. The dried samples were digested by adding aqua regia and heated until they were colorless. Then, the samples were digested by adding perchloric acid, sulphuric acid and nitric acid and heated in reaction stills for about 12 h until a clear solution was obtained. The digested samples were evaporated to dryness, then 3% HNO3 solution were added. Following filtration through a 0.22 μm-pore-size membrane, the concentrations of Cu2+ were determined by AAS and fluorescent sensor with this method, respectively.4. Conclusions
CD could enhance the fluorescence intensity of Q obviously, and the stability of fluorescence intensity became better, which ensured Q-CD system had better selectivity on Cu2+, and the detection limit was lower and the linear range was larger. The detection mechanism was based on the formation of the Q-CD-Cu(II) complex, which induced the ICT effect. Moreover, the method was successfully applied to detect Cu2+ in water bodies, vegetables and fruits with stable recovery rate. In summary, Q-CD system could act as a fluorescent probe for detecting Cu2+ in aqueous media with high selectivity and sensitivity.Conflicts of interest
There are no conflicts to declare.Acknowledgements
This work was supported by Innovation Fund for Young Scholars of Nanjing Forestry University (CX2017004), the Natural Science Foundation of Jiangsu Province (Grants No. BK20151513), State Key Laboratory for Chemistry and Molecular Engineering of Medicinal Resources (Guangxi Normal University) (CMEMR2017-B06), and the Priority Academic Program Development of Jiangsu Higher Education Institutions.Notes and references
- G. J. Park, G. R. You, Y. W. Choi and C. Kim, Sens. Actuators, B, 2016, 229, 257 CrossRef CAS.
- S. Q. Liao, J. J. Zhao, Y. F. Qin and S. L. Zhao, RSC Adv., 2017, 88, 55668 RSC.
- E. Gaggelli, H. Kozlowski, D. Valensin and G. Valensin, Chem. Rev., 2006, 106, 1995 CrossRef CAS PubMed.
- S. R. Zhang, Q. Wang, G. H. Tian and H. G. Ge, Mater. Lett., 2014, 115, 233 CrossRef CAS.
- A. M. Hernández-Martínez, C. Padrón-Sanz, M. E. Torres-Padrón, Z. Sosa-Ferrera and J. J. Santana-Rodríguez, Anal. Methods, 2016, 8, 7141 RSC.
- S. Lauwens, M. Costas-Rodríguez and F. Vanhaecke, Anal. Chim. Acta, 2018, 1025, 69 CrossRef CAS PubMed.
- D. Alexander, R. Ellerby, A. Hernandez, F. C. Wu and D. Amarasiriwardena, Microchem. J., 2017, 135, 129 CrossRef CAS.
- F. Divsa, N. Isapour, H. Kefayati, A. Badiei, A. Nezhadali, S. Easapour and M. Yadavi, J. Porous Mater., 2015, 22, 1655 CrossRef.
- Y. L. Gao, C. Zhang, S. W. Peng and H. Y. Chen, Sens. Actuators, B, 2017, 238, 455 CrossRef CAS.
- S. Q. Liao, J. J. Zhao, Y. F. Qin and S. L. Zhao, RSC Adv., 2017, 7, 55668 RSC.
- X. Wang, T. Qin, S. S. Bao, Y. C. Zhang, X. Shen, L. M. Zheng and D. R. Zhu, J. Mater. Chem. A, 2016, 4, 16484 RSC.
- X. L. Zhang, X. H. Guo, H. H. Yuan, X. Jia and B. Dai, Dyes Pigm., 2018, 155, 100 CrossRef CAS.
- S. B. Warrier and P. S. Kharkar, J. Lumin., 2018, 199, 407 CrossRef CAS.
- J. Wang, R. S. Li, H. Z. Zhang, N. Wang, Z. Zhang and C. Z. Huang, Biosens. Bioelectron., 2017, 97, 157 CrossRef CAS PubMed.
- C. Li, X. T. Han, S. S. Mao, S. O. Aderinto, X. K. Shi, K. S. Shen and H. L. Wu, Color. Technol., 2018, 134, 230 CAS.
- S. L. Yang, B. Yin, L. Xu, B. H. Gao, H. J. Sun, L. T. Du, Y. Tang, W. N. Jiang and F. L. Cao, Anal. Methods, 2015, 7, 4546 RSC.
- S. D. S. Parveen, B. S. Kumar, S. R. Kumar, R. I. Khan and K. Pitchumani, Sens. Actuators, B, 2015, 221, 75 CrossRef.
- S. L. Yang, W. N. Jiang, F. Y. Zhao, L. Xu, Y. Y. Xu, B. H. Gao, H. J. Sun, L. T. Du, Y. Tang and F. L. Cao, Sens. Actuators, B, 2016, 236, 386 CrossRef CAS.
- Y. Liu, X. Wu, H. P. Zhou, X. Y. Liu, F. J. Zhang and J. H. Yang, Luminescence, 2009, 24, 416 CAS.
- P. Liu, L. L. Zhao, X. Wu, F. Huang, M. Q. Wang and X. D. Liu, Spectrochim. Acta, Part A, 2014, 122, 238 CrossRef CAS PubMed.
- S. Uzasc and F. B. Erim, J. Chromatogr. A, 2014, 1338, 184 CrossRef PubMed.
- S. S. M. Rodrigues, D. S. M. Ribeiro, L. Molina-Garcia, A. R. Medina, J. A. V. Prior and J. L. M. Santos, Talanta, 2014, 122, 157 CrossRef CAS PubMed.
- M. Hosseini, H. Khabbaz, A. S. Dezfoli, M. R. Ganjali and M. Dadmehr, Spectrochim. Acta, Part A, 2015, 136, 1962 CrossRef CAS PubMed.
- X. J. Zhao, H. J. Wang, L. J. Liang and Y. F. Li, Spectrochim. Acta, Part A, 2013, 103, 68 CrossRef CAS PubMed.
- X. H. Liu, W. H. Ding, Y. S. Wu, C. H. Zeng, Z. X. Luo and H. B. Fu, Nanoscale, 2017, 9, 3986–3994 RSC.
- S. B. Bukhari, S. Memon, M. Mahroof-Tahir and M. I. Bhanger, Spectrochim. Acta, Part A, 2009, 71, 1901 CrossRef PubMed.
- C. L. Yan, X. H. Li, Z. L. Xiu and C. Hao, J. Mol. Struct.: THEOCHEM, 2006, 764, 95 CrossRef CAS.
- I. M. Savic, V. D. Nikolic, I. Savic-Gajic, L. B. Nikolic, B. C. Radovanovic and J. D. Mladenovic, J. Inclusion Phenom. Macrocyclic Chem., 2015, 82, 383 CrossRef CAS.
- T. F. Kellici, D. Ntountaniotis, G. Leonis, M. Chatziathanasiadou, A. V. Chatzikonstantinou, J. Becker-Baldus, C. Glaubitz, A. G. Tzakos, K. Viras, P. Chatzigeorgiou, S. Tzimas, E. Kefala, G. Valsami, H. Archontaki, M. G. Papadopoulos and T. Mavromoustakos, Mol. Pharmaceutics, 2015, 12, 954 CrossRef CAS PubMed.
- M. Zhang, Y. H. Zhang and L. Ma, Chin. J. Anal. Chem., 2011, 39, 1907 CAS.
- L. Q. Gu, X. J. Wan, H. Y. Liu, T. Q. Liu and Y. W. Yao, Anal. Methods, 2014, 6, 8460 RSC.
- A. L. Zhou and O. A. Sadik, J. Agric. Food Chem., 2008, 56, 12081 CrossRef CAS PubMed.
- G. Le Nest, O. Caille, M. Woudstra, S. Roche, F. Guerlesquin and D. Lexa, Inorg. Chim. Acta, 2004, 357, 775 CrossRef CAS.
- J. P. Cornard and J. C. Merlin, J. Inorg. Biochem., 2002, 92, 19 CrossRef CAS PubMed.
- F. C. Yu, S. M. Lai and S. Y. Suen, Sep. Sci. Technol., 2003, 38, 1033 CrossRef CAS.
- A. Facchiano and R. Ragone, Anal. Biochem., 2003, 313, 170 CrossRef CAS PubMed.
- H. K. Das, A. K. Mitra, P. K. Sengupta, A. Hossain, F. Islam and G. H. Rabbani, Environ. Int., 2004, 30, 383 CrossRef CAS PubMed.
Footnote |
| † Electronic supplementary information (ESI) available. See DOI: 10.1039/c8ra06754f |
| This journal is © The Royal Society of Chemistry 2018 |

