 Open Access Article
A sensitive fluorescent sensor for the detection of trace water in organic solvents based on carbon quantum dots with yellow fluorescence†
Jianfei
Wei‡
ab,
Haikuo
Li‡
b,
Ye
Yuan
b,
Chenying
Sun
b,
Dan
Hao
b,
Guo
Zheng
 *a and
Rui
Wang
 *b
*b
aSchool of Material Science and Engineering, Tianjin Polytechnic University, No. 399 BinShuiXi Road, Xiqing District, Tianjin, P. R. China
bSchool of Material Science and Engineering, Beijing Institute of Fashion Technology, No. A2, East Yinghua Street, Chaoyang District, Beijing, P. R. China. E-mail: clywangrui@bift.edu.cn; Tel: +86-10-64288279
First published on 1st November 2018
Abstract
The quantitative analysis of trace water in organic solvents has always been a research hotspot, and it is still in the development stage and needs to be continuously developed. In this study, a facile and rapid approach was developed for the preparation of carbon quantum dots (CQDs) with yellow fluorescence emission and ultrahigh absolute fluorescence quantum yields (92.6%). Compared to traditional organic fluorescent molecules, the preparation of CQDs is simpler, faster and more environmentally friendly. It is found that the fluorescent properties of CQDs are excellent in organic solvents and could be quenched by trace water, which makes them a promising material used without any modification for the detection of water in organic solvents. As a result, the as-prepared CQDs were adopted as fluorescent probes for the detection of water in organic solvents (ethanol, tetrahydrofuran, and 1,4-dioxane). The limit of detection was as low as 0.01%. To the best of our knowledge, this is the first time that CQDs have been used as water sensing fluorescent probes in organic solvents. The possible mechanism for trace water detection of the as-prepared CQDs in organic solvents is attributed to the specific water–fluorophore interaction and partially to the increase in polarity of the solvent caused by an increase in water concentration.
1. Introduction
The detection of trace water in organic solvents is an important analytical tool in several fields of industry and chemistry.1–7 The existence of water may cause hydrolysis of organic solvents and increase the formation of oxidation products during storage of organic solvents.8–14 At present, water content is usually measured by a classic Karl-Fisher titration. However, this method also has some flaws such as rigorous sample manipulation, the use of toxic reagents, and the need for specialized equipment.15–17 Nowadays, fluorescent sensors for the detection of trace water are particularly attractive on account of their selectivity, and high sensitivity, as well as their inexpensive, quick, easy and non-destructive fabrication. Therefore, fluorescent sensors are ideal substitutes for classical Karl-Fisher titration.1,4,8,11,14,18−21 Most of the fluorescent sensors currently developed for the detection of water in organic solvents are based on organic fluorescent dyes and fluorescent conjugated polymers.3,8,11,13,15 Yang et al. reported several fluorescence water probes based on merocyanine dyes, fluorescein derivative, 8-hydroxyquinoline derivative, merocyanine dyes and a phenol-indole dye.17 However, organic fluorescent dyes also have disadvantages such as difficulty in synthesis, long preparation period, certain toxicity of the dye itself, and environmental pollution. Fluorescent carbon quantum dots (CQDs) are a new type of fluorescent carbon nanocomposites, which have many advantages over other organic fluorescent materials, such as less affected by the polarity of the solution, lower biological toxicity, narrow and tunable spectra, longer fluorescence lifetime, broad excitation spectra, resistance of photobleaching and higher molar extinction over the organic fluorescent materials.22–58 In this study, a facile and rapid approach was developed for the preparation of carbon quantum dots (CQDs) with yellow fluorescence emission. Compared to traditional organic fluorescent molecules, the preparation of CQDs is simpler, faster and more environment-friendly. It is found that the fluorescent properties of CQDs are excellent in organic solvents and could be quenched by trace water, which makes them a promising material used without any modification for the detection of water in organic solvents. As a result, the as-prepared CQDs were adopted as fluorescent probe for the detection of water in organic solvents (ethanol, tetrahydrofuran, 1,4-dioxane). To the best of our knowledge, this is the first time that CQDs have been used as water sensing fluorescent probes in organic solvents. The possible mechanism for trace water detection of the as-prepared CQDs in organic solvents is attributed to the specific water–fluorophore interaction and partially to the increase in polarity of the solvent caused by the increase of water concentration.2. Materials and methods
2.1 Materials
Sodium citrate, carbamide, methylbenzene and cobalt chloride were obtained from Sinopharm Chemical Reagent Co. Ltd. All of the reagents are analytical grade, which can be used without further purification.Ethanol absolute (water content ≤ 0.005%, anhydrous level, E130059), tetrahydrofuran (≥99.9%, anhydrous level, T120775), and 1,4-dioxane (HPLC, ≥99.5%, D116159) were purchased from Sigma-Aldrich. All the above solvents were dried with activated 3 Å molecular sieves.
2.2 Apparatus
Transmission Electron Microscopy (TEM) (Model JEM-2100F, 200 kV, Japan Electron Optics Laboratory Ltd.) was adopted to characterize the morphology and size distribution of the as-prepared carbon quantum dots. X-ray Photoelectron Spectroscopy (XPS) analysis was performed using a Thermo Fisher Scientific Escalab 250XI spectrometer with a monochromatic X-ray source Al Kα excitation (1486.6 eV). The fluorescence excitation and emission spectra, the UV-vis absorption spectra, as well as the quantum yield were measured using the multifunctional fluorescence spectrophotometer (FS5) from Techcomp (China) Ltd. The samples were put in a quartz fluorescence cuvette with 10 mm optical path length. The samples were excited by the light with wavelength of 440 nm, and the emission spectrum was recorded in the range of 480 to 680 nm. The excitation and emission slit width were fixed at 1 nm and 2 nm, respectively.2.3 Preparation of carbon quantum dots of yellow fluorescence
In this study, carbon quantum dots were prepared by solvothermal method with sodium citrate, carbamide and cobalt chloride as precursors, while methylbenzene was adopted as solvent. First of all, 0.5882 g (0.0020 mole) trisodium citrate dehydrate, 0.2402 g (0.0040 mole) carbamide, 0.7139 g (0.0030 mole) cobalt chloride and 20 mL methylbenzene were added in a 50 mL Teflon-lined stainless steel autoclave. Then, the autoclave was placed in a drying oven for 24 hours, when the temperature of the oven is fixed at 180 °C. After that, the as-prepared product was purified by filtration using cylindrical filtration membrane filter (0.22 μm) and dialysis using regenerated cellulose dialysis membranes with molecular weight cut-offs of 1 kDa (Spectra/Por® 7, 132105). Finally, 1 mL solution was dried in the lyophilizers at about fifty degrees below zero and dispersed in 3 mL organic solvents (such as ethyl alcohol, tetrahydrofuran, and dioxane) for further use.2.4 Detect moisture content in organic solvents
The as-prepared CQDS (3 μL) was diluted to 3 mL corresponding organic solvent and the fluorescent emission spectra excited by the light with wavelength of 440 nm was recorded in the range of 480 nm to 680 nm. The fluorescent intensity at 570 nm was defined as the F0. After that, deionized water was added into the above solution, and the fluorescent emission spectra were measured again after 1 minute. The fluorescent intensity at 570 nm was defined as the Ft. The change of fluorescent intensity (ΔF) was defined as the difference of F0 and Ft.3. Results and discussion
3.1 Optimization of experimental conditions
In this study, sodium citrate, carbamide and cobalt chloride were adopted as precursors for the synthesis of CQDs, while methylbenzene was selected as solvent. It is reported that mass fraction of precursors, reaction temperature and reaction time have great influence on the fluorescence properties of carbon quantum dots.59 In order to prepare CQDs with strong photoluminescence intensity, the above three reaction parameters were systematically determined by a series of experiments. Firstly, the influence of mass fraction of cobalt chloride on the fluorescence intensity was studied, which is demonstrated in Fig. 1(a). It can be found that maximum fluorescence intensity (1.02086 × 10⁶) of CQDs was attained, when the proportion (molar ratio) of the sodium citrate, carbamide and cobalt chloride is 1![[thin space (1/6-em)]](https://www.rsc.org/images/entities/char_2009.gif) :
:![[thin space (1/6-em)]](https://www.rsc.org/images/entities/char_2009.gif) 2
2![[thin space (1/6-em)]](https://www.rsc.org/images/entities/char_2009.gif) :
:![[thin space (1/6-em)]](https://www.rsc.org/images/entities/char_2009.gif) 1.5 (the reaction temperature: 180 °C, the reaction time: 24 h). The effect of reaction temperature on fluorescence intensity is also showed in Fig. 1(b). A significant increase of fluorescence intensity was obtained between 140 and 180 °C. When the temperature increased from 180 to 220 °C, the fluorescence intensity showed a decreasing trend. As a result, 180 °C is the optimum reaction temperature for the synthesis of CQDs, when the proportion (molar ratio) of the sodium citrate, carbamide and cobalt chloride is 1
1.5 (the reaction temperature: 180 °C, the reaction time: 24 h). The effect of reaction temperature on fluorescence intensity is also showed in Fig. 1(b). A significant increase of fluorescence intensity was obtained between 140 and 180 °C. When the temperature increased from 180 to 220 °C, the fluorescence intensity showed a decreasing trend. As a result, 180 °C is the optimum reaction temperature for the synthesis of CQDs, when the proportion (molar ratio) of the sodium citrate, carbamide and cobalt chloride is 1![[thin space (1/6-em)]](https://www.rsc.org/images/entities/char_2009.gif) :
:![[thin space (1/6-em)]](https://www.rsc.org/images/entities/char_2009.gif) 2
2![[thin space (1/6-em)]](https://www.rsc.org/images/entities/char_2009.gif) :
:![[thin space (1/6-em)]](https://www.rsc.org/images/entities/char_2009.gif) 1.5 and the reaction time is 24 h. Besides, the influence of the reaction time on fluorescence intensity was investigated, when the proportion (molar ratio) of the sodium citrate, carbamide and cobalt chloride is fixed at 1
1.5 and the reaction time is 24 h. Besides, the influence of the reaction time on fluorescence intensity was investigated, when the proportion (molar ratio) of the sodium citrate, carbamide and cobalt chloride is fixed at 1![[thin space (1/6-em)]](https://www.rsc.org/images/entities/char_2009.gif) :
:![[thin space (1/6-em)]](https://www.rsc.org/images/entities/char_2009.gif) 2
2![[thin space (1/6-em)]](https://www.rsc.org/images/entities/char_2009.gif) :
:![[thin space (1/6-em)]](https://www.rsc.org/images/entities/char_2009.gif) 1.5 and the reaction temperature is 180 °C. According to Fig. 1(c), it is found that the optimum reaction time is 24 h. The absolute fluorescence quantum yield of the as-prepared carbon quantum dots was measured by integration sphere of FS5. The result shows that the absolute fluorescence quantum yields is 92.6%.
1.5 and the reaction temperature is 180 °C. According to Fig. 1(c), it is found that the optimum reaction time is 24 h. The absolute fluorescence quantum yield of the as-prepared carbon quantum dots was measured by integration sphere of FS5. The result shows that the absolute fluorescence quantum yields is 92.6%.
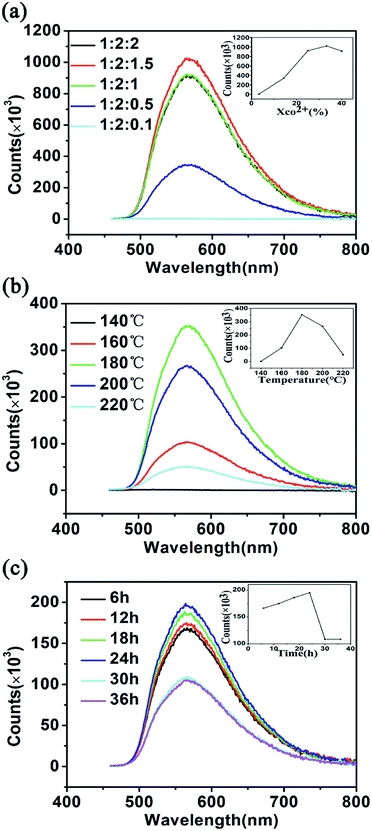 | ||
| Fig. 1 Effects of (a) mass fraction of cobalt chloride, (b) reaction temperature, and (c) reaction time on the fluorescence intensity. | ||
3.2 The morphology characterization of carbon quantum dots
The morphology of CQDs synthesized under optimum experimental conditions was visualized by the transmission electron microscopy (TEM). It can be seen from the TEM image (Fig. 2(a)) that the shape of the as-prepared CQDs is spherical and disperse evenly. The high-resolution TEM (HRTEM) images (the inset of Fig. 2(a)) revealed the high crystallinity of CQDs. The lattice spacing of 0.21 nm is in agreement with that of the in-plane lattice spacing of graphene (100 facet) and the spacing between graphite layers (100 facet).60 In addition, the Fig. 2(b) is the particle size distribution histogram of Fig. 2(a), which shows that the diameter of the as-prepared CQDs is distributed in the range from 3.3 to 8.1 nm with an average size of 5.2 nm.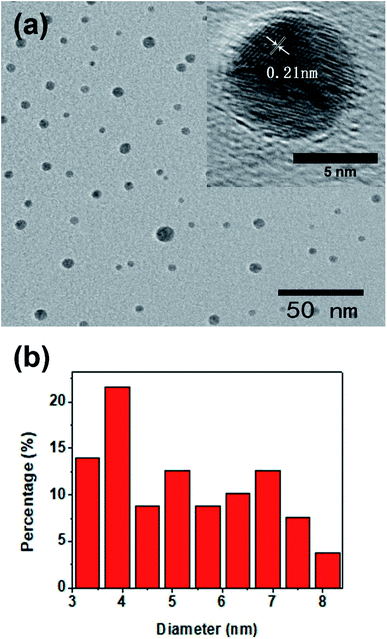 | ||
| Fig. 2 (a) The TEM image of CQDs (the inset shows the high resolution TEM images of single CQD), (b) the corresponding particle size distribution histogram of (a). | ||
3.3 The structure characterization of carbon quantum dots
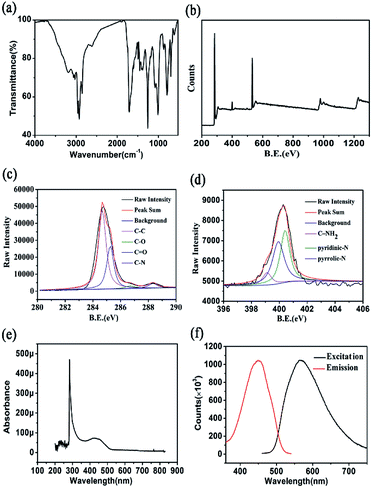
The FTIR (Fourier transform infrared spectroscopy) and XPS (X-ray photoelectron spectroscopy) were adopted to further characterize functional groups and chemical bound of CQDs. As shown in Fig. 3(a), the CQDs show three strong peaks at 1708, 1258, and 1009 cm−1, which attributed to C![[double bond, length as m-dash]](https://www.rsc.org/images/entities/char_e001.gif) O, C–N and O–H stretching vibration, respectively.61 What' more, the peak at around 3000–2850 cm−1 is ascribed to the C–H stretching vibration.62 The broad band at 800–600 cm−1 corresponds to the N–H bending vibration.63 Moreover, the surface components and oxidation states of CQDs were also characterized by XPS. The Fig. 3(b) shows four peaks centred at 284.48 eV, 400.22 eV, and 532.24 eV, which correspond with C1s, N1s, and O1s respectively. The result suggestion that the as-prepared CQDs contained C, N, O with % atom ratio of C
O, C–N and O–H stretching vibration, respectively.61 What' more, the peak at around 3000–2850 cm−1 is ascribed to the C–H stretching vibration.62 The broad band at 800–600 cm−1 corresponds to the N–H bending vibration.63 Moreover, the surface components and oxidation states of CQDs were also characterized by XPS. The Fig. 3(b) shows four peaks centred at 284.48 eV, 400.22 eV, and 532.24 eV, which correspond with C1s, N1s, and O1s respectively. The result suggestion that the as-prepared CQDs contained C, N, O with % atom ratio of C![[thin space (1/6-em)]](https://www.rsc.org/images/entities/char_2009.gif) :
:![[thin space (1/6-em)]](https://www.rsc.org/images/entities/char_2009.gif) N
N![[thin space (1/6-em)]](https://www.rsc.org/images/entities/char_2009.gif) :
:![[thin space (1/6-em)]](https://www.rsc.org/images/entities/char_2009.gif) O = 77.58
O = 77.58![[thin space (1/6-em)]](https://www.rsc.org/images/entities/char_2009.gif) :
:![[thin space (1/6-em)]](https://www.rsc.org/images/entities/char_2009.gif) 4.55
4.55![[thin space (1/6-em)]](https://www.rsc.org/images/entities/char_2009.gif) :
:![[thin space (1/6-em)]](https://www.rsc.org/images/entities/char_2009.gif) 17.86. The high-resolution spectra of C1s, N1s were demonstrated in Fig. 3(c) and (d). The high-resolution spectrum of C1s show four peaks at 284.58 eV, 286.68 eV, 288.38 eV and 285.28 eV, which correspond with C–C, C–O, C
17.86. The high-resolution spectra of C1s, N1s were demonstrated in Fig. 3(c) and (d). The high-resolution spectrum of C1s show four peaks at 284.58 eV, 286.68 eV, 288.38 eV and 285.28 eV, which correspond with C–C, C–O, C![[double bond, length as m-dash]](https://www.rsc.org/images/entities/char_e001.gif) O and C–N respectively. The high-resolution spectrum of N1s can be deconvoluted into three peaks, C–NH2 (399.08 eV), pyridinic-N (400.38 eV) and pyrrolic-N (399.98 eV). Fig. 3(e) shows the UV-vis absorption spectrum of as-prepared CQDs. The absorption peak at 290 nm is ascribed to the formation of aromatic π orbitals, due to the formation of graphitic carbon structure. What's more, there is another absorption peak in 420 nm in the UV-vis absorption spectrum for CQDs, which corresponds with the excitation spectrum (Fig. 3(f)). From the results, we can infer that the CQDs are evenly distributed. In other words, the as-prepared CQDs had identical absorption structure and luminescent centre.
O and C–N respectively. The high-resolution spectrum of N1s can be deconvoluted into three peaks, C–NH2 (399.08 eV), pyridinic-N (400.38 eV) and pyrrolic-N (399.98 eV). Fig. 3(e) shows the UV-vis absorption spectrum of as-prepared CQDs. The absorption peak at 290 nm is ascribed to the formation of aromatic π orbitals, due to the formation of graphitic carbon structure. What's more, there is another absorption peak in 420 nm in the UV-vis absorption spectrum for CQDs, which corresponds with the excitation spectrum (Fig. 3(f)). From the results, we can infer that the CQDs are evenly distributed. In other words, the as-prepared CQDs had identical absorption structure and luminescent centre.
3.4 Optical properties of carbon quantum dots
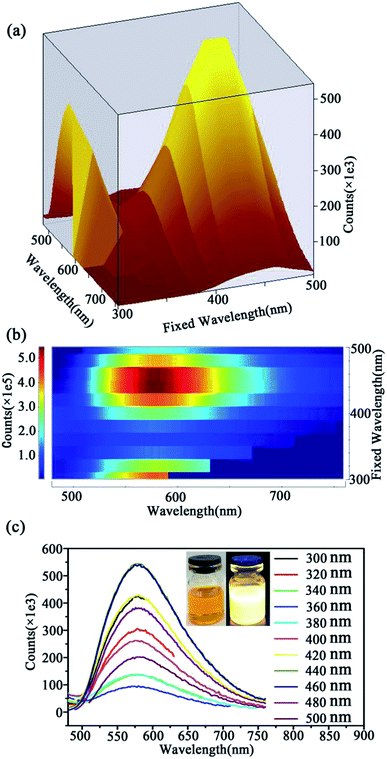
Fig. 4 demonstrated the 3D map (Fig. 4(a)), contour plot (Fig. 4(b)) and the emission spectra (Fig. 4(c)) excited by the light of wavelength range from 300 to 500 nm of the as-prepared CQDs. According to the comparison and analysis of Fig. 4(a)–(c), it can be found that when the excited at ∼440 nm the as-prepared CQDs have the strongest emission at 570 nm. The toluene solution of CQDs exhibits orange-yellow color (left inset, Fig. 4(c)) in day light and bright yellow emission under UV light (365 nm) (right inset in Fig. 4(c)). What's more, the CQDs exhibit excitation independent emission properties, due to the homogeneous surface structure, and monodispersity (Fig. 1(a)) of CQDs. What is more, it is found that the fluorescent properties of CQDs are excellent and stable in organic solvents (toluene, ethanol, 1,4-dioxane, tetrahydrofuran) (Fig. S1†).3.5 Fluorescence “turn-off” determination of water content in organic solvents
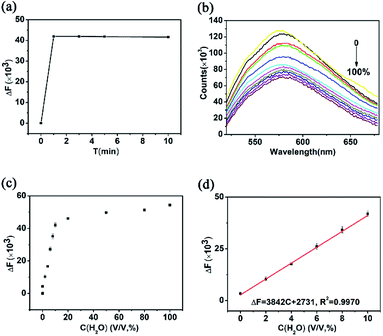
Water exists in all kinds of organic solvents and is the most common impurity in organic solvents. The water content in the organic solvent will influence the chemical reaction to a great extent, and even determine the product of the reaction. Therefore, the determination of the water content in the organic solvent is one of the most important and most commonly encountered analytical problems.2,3,5,7,13In order to explore the possibility for application of the as-prepared CQDs in the detection of water content in organic solvents, the fluorescence emission spectra excited by the light of 440 nm of CQDs dispersed in ethanol were further examined. As shown in Fig. 5(a), when 10% v/v water was added into the ethanol solution of CQDs, the fluorescent intensity decreased significantly for one minute and then tends to be stable. This indicates that CQDs can be used as fluorescent probes to quickly detect water content in organic solvents. Fig. 5(b) shows the fluorescence emission spectra of CQDs dispersed in ethanol with different concentration of H2O (0, 0.01, 2, 4, 6, 8, 10, 20, 50, 80, 100 v/v, %). It can be seen that with the increase of water content, the fluorescence intensity decreases gradually and the emission peak remain the same. Fig. 5(c) shows that the fluorescent intensity decreased with the addition of water in the ethanol solution of CQDs. It can be found that when the water content exceeds 10%, the decrease of fluorescence intensity gradually slows. The resulting calibration curve for H2O showed good linearity for the range of concentrations from 0.01% (v/v) to 10% (v/v) with a correlation coefficient of 0.9970 (Fig. 5(d)). The limit of detection was as low as 0.01% based on five times the standard deviation rule. The limit of detection is lower than that of those previously reported.6,12,64–67 Furthermore, the water content in tetrahydrofuran, 1,4-dioxane is also rapidly detected using the as-prepared CQDs (see details in Fig. S2 and S3†).
3.6 The possible mechanism for trace water detection in organic solvents
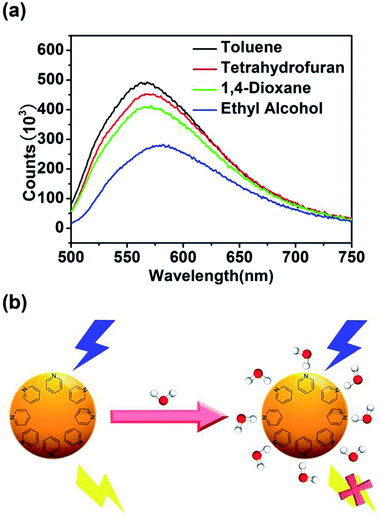
In order to explore the mechanism for the detection of water content in organic solvents, the fluorescence emission spectra excited by the light of 440 nm of CQDs dispersed in different organ solvents (toluene, tetrahydrofuran, 1,4-dioxane, ethanol) with increasing polarity were further examined. As shown in Fig. 6(a), the emission peak of CQDs dispersed in toluene, tetrahydrofuran, 1,4-dioxane and ethanol shifted to undergoes red shift with increasing solvent polarity. What is more, the fluorescent intensity decreases with increase of solvent polarity, which conform to solvation effect. The above-mentioned fluorescent property is consistent with that of internal charge transfer (ICT) fluorescent probes.68,69 According to Fig. 5, S1 and S2,† it can be found that the emission peak of CQDs in tetrahydrofuran and 1,4-dioxane shifted to higher wavelength with the increase of the H2O concentration, while the emission peak of CQDs in ethanol showed no remarkable change with the increase of the H2O concentration. This, combined with the results of Fig. 6(a), indicates that the presence of hydroxyl in ethanol and water (–OH) will lead to the red-shift effect for the emission peak and decrease of fluorescence intensity. According to the results of XPS, there is pyridinic-N in the structure of CQDs. Because the electron density around pyridinic-N is higher, this atom serves as a stronger acceptor of hydrogen bonds, which increases the possibility of nonradiative relaxation of the excited CQDs and leads to the decrease of fluorescent intensity in the presence of hydrogen bond donating molecules, such as ethyl alcohol and water.70 In a word, the decrease of fluorescence intensity of as-prepared CQDs is attributed to the specific water–fluorophore interaction and partially to the increase in polarity of the solvent caused by the addition of water.4. Conclusions
In summary, homogeneous carbon quantum dots with yellow fluorescence and high PL were firstly prepared by solvothermal method adopting sodium citrate, carbamide, and cobalt chloride as precursors with toluene as solvent. The as-prepared CQDs with high crystallinity have spherical shape with an average size of 5.2 nm. It is found that the fluorescent properties of CQDs are excellent in organic solvents and could be quenched by trace water, which makes them a promising material used without any modification for the detection of water in organic solvents. The as-prepared CQDS were adopted as fluorescent probes for the detection of trace water organic solvents according to the luminescence response with correlation coefficient of 0.9983 (in ethanol), 0.9990 (in tetrahydrofuran), 0.9963 (in 1,4-dioxane), respectively. This is the first time that CQDs were adopted as the water sensing fluorescent probe. This work makes the CQDs a promising material used without any modification in the detection of water in organic solvents and with immense potential for applications in quality management of the solvent products. The possible mechanism for trace water detection in organic solvents is attributed to the specific water–fluorophore interaction and partially to the increase in polarity of the solvent caused by the increase of water concentration.Conflicts of interest
There are no conflicts to declare.References
- M. Bai and W. R. Seitz, Talanta, 1994, 41, 993–999 CrossRef CAS.
- J. Blyth, R. B. Millington, A. G. Mayes, E. R. Frears and C. R. Lowe, Anal. Chem., 1996, 68, 1089–1094 CrossRef CAS PubMed.
- U. Fegade, S. Patil, R. Kaur, S. K. Sahoo, N. Singh, R. Bendre and A. Kuwar, Sens. Actuators, B, 2015, 210, 324–327 CrossRef CAS.
- D.-C. Han, Y.-J. Jin, J.-H. Lee, S.-I. Kim, H.-J. Kim, K.-H. Song and G. Kwak, Macromol. Chem. Phys., 2014, 215, 1068–1076 CrossRef CAS.
- H. S. Jung, P. Verwilst, W. Y. Kim and J. S. Kim, Chem. Soc. Rev., 2016, 45, 1242–1256 RSC.
- K.-H. Kim and H. J. Kim, Bull. Korean Chem. Soc., 2015, 36, 183–188 CrossRef CAS.
- W. Y. Kim, H. Shi, H. S. Jung, D. Cho, P. Verwilst, J. Y. Lee and J. S. Kim, Chem. Commun., 2016, 52, 8675–8678 RSC.
- Z. Li, Q. Yang, R. Chang, G. Ma, M. Chen and W. Zhang, Dyes Pigm., 2011, 88, 307–314 CrossRef CAS.
- G. Men, C. Chen, C. Liang, W. Han and S. Jiang, Analyst, 2015, 140, 5454–5458 RSC.
- G. Men, G. Zhang, C. Liang, H. Liu, B. Yang, Y. Pan, Z. Wang and S. Jiang, Analyst, 2013, 138, 2847–2857 RSC.
- Y. Ooyama, S. Aoyama, K. Furue, K. Uenaka and J. Ohshita, Dyes Pigm., 2015, 123, 248–253 CrossRef CAS.
- Y. Ooyama, K. Uenaka, A. Matsugasako, Y. Harima and J. Ohshita, RSC Adv., 2013, 3, 23255–23263 RSC.
- F. Opekar and P. Tůma, Sens. Actuators, B, 2015, 220, 485–490 CrossRef CAS.
- S. Pal, M. Mukherjee, B. Sen, S. Lohar and P. Chattopadhyay, RSC Adv., 2014, 4, 21608–21611 RSC.
- H.-S. Peng, X.-H. Li, F.-T. You, F. Teng and S.-H. Huang, Microchim. Acta, 2013, 180, 807–812 CrossRef CAS.
- A. C. Pereira, B. F. Reis and F. R. P. Rocha, Talanta, 2015, 131, 21–25 CrossRef CAS PubMed.
- Y. Sun, X. Liang, S. Wei, J. Fan and X. Yang, Spectrochim. Acta, Part A, 2012, 97, 352–358 CrossRef CAS PubMed.
- J. Qi, B. Li, X. Wang, Z. Zhang, Z. Wang, J. Han and L. Chen, Sens. Actuators, B, 2017, 251, 224–233 CrossRef CAS.
- M. Jia, Z. Zhang, J. Li, H. Shao, L. Chen and X. Yang, Sens. Actuators, B, 2017, 252, 934–943 CrossRef CAS.
- J. Yu, X. Wang, Q. Kang, J. Li, D. Shen and L. Chen, Environ. Sci.: Nano, 2017, 4, 493–502 RSC.
- X.-R. Wang, B.-W. Li, H.-Y. You and L.-X. Chen, Chin. J. Anal. Chem., 2015, 43, 1499–1504 CAS.
- J. Zhang, J. Wang, J. Fu, X. Fu, W. Gan and H. Hao, J. Nanopart. Res., 2018, 20, 41 CrossRef.
- W. Yang, H. Zhang, J. Lai, X. Peng, Y. Hu, W. Gu and L. Ye, Carbon, 2018, 128, 78–85 CrossRef CAS.
- J. Xu, Y. Miao, J. Zheng, H. Wang, Y. Yang and X. Liu, Nanoscale, 2018, 10, 11211–11221 RSC.
- Q. Wu, X. Wang, S. A. Rasaki, T. Thomas, C. Wang, C. Zhang and M. Yang, J. Mater. Chem. C, 2018, 6, 4508–4515 RSC.
- Z. Miao, W. Hou, M. Liu, Y. Zhang and S. Yao, New J. Chem., 2018, 42, 1446–1456 RSC.
- Z. Li, J. Zhang, Y. Li, S. Zhao, P. Zhang, Y. Zhang, J. Bi, G. Liu and Z. Yue, Biosens. Bioelectron., 2018, 99, 251–258 CrossRef CAS.
- R. Wang, X. Wang and Y. Sun, Sens. Actuators, B, 2017, 241, 73–79 CrossRef CAS.
- R. Wang, K.-Q. Lu, Z.-R. Tang and Y.-J. Xu, J. Mater. Chem. A, 2017, 5, 3717–3734 RSC.
- A. Vassilakopoulou, V. Georgakilas, N. Vainos and I. Koutselas, J. Phys. Chem. Solids, 2017, 103, 190–196 CrossRef CAS.
- L. Sciortino, F. Messina, G. Buscarino, S. Agnello, M. Cannas and F. M. Gelardi, J. Nanopart. Res., 2017, 19, 228 CrossRef.
- W. Liu, C. Li, X. Sun, W. Pan and J. Wang, Sens. Actuators, B, 2017, 244, 441–449 CrossRef CAS.
- X. Cui, Y. Wang, J. Liu, Q. Yang, B. Zhang, Y. Gao, Y. Wang and G. Lu, Sens. Actuators, B, 2017, 242, 1272–1280 CrossRef CAS.
- B. Zhu, C. Shang and Z. Guo, ACS Sustainable Chem. Eng., 2016, 4, 1050–1057 CrossRef CAS.
- Y. H. Yuan, Z. X. Liu, R. S. Li, H. Y. Zou, M. Lin, H. Liu and C. Z. Huang, Nanoscale, 2016, 8, 6770–6776 RSC.
- L. Xu, G. Fang, M. Pan, X. Wang and S. Wang, Biosens. Bioelectron., 2016, 77, 950–956 CrossRef CAS.
- N. Wang, Y. Wang, T. Guo, T. Yang, M. Chen and J. Wang, Biosens. Bioelectron., 2016, 85, 68–75 CrossRef CAS.
- L. Wang, B. Li, F. Xu, X. Shi, D. Feng, D. Wei, Y. Li, Y. Feng, Y. Wang, D. Jia and Y. Zhou, Biosens. Bioelectron., 2016, 79, 1–8 CrossRef CAS.
- S. Y. Park, H. U. Lee, E. S. Park, S. C. Lee, J.-W. Lee, S. W. Jeong, C. H. Kim, Y.-C. Lee, Y. S. Huh and J. Lee, ACS Appl. Mater. Interfaces, 2014, 6, 3365–3370 CrossRef CAS.
- T. Feng, X. Ai, G. An, P. Yang and Y. Zhao, ACS Nano, 2016, 10, 4410–4420 CrossRef CAS.
- F. Wang, Z. Xie, H. Zhang, C.-y. Liu and Y.-g. Zhang, Adv. Funct. Mater., 2011, 21, 1027–1031 CrossRef CAS.
- S. Yang, L. Zhi, K. Tang, X. Feng, J. Maier and K. Müllen, Adv. Funct. Mater., 2012, 22, 3634–3640 CrossRef CAS.
- L. Bao, Z.-L. Zhang, Z.-Q. Tian, L. Zhang, C. Liu, Y. Lin, B. Qi and D.-W. Pang, Adv. Mater., 2011, 23, 5801–5806 CrossRef CAS.
- B. Kong, A. Zhu, C. Ding, X. Zhao, B. Li and Y. Tian, Adv. Mater., 2012, 24, 5844–5848 CrossRef CAS.
- J. Liang, Y. Jiao, M. Jaroniec and S. Z. Qiao, Angew. Chem., Int. Ed. Engl., 2012, 51, 11496–11500 CrossRef CAS.
- S. Qu, X. Wang, Q. Lu, X. Liu and L. Wang, Angew. Chem., Int. Ed. Engl., 2012, 51, 12215–12218 CrossRef CAS.
- S. Zhu, Q. Meng, L. Wang, J. Zhang, Y. Song, H. Jin, K. Zhang, H. Sun, H. Wang and B. Yang, Angew. Chem., Int. Ed. Engl., 2013, 52, 3953–3957 CrossRef CAS.
- W. Wu, L. Zhan, W. Fan, J. Song, X. Li, Z. Li, R. Wang, J. Zhang, J. Zheng, M. Wu and H. Zeng, Angew. Chem., 2015, 127, 6640–6644 CrossRef.
- A. B. Bourlinos, M. A. Karakassides, A. Kouloumpis, D. Gournis, A. Bakandritsos, I. Papagiannouli, P. Aloukos, S. Couris, K. Hola, R. Zboril, M. Krysmann and E. P. Giannelis, Carbon, 2013, 61, 640–643 CrossRef CAS.
- X. Ren, J. Liu, X. Meng, J. Wei, T. Liu and F. Tang, Chem. Asian J., 2014, 9, 1054–1059 CrossRef CAS.
- M. X. Gao, C. F. Liu, Z. L. Wu, Q. L. Zeng, X. X. Yang, W. B. Wu, Y. F. Li and C. Z. Huang, Chem. Commun., 2013, 49, 8015–8017 RSC.
- H. Zhu, X. Wang, Y. Li, Z. Wang, F. Yang and X. Yang, Chem. Commun., 2009, 5118–5120, 10.1039/b907612c.
- V. Gupta, N. Chaudhary, R. Srivastava, G. D. Sharma, R. Bhardwaj and S. Chand, J. Am. Chem. Soc., 2011, 133, 9960–9963 CrossRef CAS.
- R. Ye, C. Xiang, J. Lin, Z. Peng, K. Huang, Z. Yan, N. P. Cook, E. L. Samuel, C. C. Hwang, G. Ruan, G. Ceriotti, A. R. Raji, A. A. Marti and J. M. Tour, Nat. commun., 2013, 4, 2943 CrossRef.
- Y. Ma, G. Xu, F. Wei, Y. Cen, Y. Ma, Y. Song, X. Xu, M. Shi, S. Muhammad and Q. Hu, J. Mater. Chem. C, 2017, 5, 8566–8571 RSC.
- M. Amjadi and R. Jalili, Biosens. Bioelectron., 2017, 96, 121–126 CrossRef CAS.
- A. A. Ensafi, P. Nasr-Esfahani and B. Rezaei, Sens. Actuators, B, 2018, 257, 889–896 CrossRef CAS.
- N. Yu, H. Peng, H. Xiong, X. Wu, X. Wang, Y. Li and L. Chen, Microchim. Acta, 2015, 182, 2139–2146 CrossRef CAS.
- Q. Xu, Y. Liu, C. Gao, J. Wei, H. Zhou, Y. Chen, C. Dong, T. S. Sreeprasad, N. Li and Z. Xia, J. Mater. Chem. C, 2015, 3, 9885–9893 RSC.
- C. J. Reckmeier, J. Schneider, A. S. Susha and A. L. Rogach, Opt. Express, 2016, 24, A312–A340 CrossRef CAS.
- X. Meng, J. Wei, X. Ren, J. Ren and F. Tang, Biosens. Bioelectron., 2013, 47, 402–407 CrossRef CAS.
- H. Li, X. He, Y. Liu, H. Huang, S. Lian, S.-T. Lee and Z. Kang, Carbon, 2011, 49, 605–609 CrossRef CAS.
- P. C. Hsu and H. T. Chang, Chem. Commun., 2012, 48, 3984–3986 RSC.
- K. Zhao, T. Liu, G. Wang, X. Chang, D. Xue, K. D. Belfield and Y. Fang, J. Phys. Chem. B, 2013, 117, 5659–5667 CrossRef CAS.
- Y. Ooyama, M. Sumomogi, T. Nagano, K. Kushimoto, K. Komaguchi, I. Imae and Y. Harima, Org. Biomol. Chem., 2011, 9, 1314–1316 RSC.
- Y. Ooyama, A. Matsugasako, K. Oka, T. Nagano, M. Sumomogi, K. Komaguchi, I. Imae and Y. Harima, Chem. Commun., 2011, 47, 4448–4450 RSC.
- Q. Deng, Y. Li, J. Wu, Y. Liu, G. Fang, S. Wang and Y. Zhang, Chem. Commun., 2012, 48, 3009–3011 RSC.
- M. H. Lee, J. S. Kim and J. L. Sessler, Chem. Soc. Rev., 2015, 44, 4185–4191 RSC.
- A. P. de Silva, H. Q. N. Gunaratne, T. Gunnlaugsson, A. J. M. Huxley, C. P. McCoy, J. T. Rademacher and T. E. Rice, Chem. Rev., 1997, 97, 1515–1566 CrossRef CAS.
- D. Citterio, K. Minamihashi, Y. Kuniyoshi, H. Hisamoto, S.-I. Sasaki and K. Suzuki, Anal. Chem., 2001, 73, 5339–5345 CrossRef CAS.
Footnotes |
| † Electronic supplementary information (ESI) available. See DOI: 10.1039/c8ra06732e |
| ‡ Jianfei Wei and Haikuo Li contribute equally to this work. |
| This journal is © The Royal Society of Chemistry 2018 |

