 Open Access Article
Creative Commons Attribution 3.0 Unported Licence
Polyaniline modified magnetic nanoparticles coated with dicationic ionic liquid for effective removal of rhodamine B (RB) from aqueous solution†
Mohamad Shariff Shahriman a,
Nur Nadhirah Mohamad Zain
 a,
Sharifah Mohamad
 bc,
Ninie Suhana Abdul Mananbc,
Suhaila Mohd Yamanb,
Saliza Asmand and
Muggundha Raoov
 *bc
*bc
aIntegrative Medicine Cluster, Advanced Medical and Dental Institute (AMDI), Universiti Sains Malaysia, 13200 Kepala Batas, Pulau Pinang, Malaysia
bDepartment of Chemistry, Faculty of Science, University of Malaya, 50603 Kuala Lumpur, Malaysia. E-mail: muggundha@um.edu.my; Tel: +603 7967 7022 ext. 2544
cUniversity of Malaya Centre for Ionic Liquids (UMCIL), Department of Chemistry, Faculty of Science, University of Malaya, 50603 Kuala Lumpur, Malaysia
dDepartment of Physics and Chemistry, Faculty of Applied Sciences and Technology, Pagoh Education Hub, Universiti Tun Hussein Onn Malaysia, 84000 Pagoh, Muar, Johor, Malaysia
First published on 26th September 2018
Abstract
Polyaniline (PANI) modified magnetic nanoparticle (MNP) nanocomposites coated with newly synthesized dicationic ionic liquid (DICAT) forming MNP-PANI-DICAT were successfully synthesized as a potential material for the removal of Rhodamine B (RB) from water samples. The synthesized material was successfully characterized using a few techniques such as Fourier transform infrared spectroscopy (FT-IR), X-ray powder diffraction (XRD), thermo gravimetric analysis (TGA), Brunauer–Emmett–Teller (BET), and transmission electron microscopy (TEM) analysis. Several parameters have been optimized to enhance the efficiency of the removal process. The adsorption kinetics were investigated and the results showed that MNP-PANI-DICAT was best fitted to a pseudo-second order model for the adsorption of RB. As for the isotherm studies, Temkin's model was found to fit well with the adsorption isotherm of RB on MNP-PANI-DICAT. Other than that, thermodynamics results showed negative values of ΔG° for the adsorption of RB, which indicated that the process is thermodynamically feasible, spontaneous and chemically controlled at lower temperature. The negative value of enthalpy ΔH° (−40.41) indicated that the adsorption was an exothermic process. The percentage removal of RB was found to be 94.7% by MNP-PANI-DICAT under optimized conditions.
1 Introduction
A dye is a coloured, aromatic organic substance which absorbs light in the visible range from 400–800 nm and has been extensively used in the textile and food industries and as a biological stain in biomedical laboratories.1 Rhodamine B (RB) is a common hydrophilic organic dye applied for industrial purposes. RB has been forbidden in the food industry for many years due to its suspected carcinogenic nature. RB threatens human health with permanent injury to the eyes, irritation to the gastrointestinal tract with symptoms such as nausea, vomiting and diarrhea and causes methemoglobinemia, cyanosis, convulsions and skin irritation.2,3 In addition, because of the expansion of industry and illegal discharges, it still has the possibility of entering the food chain. Therefore, it is significant in environmental science to investigate the removal of RB from water bodies.Most of the researchers have used various techniques for the removal of dyes from water surfaces. Among all the available method, adsorption techniques are found to be the most promising method for the removal of dyes from water surfaces compared to others.4 So far, various effective and efficient adsorbents have been developed to be applied in adsorption studies as an adsorbent material to remove various types of dye compounds.5,6 However, most adsorbent materials are difficult to re-collect back from water sample solution. Thus, in this work, RB was removed from water sample using newly synthesized magnetic nanoparticles.
Magnetite (Fe3O4) nanoparticles (MNPs) showed outstanding performance in term of superior superparamagnetic property, good compatibility, less toxicity and greater of physicochemical stability.7 MNPs have gain enormous interest in various fields and applications since emerging as an innovative compound due to its own characteristics.8–11 The targeted analytes can be separated by using an external magnetic field from aqueous sample during the adsorption process. However, the application of MNPs in adsorption process is challenging because it can be easily oxidized and agglomerate in aqueous solution. Therefore, some modifications on the surfaces of MNPs either by functionalization or coating with other solid support or functional group such as natural, conductive and synthetic polymers is necessary for better adsorbing capability and extraction ability.12
In this study polyaniline (PANI) as synthetic polymer has been introduced to adsorbent materials. Furthermore, PANI have extensively unique characteristics of exchanging between a conductor and an insulator under certain experimental conditions. This polymer can provide better removal application due to its good environmental stability, facile synthesis and relatively low costs.
Ionic liquids (ILs) have been used lately among researchers to increase the extraction efficiencies by loading the ILs on the surface of the polymers that gained an interesting impact in research.13,14 Moreover, ILs are known as unique solvent which commonly being used in extraction, synthesis and electrochemistry studies. The significant benefits of using ILs as coating materials are to improve the selectivity and sensitivity toward the targeted analytes by increasing the hydrophobicity and π–π interactions between analytes and the sorbent coated.15–17
Monocationic ionic liquid has been extensively studied since few decades ago, but dicationic ionic liquids were less reported.18–21 In dicationic ionic liquid form, dication is associated with two identical anions, which make it either exist in hydrophilic or hydrophobic state toward aqueous solution. The dicationic ionic liquid can be classified as symmetric (combination of two identical monocations) or asymmetrical (combination of two different monocations) structures. Other than the uniqueness such as high thermal ability, a wide temperature range of liquid state, and biological activities, the ability of functionalization of dicationic ionic liquids give the possibility of designing more structures with respect to cations, anions and the length of chain linking two cations based on imidazolium and pyrrolidinium.22,23
Based on our previous study, we have successfully synthesized new material which is MNP-PANI-DICAT that have been applied as magnetic solid phase extraction (MSPE) for PAHs.24 However, we would like to extend the potential of this material for the removal of dye compound. To the best of our knowledge, by combining the excellent properties of PANI modified MNP and coated with new type of dicationic ILs acts as new adsorbents for the removal of RB from water samples have not been reported yet. Herein, in this study MNP-PANI-DICAT has been applied for the removal of RB from aqueous solution and the adsorption mechanisms between the adsorbent and adsorbate have been studied by using kinetic, isotherm and thermodynamics models. The developed removal process has been successfully applied to real water samples.
2 Experimental
2.1 Chemical and reagent
The selected analyte which is Rhodamine B (RB) was purchased from Sigma-Aldrich (Steinheim, Germany). Ferrous chloride tetrahydrate (FeCl2·4H2O) and ferric chloride hexahydrate (FeCl3·6H2O) were purchased from R&M Chemicals, Tamil Nadu, India. Aqueous ammonia (25%) was supplied by Merck, Germany. Ultrapure water (18.2 MΩ cm−1) was reproduced by a Sartorius Milli-Q system (Aubagne, France) instruments. All the solvents, potassium peroxodisulfate (K2S2O8) and aniline (C6H5NH2) were purchased from Friendemann Schhmidt Chemical, Perth, Western Australia. Other than that, 1-benzylimidazole, 2,5-dichloro-p-xylene and bis(trifluromethane)sulfonamide lithium salt were purchased from Sigma-Aldrich, (Steinheim, Germany).2.2 Material preparations
2.3 Instrumentation
The Fourier Transform Infrared (FT-IR) spectra was verified by the Thermo Nicolet FT-IR between 4000 and 400 cm−1 using the KBr technique in an absorption mode with 32 scans. Structural interpretation was analyzed with Nuclear Magnetic Resonance (NMR), JEOL 400 MHz (JEOL, Tokyo Japan). The thermal stability was examined by Thermal Gravimetric Analysis (TGA); model TGA-STA 1500, with a heating rate 10 °C cm−1 between 25 and 900 °C under nitrogen atmosphere (Perkin Elmer, Massachusetts, USA) The X-ray diffraction (XRD) patterns were verified using an Empyrean X-ray diffractometer using Cu Kα radiation (λ = 1.5418Δ) at a scan rate of 0.02 s−1. The morphological analysis of the synthesized products was executed using Transmission Electron Microscopy (TEM) on FEI CM12 instrument. The Brunauer–Emmett–Teller (BET) analysis was carried out via surface area analyzer (Quantachrome, Boynton Beach, FL, USA) to determine specific surface area and pore diameter of nanosorbents. High performance thin layer chromatography (HPTLC, LINOMAT 5, CAMAG, Muttenz, Switzerland) was used to verify the purity of compounds. An Accumet AB150 pH meter (Fisher Scientific) was used for the pH measurements. A Perkin Elmer, Model Lambda 25 Ultraviolet-Visible (UV-Vis) spectrophotometer (Massachusettes, U.S.), equipped with 1 cm quartz cells at 554 nm was used for removal of RB. The parameters set for measurements were wavelength accuracy ± 0.5 nm, bandwidth 1.0 nm, and scan speed 400 nm min−1.2.4 Standard and working solutions
The standard stock solution of RB (1000 mg L−1) was prepared in acetonitrile (ACN) and stored in a refrigerator to avoid the degradation process. The working standard solutions containing all the analytes were freshly prepared by dilution of the stock solutions with ultrapure water.2.5 Batch experiments
 | (1) |
 | (2) |
2.6 Real sample analysis
Environmental water was collected by using schott glass bottles in various places in Penang, Malaysia which are tap water allocation nearby the dye industry, industrial waste water at painting industry and lake water samples nearby with industrial waste water treatment. The reason of collection point for water samples from industrial waste water because industrial painting using dyes extensively. For collection of the lake water due to place nearest to industrial waste water treatments. Moreover, tap water sample was collected to investigate the matrix effect for the removal of RB from aqueous solution. All the water samples were filtered immediately using a nylon 0.45 μm membrane. The desired pH 1 with 60 min of contact time was selected for the real sample analysis. The spiking concentration for real sample analysis was 80 mg L−1 at room temperature as equilibrium conditions for MNP-PANI-DICAT. RSD were achieved using three different vials as triplicates (n = 3).2.7 Reusability for adsorption study
To examine the probability of recycling and renewing the sorbent (MNP-PANI-DICAT) five cycles of adsorption experiments were carried out using the same adsorbent. Each recycling process started after the material was washed with acetonitrile (ACN) and then dried before each removal process.3 Result and discussions
3.1 Characterization of materials
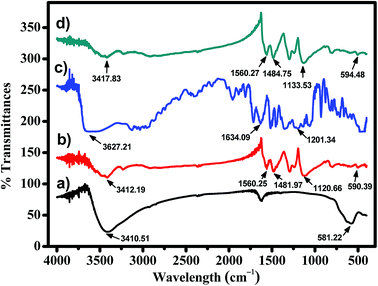
The FT-IR spectra in Fig. 2 show several additional peaks in the spectrum of MNP-PANI-DICAT, proportional to the MNPs and MNP-PANI spectrum, indicating a successful coating process of DICAT on MNP-PANI. Fe–O and O–H stretching vibrations on MNPs spectrum focusing at peaks 581.22 cm−1 and 3410.51 cm−1, respectively. The presence of C![[double bond, length as m-dash]](https://www.rsc.org/images/entities/char_e001.gif) C aromatic ring of PANI was showed in MNP-PANI (1481.97 cm−1) and MNP-PANI-DICAT (1484.25 cm−1). Moreover, peak of quinoid (N
C aromatic ring of PANI was showed in MNP-PANI (1481.97 cm−1) and MNP-PANI-DICAT (1484.25 cm−1). Moreover, peak of quinoid (N![[double bond, length as m-dash]](https://www.rsc.org/images/entities/char_e001.gif) C
C![[double bond, length as m-dash]](https://www.rsc.org/images/entities/char_e001.gif) N) ring of PANI, was observed in MNP-PANI (1293.20 cm−1) and MNP-PANI-DICAT (1298.51 cm−1), which further proves the coating of PANI on MNP. Upon the loading of DICAT-NTF2, the C–N aromatic ring of ionic liquid was clearly observed at 1133.53 cm−1 in the FT-IR spectrum of MNP-PANI-DICAT. The strong N–H bond of MNP-PANI and MNP-PANIDICAT on aromatic ring at 1560 cm−1 showed that aniline was in the polymer network structure. Hence, the FT-IR analysis clearly proved that the formation of MNP-PANI-DICAT was successful.
N) ring of PANI, was observed in MNP-PANI (1293.20 cm−1) and MNP-PANI-DICAT (1298.51 cm−1), which further proves the coating of PANI on MNP. Upon the loading of DICAT-NTF2, the C–N aromatic ring of ionic liquid was clearly observed at 1133.53 cm−1 in the FT-IR spectrum of MNP-PANI-DICAT. The strong N–H bond of MNP-PANI and MNP-PANIDICAT on aromatic ring at 1560 cm−1 showed that aniline was in the polymer network structure. Hence, the FT-IR analysis clearly proved that the formation of MNP-PANI-DICAT was successful.
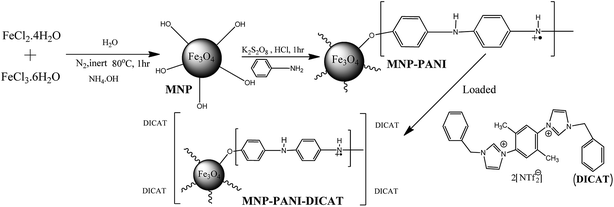
Microscopic morphological structures were performed by using TEM technique to determine and compare the surface features of MNP, MNP-PANI and MNP-PANI-DICAT. Based on TEM analysis as shown in Fig. S2 (ESI†), average diameter of the particles as found to be in the increasing in the order of MNP (4.6 nm), MNP-PANI (5.0 nm) and MNP-PANI-DICAT (6.8 nm). Furthermore, ionic liquid itself increased the particles size, which can give more binding sites on the MNP-PANI-DICAT due to dicationic IL which have larger cation on it that can increase the size particles of the materials.25 This phenomenon could be related in BET analysis that MNP-PANI-DICAT have heterogeneous surface with aniline polymer and imidazolium on top of magnetic core–shell.
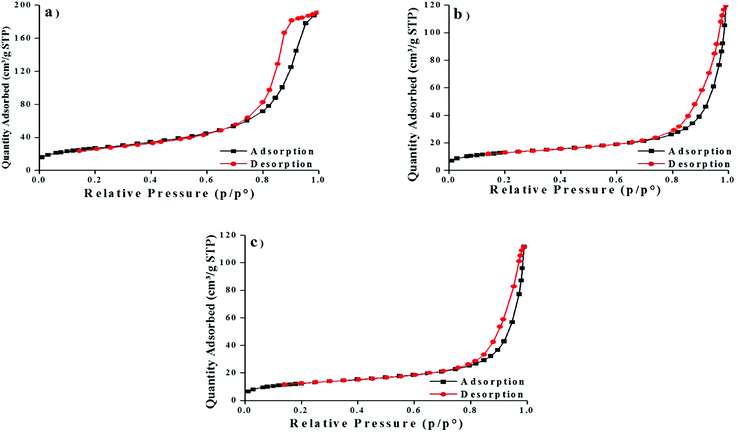
The BET surfaces area showed high volume of adsorption on MNP than MNP-PANI and MNP-PANI-DICAT which indicated MNP (96.9882 m2 g−1) has larger surface area compared to MNP-PANI (46.9048 m2 g−1) and MNP-PANI-DICAT (45.1510 m2 g−1), respectively as shown in Fig. 3. This finding could be related with the covering of the adsorption sites by organic moieties which have immobilized on the surface of MNPs and further hindered the N2 molecules from accessing to the binding site.14 Meanwhile, pore diameters which calculated from Barret–Joyner–Halenda model (BJH) were found to be increasing from MNP, MNP-PANI and MNP-PANI-DICAT which existed in the mesoporous region. Mesoporous materials (between 2 and 50 nm) which have pore size between microporous (smaller than 2 nm) and macroporous (larger than 50 nm) materials. Mesoporous materials itself have more advantages such high surface area, a lot of pore volume on materials and have good stability compared to microporous and macroporous materials.
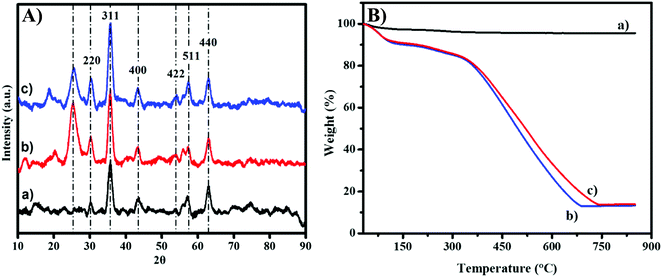
The crystallinity analysis was conducted by using X-ray powder diffraction (XRD) as plotted in Fig. 4A. The diffraction peaks of MNP-PANI and MNP-PANI-DICAT are sharp and slightly wider than unmodified MNPs, could be due to the present of amorphous and polymeric materials coated on the surfaces of MNPs.26 Native MNPs indicated good crystallinity, with diffraction peaks appearing at the 2θ values of 30.5°, 36.5°, 43.6°, 54.3°, 57.4° and 63.0° which can be allocated to the (220), (311), (400), (422), (511) and (440) cubic spinel planes of Fe3O4, respectively according to JCPDS card number 88-0866.27 Furthermore, the intensity of diffraction peaks, MNP-PANI and MNP-PANI-DICAT were observed to be increase in crystalline phase which proved that the product is successfully formed.28
Meanwhile, MNP, MNP-PANI and MNP-PANI-DICAT were undergo analysis by using Thermo-Gravimetric Analysis (TGA) to measure a compound's thermal stability. Fig. 4B and Table S2 (ESI†) shows the weight-loss curves for MNP-PANI and MNP-PANI-DICAT involve a few steps process and for native MNPs only one step process. Generally, the first step can be interpreted due to the loss of water, the second step may account for most weight of the polymer. Native MNPs do not show the significant weight loss until it reaches elevated temperature. Fig. 4B, showed that the second degradation stage of MNP-PANI-DICAT polymer can be sustain at higher temperature (364–739 °C) with low weight loss (66.6%), which further proved that MNP-PANI-DICAT polymer is more stable than MNP-PANI and native MNPs. Furthermore, the higher stability could be due to strong interaction between polyaniline and dicationic ionic liquid on core of MNP, which make it more stable at higher temperature.
3.2 Preliminary adsorption studies
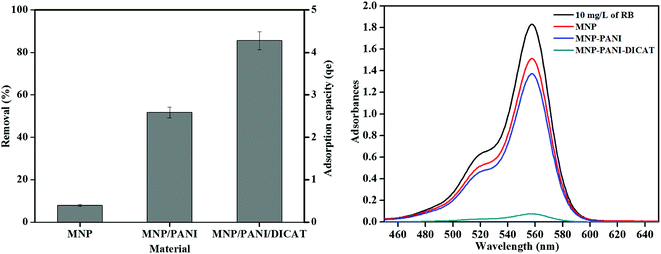
The synthesized magnetic nanoparticles have been applied in the adsorption of rhodamine B (RB) and the performance of MNP-PANI-DICAT, MNP-PANI and native MNPs was compared. The percentage of removal of RB by using the synthesized magnetic nanoparticles was presented in Fig. 5. Based on the graph, MNP-PANI showed higher removal percentage and adsorption capacity that might due to aniline polymer that coating around magnetic nanoparticles that allow it increased in term of porosity of the adsorbent to attract and captured more RB particles toward it. It was also found that the MNP-PANI-DICAT exhibits higher percentage of removal (%) and adsorption capacity (qe) compared to the native MNPs and MNP-PANI due to the presence of dicationic ionic liquid in MNP-PANI-DICAT polymer that might increase the selectivity towards RB. Furthermore, higher percentage of removal was observed due to strong π–π interaction between the aromatic ring of RB and imidazolium ring in MNP-PANI-DICAT.3.3 Effect of pH
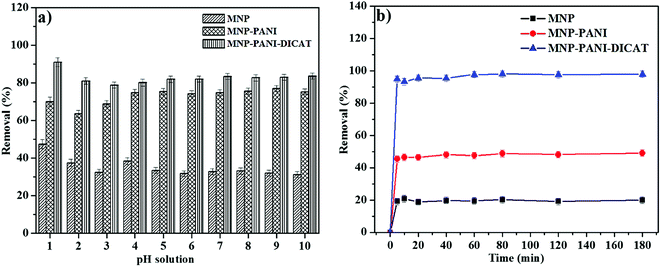
One of the extreme crucial features in adsorption investigations, which has been described by many researchers, is the substantial role of pH in adsorption efficiency. The effect of pH on the adsorption of RB using MNP-PANI-DICAT was studied by varying the pH of RB solution from pH 1 to pH 10. Based on results in Fig. 6a, maximum percentage removal of RB was obtained in an aqueous solution at lowest pH (pH 1) probably because lower pH created more H+ ions surrounded the surface of the MNP-PANI-DICAT.29,30 In term of sorption state properties, the influence of pH toward RB solution on the surface of MNP-PANI-DICAT at lower pH ranges leads to chemisorption state along with physisorption state.31Based observation, the percentage removal of RB in an aqueous solution was slightly reduced while, increased of pH until pH 3 and not significantly increased from pH 4 to 10.32 This is because the presence of OH− groups changed the form of RB structure. At this condition, the zwitterionic form of RB in the solution were formed that might change the properties of RB which may lead to aggregation into larger molecules form (dimer) of RB in solution.32 Thus, this created difficulty for the dimer RB to enter the pore structure on surface of MNP-PANI-DICAT. Moreover, chemisorption along with physisorption state of RB tend to occur at higher pH.31 Some comparable results have been testified in the literature.33–35
The maximum sorption capacity of RB by MNP-PANI-DICAT at pH 1 make it as an excellent sorbent compared to MNP-PANI and native MNPs.
3.4 Effect of contact times
The time ranges effect was examined from 5 to 180 min for the removal of RB using MNP-PANI-DICAT. As shown in Fig. 6b, it detained RB was increase at first 5 min until 60 min since more adsorption sites available at MNP-PANI-DICAT and the percentage of removal went up to 95%. The MNP-PANI and native MNPs shows increment until it reaches equilibrium point at 60 min with 47.6% and 20% of removal, respectively. By further increment from 80 to 180 min, no significant changes were observed in percentage of removal that could be due to saturated binding sites on surface of MNP-PANI-DICAT and same trend was obtained for MNP-PANI as well. As for MNP, 20% removal of RB was observed up to 180 min due to less of number pores and this will reduce the adsorption sites that available on surface of MNP compared to MNP-PANI and MNP-PANI-DICAT.Effect of contact time was also presented by referring to UV-Vis spectrum for the removal of RB by MNP, MNP-PANI and MNP-PANI-DICAT in Fig. S3 (ESI†). The absorbance values were found to be decrease as the adsorption time increase, and this can be obviously seen for MNP-PANI-DICAT. In this work, the percentage removal of RB was found to obtained equilibrium at 60 min for all the studied adsorbents. Therefore, 60 min was selected as an optimum time for this adsorption process.
3.5 Adsorption kinetic models
The kinetic and mechanism parameters were investigated for the adsorption of RB onto native MNPs, MNP-PANI and MNP-PANI-DICAT. Five several types of models were carried out which are pseudo first order,9,36,37 pseudo second order,38 Elovich,39 intra particles and external diffusion model.40 The normalized standard deviation value, Δq (%) which determined from eqn (3) and relative error (%) determined from eqn (4) were acquired to define the fitness of the model to designate the adsorption kinetics, which definite as:
 | (3) |
 | (4) |
 | (5) |
 | (6) |
 | (7) |
The plot of  versus t gives a straight line with
  and
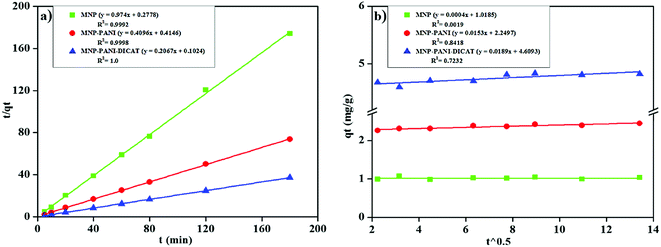
and  as the slope and intercept if pseudo second order is applicable. k2 and qe can be obtained directly from the graph without having to know the parameters previously. This kinetic model is more likely to apply onto the whole range of adsorption studies and it shows that chemisorption is the rate determining step.38,43 The kinetic parameters of different models are shown in Table 1 with correlation of determination (R2), normalized standard deviation, Δq (%) and relative error (%) for the adsorption of RB. Based on Table 1, the well fitted model is pseudo second order kinetics model with lower Δq value and relative error (MNPs = 1.8580% and 4.9158%, MNP-PANI = 0.0023% and 0.0061%, MNP-PANI-DICAT = 0.2066% and 0.5467%), respectively. Moreover, the calculated qe values were closely fitted the experimental data. The correlation of determination (R2) values ranging from 0.9992–1.0000, which further supported that the adsorption of RB on the MNP-PANI-DICAT followed the pseudo second order model (Fig. 7a). In comparison, pseudo first order model shows the enormous difference between the experimental and the calculated adsorption capacity for RB that represented by Δq (%) as shown in Table 1.
| Kinetic models | Parameters | Materials | ||
|---|---|---|---|---|
| MNP | MNP-PANI | MNP-PANI-DICAT | ||
| qe,exp (mg g−1) | 1.0798 | 2.4416 | 4.8116 | |
| Pseudo-first-order | qe,cal (mg g−1) | 0.1532 | 0.0720 | 0.1622 |
| k1 (min−1) | 0.0085 | −0.0058 | −0.0023 | |
| R2 | 0.2415 | 0.0867 | 0.0058 | |
| Δq (%) | 32.4340 | 36.6820 | 36.5220 | |
| Relative error (%) | 85.8120 | 97.0530 | 96.6290 | |
| Pseudo-second-order | qe, cal (mg g−1) | 1.0267 | 2.4414 | 4.8379 |
| k2 (g mg−1 min−1) | 3.4149 | 0.4047 | 0.4172 | |
| h (mg g−1 min−1) | 3.5597 | 2.4119 | 9.7656 | |
| t1/2 (min) | 3.3261 | 0.1658 | 0.0862 | |
| R2 | 0.9992 | 0.9998 | 1.0000 | |
| Δq (%) | 1.8580 | 0.0023 | 0.2066 | |
| Relative error (%) | 4.9158 | 0.0061 | 0.5466 | |
| Elovich equation | qe cal (mg g−1) | 1.0215 | 2.3818 | 4.7726 |
| β (g mg−1) | 909.0910 | 20.2840 | 16.6945 | |
| α (mg g−1 min−1) | — | 7.8713 × 10¹⁷ | 3.9980 × 1031 | |
| R2 | 0.0190 | 0.9016 | 0.7433 | |
| Δq (%) | 2.0400 | 0.9242 | 0.3064 | |
| Relative error (%) | 5.3974 | 2.4452 | 0.8105 | |
| Intra-particle diffusion | C (mg g−1) | 1.0185 | 2.2497 | 4.6093 |
| K (mg g−1 min−1) | 0.0004 | 0.0153 | 0.0189 | |
| R2 | 0.0019 | 0.8418 | 0.7232 | |
| External diffusion | kext (1/min) | 7.0 × 10⁻⁶ | 0.0003 | 0.0064 |
| C (mg g−1) | −0.2185 | −0.6225 | −2.9960 | |
| R2 | 0.0026 | 0.7219 | 0.6448 | |
 | (8) |
![[thin space (1/6-em)]](https://www.rsc.org/images/entities/char_2009.gif) t, estimation of α and β can be acquired. The R2 which more than 0.74, for RB adsorption on MNP-PANI-DICAT with the calculated adsorption capacity and closeness of experimental also supported toward pseudo second order model.
t, estimation of α and β can be acquired. The R2 which more than 0.74, for RB adsorption on MNP-PANI-DICAT with the calculated adsorption capacity and closeness of experimental also supported toward pseudo second order model.
 | (9) |
![[thin space (1/6-em)]](https://www.rsc.org/images/entities/char_2009.gif) (Ct/Co) versus t. The equation of external diffusion has described as follows in eqn (10):
(Ct/Co) versus t. The equation of external diffusion has described as follows in eqn (10):
 | (10) |
In conclusion, the model was fitted well in the kinetic data for the adsorption of RB, in the order of pseudo second order kinetics > Elovich > pseudo first order kinetics. The intra particle and external diffusion model simultaneously involved in the adsorption process but it is not at rate determining step.
3.6 Effect of initial concentration (Co)
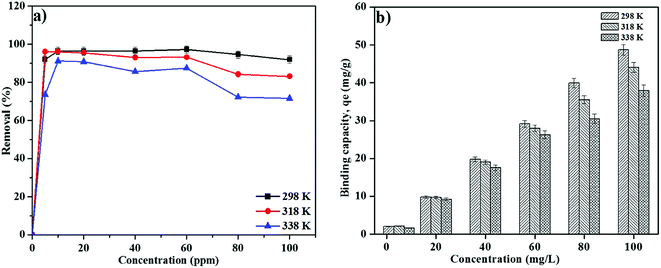
The effect of initial concentration of RB on MNP-PANI-DICAT was studied in the series of 5–100 mg L−1 at different temperatures, separately (Fig. 8a). The mesoporous on the surface of MNP-PANI-DICAT was favourable to reducing the mass transfer resistance and had become useful for fast RB adsorption. The percentage of removal for RB was found to be increase rapidly up to 10 mg L−1 and constant until 40 mg L−1. The availability of more active binding sites on the MNP-PANI-DICAT than the number of RB ions in the solution could contributed to the increasing of percentage of removal of RB. The percentage of removal achieved equilibrium at 80 mg L−1 and constantly for adsorption of RB was observed with further increase in concentration of RB. This could be due to the saturation of binding sites of MNP-PANI-DICAT toward RB ions in aqueous solution. Therefore, the concentration of 80 mg L−1 at room temperature was selected for further experiments.3.7 Effect of solution temperature
As shown in Fig. 8b the binding capacity, qe (mg g−1) of RB on MNP-PANI-DICAT was found to decline at elevated temperature in all concentrations which inspected from 5 to 100 mg L−1. Below 40 mg L−1 showed, there are no significant difference between desire temperatures. Fig. 8b indicates below 60 mg L−1 concentration of RB, slightly difference on adsorption capacity between three different temperatures was observed, but at higher than 60 mg L−1 concentration of RB, adsorption capacity was found to be optimum at 298 K. Furthermore, at higher temperatures, it might reduce the tendency to be adsorbed on binding sites of MNP-PANI-DICAT adsorbent due to agitation or degradation of RB solution. Hence, 298 K was set up to be the equilibrium temperature for the removal of RB using MNP-PANI-DICAT adsorbent.3.8 Adsorption isotherm models
The interaction between adsorbate with an adsorbent was investigated by using adsorption isotherm models. Thus, the results obtained from the equilibrium isotherm studies is essential to evaluate the affinity of adsorbent and adsorbate in aqueous solution. There are few tested modelling was carried out in past which are Langmuir,44,45 Freundlich,46 Temkin,47 Dubinin–Radushkevich's,48 and Halsey,49 isotherm equations.The equilibrium of the adsorption of sorbate on the surfaces of an adsorbent at a given pH and temperatures was described by using adsorption isotherm models. Isotherm study can barely describe based on plotting of the compound concentration stability in the adsorbent as a function of its equilibrium concentration solution.50 R2 value which is adjoining to unity demonstrates that the isotherm model contributes the perfect fit to the investigational data.
The isotherm adsorption model was used to describe how sorbates interact with the adsorbent by optimizing the use of the adsorbent. In this study, Langmuir, Freundlich, Dubinin–Radushkevich, Temkin and Halsey models have been studied.
 | (11) |
 | (12) |
| Isotherm models | Parameters | Temperatures (K) | ||
|---|---|---|---|---|
| 298 K | 318 K | 338 K | ||
| Langmuir | qm (mg g−1) | 109.8901 | 51.0204 | 59.5238 |
| b (L mg−1) | 0.1102 | 0.2444 | 0.0558 | |
| R2 | 0.3000 | 0.9815 | 0.5169 | |
| RL | 0.1019 | 0.0487 | 0.1830 | |
| Freundlich | KF ((mg g−1) (L mg−1)1/n) | 10.7275 | 8.4217 | 3.7783 |
| nF | 1.1192 | 1.5741 | 1.3589 | |
| 1/n | 0.8935 | 0.6353 | 0.7359 | |
| R2 | 0.8664 | 0.9615 | 0.8103 | |
| Temkin | KT (L mg−1) | 3.4470 | 4.7050 | 1.4136 |
| bT (kJ mol−1) | 172.2090 | 295.0040 | 294.4980 | |
| R2 | 0.9767 | 0.9560 | 0.9555 | |
| Dubinin–Radushkevich | qm (mg g−1) | 37.2369 | 25.9404 | 24.2617 |
| β (mol2 kJ−2) | 0.2199 | 0.1096 | 0.5079 | |
| R2 | 0.9069 | 0.8622 | 0.7104 | |
| E | 4.2650 | 6.0412 | 2.8063 | |
| Halsey | N | −1.1192 | −1.5741 | −1.3588 |
| K | 0.0703 | 0.0349 | 0.1643 | |
| R2 | 0.8664 | 0.9615 | 0.8103 | |
A value of 0 < RL < 1 shows favorable adsorption conditions;
RL > 1 shows unfavorable adsorption conditions;
RL = 1 shows linear adsorption conditions; and
RL = 0 shows irreversible adsorption conditions.
![[thin space (1/6-em)]](https://www.rsc.org/images/entities/char_2009.gif) qe versus log
qe versus log![[thin space (1/6-em)]](https://www.rsc.org/images/entities/char_2009.gif) Ce. The Freundlich linear type isotherm is as demonstrated as follows in eqn (13):
Ce. The Freundlich linear type isotherm is as demonstrated as follows in eqn (13):
 | (13) |
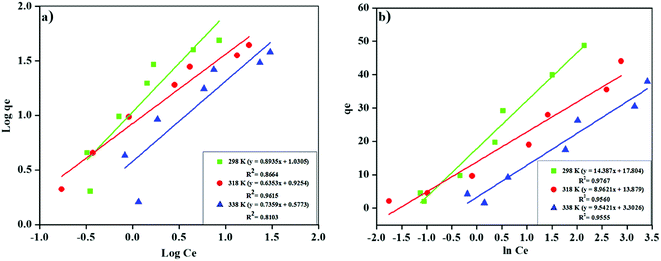
Freundlich's model result showed (Fig. 9a), is supported with R2 > 0.81 that the MNP-PANI-DICAT has heterogeneous surfaces as shown in Table 2. The Freundlich constant, KF values for the adsorption capacity of RB presented a reduction with the elevated temperature determined as 10.728, 8.421, and 3.778 for 298 K, 318 K, and 338 K correspondingly, which indicated that the adsorption process was exothermic. The n values that represent of Freundlich constants were in the range of 2 > n > 1 for the adsorption of RB at all the different temperatures, showing that pseudo-linear of the model.
ln![[thin space (1/6-em)]](https://www.rsc.org/images/entities/char_2009.gif) qe = ln qe = ln![[thin space (1/6-em)]](https://www.rsc.org/images/entities/char_2009.gif) qm − βε2 qm − βε2
| (14) |
![[thin space (1/6-em)]](https://www.rsc.org/images/entities/char_2009.gif) qe versus ε2 and ε, the Polanyi potential, can be intended by the subsequent equation in eqn (15):
qe versus ε2 and ε, the Polanyi potential, can be intended by the subsequent equation in eqn (15):
ε = RT![[thin space (1/6-em)]](https://www.rsc.org/images/entities/char_2009.gif) ln[1 + 1/Ce] ln[1 + 1/Ce]
| (15) |
| E = 2β−0.5 | (16) |
The designed value of β < 1.0 from Dubinin–Radushkevich's isotherm model of MNP-PANI-DICAT for the adsorption of RB represented a rough surface and multilayers structure.
qe = ln![[thin space (1/6-em)]](https://www.rsc.org/images/entities/char_2009.gif) KT + β KT + β![[thin space (1/6-em)]](https://www.rsc.org/images/entities/char_2009.gif) ln ln![[thin space (1/6-em)]](https://www.rsc.org/images/entities/char_2009.gif) Ce Ce
| (17) |
![[thin space (1/6-em)]](https://www.rsc.org/images/entities/char_2009.gif) Ce, constant KT and bT can be instigate from the intercept and slope. The bT (J mol−1) is Temkin constant related to the heat of adsorption, while KT (L mg−1) represents Temkin constant associated to the equilibrium binding energy. Adsorption isotherms of RB on MNP-PANI-DICAT were better fitted by Temkin's model with R2 > 0.95 for all the calculated temperatures as shown in Fig. 9b. The adsorption was characterized by a uniform distribution of binding energies, up to some maximum binding energy and the heat of adsorption of all the molecules in the layer would decrease linearly with coverage. This shows that MNP-PANI-DICAT has multilayers surface with polymeric polyaniline and imidazolium ring. Therefore, it can predictable that the adsorption system with exist with dissimilar types of interaction such as π–π interaction and hydrogen bonding.
Ce, constant KT and bT can be instigate from the intercept and slope. The bT (J mol−1) is Temkin constant related to the heat of adsorption, while KT (L mg−1) represents Temkin constant associated to the equilibrium binding energy. Adsorption isotherms of RB on MNP-PANI-DICAT were better fitted by Temkin's model with R2 > 0.95 for all the calculated temperatures as shown in Fig. 9b. The adsorption was characterized by a uniform distribution of binding energies, up to some maximum binding energy and the heat of adsorption of all the molecules in the layer would decrease linearly with coverage. This shows that MNP-PANI-DICAT has multilayers surface with polymeric polyaniline and imidazolium ring. Therefore, it can predictable that the adsorption system with exist with dissimilar types of interaction such as π–π interaction and hydrogen bonding.
 | (18) |
![[thin space (1/6-em)]](https://www.rsc.org/images/entities/char_2009.gif) qe versus ln
qe versus ln![[thin space (1/6-em)]](https://www.rsc.org/images/entities/char_2009.gif) Ce of Halsey's model indicate the heteroporosity (macropore and mesopore) of the adsorbents. Hasley's model also supported which recommended adsorption of RB on the heterogeneous surfaces of MNP-PANI-DICAT.
Ce of Halsey's model indicate the heteroporosity (macropore and mesopore) of the adsorbents. Hasley's model also supported which recommended adsorption of RB on the heterogeneous surfaces of MNP-PANI-DICAT.Table 2 showed the experimental equilibrium data for the adsorption of RB on MNP-PANI-DICAT at different temperatures. In nutshell, the acceptability of the isotherm models to the adsorption behaviour was intermediated via R2 values. Consequently, the data of adsorption equilibrium was fitted the isotherm models in the order of Temkin > Freundlich > Halsey > Dubinin–Radushkevich's > Langmuir on behalf of the adsorption of RB on MNP-PANI-DICAT.
3.9 Adsorption thermodynamics
Gibb's free energy change (ΔG°) was calculated via eqn (19), while entropy change (ΔS°) and enthalpy change (ΔH°) were designed from the slope and intercept of the Van't Hoff plot (ln![[thin space (1/6-em)]](https://www.rsc.org/images/entities/char_2009.gif) kd versus 1/T) using eqn (20) as shown below:35,54
kd versus 1/T) using eqn (20) as shown below:35,54
ΔG° = −RT![[thin space (1/6-em)]](https://www.rsc.org/images/entities/char_2009.gif) ln ln![[thin space (1/6-em)]](https://www.rsc.org/images/entities/char_2009.gif) kd kd
| (19) |
 | (20) |
 | (21) |
Table 3 reviewed the thermodynamic parameters for the adsorption of RB on MNP-PANI-DICAT showed that the result of ΔG° was found to be negative values for the adsorption of RB, which indicated that MNP-PANI-DICAT was undergo process of the thermodynamically feasible and chemically controlled at lower temperature.35,54 It also indicated that the adsorption process of RB on the surface of MNP-PANI-DICAT was spontaneous.
| T (K) | ln![[thin space (1/6-em)]](https://www.rsc.org/images/entities/char_2009.gif) kd kd |
Enthalpy, ΔH (J mol−1) | Entropy, ΔS (J K−1 mol−1) | Gibbs energy, ΔG (kJ mol−1) |
|---|---|---|---|---|
| 298 | 2.1815 | −40.4094 | −117.9258 | −5404.8362 |
| 318 | 0.9812 | −2594.0980 | ||
| 338 | 0.2589 | −727.5547 |
Upon this, the enthalpy process (ΔH°) showed the negative value (−40.41) which indicated that the adsorption process was exothermic. This also be maintained by the diminished of the KF values in Freundlich's model, with the decreased of uptake capacity of the sorbent with the increase of the temperature as shown in Table 2. Negative value of ΔH° explained that the adsorption process undergoes physisorption and chemisorption of RB on MNP-PANI-DICAT.
Meanwhile, the negative value of entropy, (ΔS°) was obtained due to decreasing of randomness at solid-solution interface during adsorption process of RB on MNP-PANI-DICAT.56
3.10 Analysis of real samples
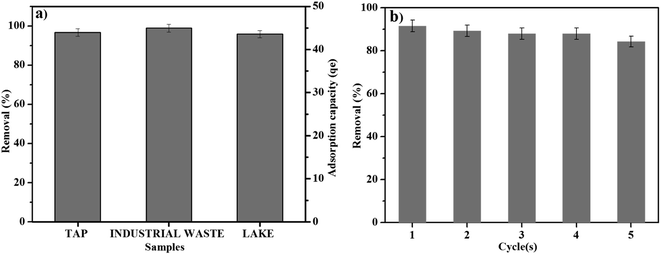
The removal of RB by using MNP-PANI-DICAT in real sample solutions was carried out. The percentage of removal of RB was shown in Fig. 10a for water samples prior to UV-Vis analysis. This spiking analysis using 80 mg L−1 of RB solution tested for matrix effect between adsorbent and adsorbate in real water samples. Based on graph, more that 90% of removal of RB indicated that no significant matrix effect in aqueous solutions was observed. Moreover, the adsorption capacity (qe) for the all real water samples were found to be more than 40 which indicates good binding capacity of MNP-PANI-DICAT (adsorbent) toward RB solution (adsorbate).3.11 Reusability of MNP-PANI-DICAT
Reusability process was beginning after the adsorbent was fully washed with ethyl acetate and then dried 1 hour at 40 °C before the next removal process that slightly modified method from previous articles reported.57–59 Based on Fig. 10b, the excellent performance toward removal efficiency was observed which demonstrated good reusability and stability up to 5 cycles of MNP-PANI-DICAT in the removal procedure toward RB sample solution.3.12 Comparison of different sorbents
The developed new material (MNP-PANI-DICAT) was compared with other sorbents and summarized in Table 4. The developed method was exhibits high adsorption capacities (qe), with lower sorbent dosage and equilibrium time (qt) compared to other previous works. Thus, MNP-PANI-DICAT was considered as a capable sorbent for the removal of RB in aqueous samples.4 Conclusion
In conclusion, MNP-PANI-DICAT was successfully evaluated as an adsorbent for the adsorption of RB from an aqueous solution. Kinetic analysis showed that pseudo second order equation was best fitted with higher correlation for the adsorption of RB with correlation of determination (R2) values ranging from 0.9992–1 for the adsorption data with 60 min being the equilibrium time. The isotherm studies were carried out with Langmuir, Freundlich, Temkin, Dubinin–Radushkevich's and Hasley's models to investigate the adsorption behaviour. From the data, Temkin isotherm model was selected as best fitted among other models with R2 > 0.95 for all studied temperatures for the adsorption of RB on MNP-PANI-DICAT. On the other hand, the negative value of ΔH° (−40.4094) indicated that the adsorption process of RB was exothermic. Meanwhile, the negative value of ΔS° (−117.9258) was obtained due to decreasing of randomness at solid-solution interface during the adsorption process. The values of ΔG° for the adsorption of RB was found to be negative which showed that the process was chemically controlled, thermodynamically feasible, and spontaneous nature of the adsorption processes on MNP-PANI-DICAT.Conflicts of interest
The authors have declared that no conflict of interest.Acknowledgements
The authors would like to seize this opportunity to express their gratitude to Universiti Sains Malaysia of Research University Grant (RU:1001/CIPPT/811322) and Fundamental Research Grant Scheme (FRGS:203/CIPPT/6711557) for the assistance and financial support. The authors acknowledge the Advanced Medical and Dental Institute (AMDI), Universiti Sains Malaysia for the facilities provided. The authors also acknowledge University of Malaya for the research collaboration through University of Malaya Research Grant (UM:RG381-17AFR) and the Ministry of Higher Education Malaysia (MOHE) for providing the MyBrain scholarship to one of the authors-cum-researchers, Mr Mohamad Shariff bin Shahriman.References
- S. Rangabhashiyam, N. Anu and N. Selvaraju, J. Environ. Chem. Eng., 2013, 1, 629–641 CrossRef CAS.
- G. Muthuraman and T. T. Teng, J. Ind. Eng. Chem., 2009, 15, 841–846 CrossRef CAS.
- X. Xue, K. Hanna and N. Deng, J. Hazard. Mater., 2009, 166, 407–414 CrossRef CAS PubMed.
- Y. Wang, Y. Sun, Y. Gao, B. Xu, Q. Wu, H. Zhang and D. Song, Talanta, 2014, 119, 268–275 CrossRef CAS PubMed.
- Y. Zhou, X. Wang, M. Zhang, Q. Jin, B. Gao and T. Ma, Cellulose, 2014, 21, 2797–2809 CrossRef CAS.
- H. Qiao, Y. Zhou, F. Yu, E. Wang, Y. Min, Q. Huang, L. Pang and T. Ma, Chemosphere, 2015, 141, 297–303 CrossRef CAS PubMed.
- A. K. Gupta and M. Gupta, Biomaterials, 2005, 26, 3995–4021 CrossRef CAS PubMed.
- I. J. Bruce and T. Sen, Langmuir, 2005, 21, 7029–7035 CrossRef CAS PubMed.
- E. K. Larsen, T. Nielsen, T. Wittenborn, H. Birkedal, T. Vorup-Jensen, M. H. Jakobsen, L. Ostergaard, M. R. Horsman, F. Besenbacher and K. A. Howard, ACS Nano, 2009, 3, 1947–1951 CrossRef CAS PubMed.
- C. Gill, B. Price and C. Jones, J. Catal., 2007, 251, 145–152 CrossRef CAS.
- X. Du, J. He, J. Zhu, L. Sun and S. An, Appl. Surf. Sci., 2012, 258, 2717–2723 CrossRef CAS.
- L. Xia, Z. Wei and M. Wan, J. Colloid Interface Sci., 2010, 341, 1–11 CrossRef CAS PubMed.
- J. L. Anderson, D. W. Armstrong and G.-T. Wei, Anal. Chem., 2007, 79, 4247 CrossRef CAS.
- M. Raoov, S. Mohamad and M. R. Abas, Int. J. Mol. Sci., 2014, 15, 100–119 CrossRef PubMed.
- C. Yao, W. R. Pitner and J. L. Anderson, Anal. Chem., 2009, 81, 5054–5063 CrossRef CAS PubMed.
- Q. Zhao, J. Eichhorn, W. R. Pitner and J. L. Anderson, Anal. Bioanal. Chem., 2009, 395, 225–234 CrossRef CAS PubMed.
- Y. Meng and J. L. Anderson, J. Chromatogr. A, 2010, 1217, 6143–6152 CrossRef CAS PubMed.
- A. B. McEwen, H. L. Ngo, K. LeCompte and J. L. Goldman, J. Electrochem. Soc., 1999, 146, 1687–1695 CrossRef CAS.
- F. Endres and S. Z. El Abedin, Phys. Chem. Chem. Phys., 2006, 8, 2101–2116 RSC.
- M. Galiński, A. Lewandowski and I. Stępniak, Electrochim. Acta, 2006, 51, 5567–5580 CrossRef.
- S. Seki, Y. Kobayashi, H. Miyashiro, Y. Ohno, A. Usami, Y. Mita, N. Kihira, M. Watanabe and N. Terada, J. Phys. Chem. B, 2006, 110, 10228–10230 CrossRef CAS PubMed.
- A. Chinnappan and H. Kim, Chem. Eng. J., 2012, 187, 283–288 CrossRef CAS.
- A. H. Jadhav and H. Kim, Chem. Eng. J., 2012, 200, 264–274 CrossRef.
- M. S. Shahriman, M. R. Ramachandran, N. N. M. Zain, S. Mohamad, N. S. A. Manan and S. M. Yaman, Talanta, 2017, 178, 211–221 CrossRef PubMed.
- M. Raoov, S. Mohamad and M. R. Abas, J. Hazard. Mater., 2013, 263, 501–516 CrossRef CAS PubMed.
- L. F. Cótica, I. A. Santos, E. M. Girotto, E. V. Ferri and A. A. Coelho, J. Appl. Phys., 2010, 108, 064325 CrossRef.
- S. Giri, B. G. Trewyn, M. P. Stellmaker and V. S. Y. Lin, Angew. Chem., Int. Ed., 2005, 44, 5038–5044 CrossRef CAS PubMed.
- J. Jayabharathi, P. Ramanathan, V. Thanikachalam and C. Karunakaran, New J. Chem., 2015, 39, 3801–3812 RSC.
- A. V. Deshpande and U. Kumar, J. Non-Cryst. Solids, 2002, 306, 149–159 CrossRef CAS.
- Y. Guo, J. Zhao, H. Zhang, S. Yang, J. Qi, Z. Wang and H. Xu, Dyes Pigm., 2005, 66, 123–128 CrossRef CAS.
- P. S. Nayak, B. Singh and S. Nayak, J. Environ. Prot. Sci., 2007, 1, 83–91 Search PubMed.
- A. Ghanadzadeh, M. Zanjanchi and R. Tirbandpay, J. Mol. Struct., 2002, 616, 167–174 CrossRef CAS.
- V. K. Gupta, D. Mohan, S. Sharma and M. Sharma, Sep. Sci. Technol., 2000, 35, 2097–2113 CrossRef CAS.
- M. Doğan, M. Alkan, A. Türkyilmaz and Y. Özdemir, J. Hazard. Mater., 2004, 109, 141–148 CrossRef PubMed.
- J. Anandkumar and B. Mandal, J. Hazard. Mater., 2011, 186, 1088–1096 CrossRef CAS PubMed.
- J. Febrianto, A. N. Kosasih, J. Sunarso, Y.-H. Ju, N. Indraswati and S. Ismadji, J. Hazard. Mater., 2009, 162, 616–645 CrossRef CAS PubMed.
- S. Memon, N. Memon, S. Memon and Y. Latif, J. Hazard. Mater., 2011, 186, 1696–1703 CrossRef CAS PubMed.
- Y. Ho, G. McKay, D. Wase and C. Forster, Adsorpt. Sci. Technol., 2000, 18, 639–650 CrossRef CAS.
- M. d. M. C. López, M. C. Pérez, M. S. D. García, J. M. L. Vilarino, M. V. G. Rodríguez and L. F. B. Losada, Anal. Chim. Acta, 2012, 721, 68–78 CrossRef PubMed.
- W. J. Weber and J. C. Morris, J. Sanit. Eng. Div., 1963, 89, 31–60 Search PubMed.
- F. Shaarani and B. Hameed, Chem. Eng. J., 2011, 169, 180–185 CrossRef CAS.
- S. Lagergren, K. Sven. Vetenskapsakad. Handl., 1898, 24, 1–39 Search PubMed.
- G. Crini, H. N. Peindy, F. Gimbert and C. Robert, Sep. Purif. Technol., 2007, 53, 97–110 CrossRef CAS.
- I. Langmuir, J. Am. Chem. Soc., 1918, 40, 1361–1403 CrossRef CAS.
- V. Garg, R. Gupta, A. B. Yadav and R. Kumar, Bioresour. Technol., 2003, 89, 121–124 CrossRef CAS PubMed.
- G. Mckay, H. Blair and J. Gardner, J. Appl. Polym. Sci., 1982, 27, 3043–3057 CrossRef CAS.
- M. Temkin and V. Pyzhev, Acta Phys.-Chim. Sin., 1940, 12, 217–222 Search PubMed.
- M. Dubinin and L. Radushkevich, Chem. Zentralbl., 1947, 1, 875 Search PubMed.
- N. Oladoja, I. Ololade, J. Idiaghe and E. Egbon, Open Chem., 2009, 7, 760–768 CAS.
- A. Delle Site, J. Phys. Chem., 2001, 30, 187–439 CAS.
- K. R. Hall, L. C. Eagleton, A. Acrivos and T. Vermeulen, Ind. Eng. Chem., 1966, 5, 212–223 CAS.
- A. Shrivastava and V. B. Gupta, Chron. Young Sci., 2011, 2, 21 CrossRef.
- R.-L. Tseng and F.-C. Wu, J. Hazard. Mater., 2008, 155, 277–287 CrossRef CAS PubMed.
- P. P. Selvam, S. Preethi, P. Basakaralingam, N. Thinakaran, A. Sivasamy and S. Sivanesan, J. Hazard. Mater., 2008, 155, 39–44 CrossRef CAS PubMed.
- G. Rojas, J. Silva, J. A. Flores, A. Rodriguez, M. Ly and H. Maldonado, Sep. Purif. Technol., 2005, 44, 31–36 CrossRef CAS.
- Y. A. Aydın and N. D. Aksoy, Chem. Eng. J., 2009, 151, 188–194 CrossRef.
- A. Mehdinia, F. Roohi and A. Jabbari, J. Chromatogr. A, 2011, 1218, 4269–4274 CrossRef CAS PubMed.
- S. N. A. Baharin, N. Muhamad Sarih and S. Mohamad, Polymers, 2016, 8, 117 CrossRef.
- S. Shahabuddin, N. M. Sarih, S. Mohamad and S. N. A. Baharin, RSC Adv., 2016, 6, 43388–43400 RSC.
- H. M. Gad and A. A. El-Sayed, J. Hazard. Mater., 2009, 168, 1070–1081 CrossRef CAS PubMed.
- L. Peng, P. Qin, M. Lei, Q. Zeng, H. Song, J. Yang and J. Gu, J. Hazard. Mater., 2012, 209, 193–198 CrossRef PubMed.
- A. Thakur and H. Kaur, Int. J. Ind. Chem., 2017, 8, 175–186 CrossRef CAS.
Footnote |
| † Electronic supplementary information (ESI) available. See DOI: 10.1039/c8ra06687f |
| This journal is © The Royal Society of Chemistry 2018 |

