DOI:
10.1039/C8RA06617E
(Paper)
RSC Adv., 2018,
8, 36468-36476
Comparative analysis on adsorption properties and mechanisms of nitrate and phosphate by modified corn stalks†
Received
7th August 2018
, Accepted 15th October 2018
First published on 29th October 2018
Abstract
In this study, modified corn stalks (MCS) were successfully synthesized by grafting or crosslinking triethylenetetramine (TETA) and triethylamine (TEA) in the presence of epichlorohydrin (EPI) and N,N-dimethylformamide (DMF) for the effective removal of nitrate and phosphate. The characteristics of adsorbents were determined and the adsorption properties and mechanisms of nitrate and phosphate on MCS were studied and compared. Results from Zeta potential, elemental analysis (EA), scanning electron microscopy (SEM) and Fourier transform infrared spectroscopy (FTIR) showed that quaternary ammonium group was successfully grafted onto corn stalks (CS). Both adsorption properties and mechanisms indicated that the MCS had a better affinity to phosphate. For adsorption properties, under conditions of a dosage of 4 g L−1, pH 6.0 and an initial concentration of 50 mg L−1, the phosphate removal rate was 10.97% higher than that nitrate, and SO42− and Cl− had a larger inhibitive effect on nitrate. Mechanisms analysis included adsorption kinetics, isotherm and thermodynamics. Results indicated that the parameters of different models were closely related to the adsorption effect of nitrate and phosphate. In addition, pseudo-second-order and Freundlich model fitted both nitrate and phosphate adsorption well. The thermodynamics analysis indicated that the adsorption process was spontaneous and endothermic in nature.
1 Introduction
Excessive nitrate and phosphate that is produced by livestock wastewater,1 industrial wastewater and agricultural activities like fertilization2,3 discharging into natural aquatic environment has caused a serious environmental problem in recent years. Eutrophication is one of the most classical damages due to the enrichment of phosphate and nitrate,4 which destroys the associated habitat and further affects the biodiversity due to insufficient light penetration and dissolved oxygen. Moreover, nitrate can be converted into nitrite in human bodies and may lead to methemoglobinemia.4 As a result, according to the provisions of US Environmental Protection Agency (USEPA), the maximum concentration of nitrate–nitrogen in drinking water is 10 mg L−1 and the maximum permissible level and stringent discharge limit of phosphate is 0.1 mg L−1 and less than 0.05 mg L−1, respectively.5 Therefore, effective, economical and feasible methods for nitrate and phosphate removal are urgently needed.
Adsorption as a new technology, is considered as a potential way for the removal and recovery of low levels of phosphate and nitrate.3 Recently, cost-effective, environmental-friendly and adaptable agricultural waste based (AWB) adsorbents have received increasing attention.6 In previous researches, various agricultural wastes like rice husk,7 soybean wastes,5 wheat straw,8,9 pine sawdust10 and corn stalks (CS)11,12 were converted into biochar or anion exchangers to remove dyes, anions and metal pollutants in aqueous. During previous literature, CS were less researched compared with other agricultural wastes. However, CS are regarded as an important agricultural waste due to its high production. According to the provisions of the United States Department of Agriculture (USDA), America and China, as two major corn producers, produced over 366 and 215 million tons of corn in 2017, respectively. If the corn stalk to corn ratio is 1.2, the amount of corn stalks produced will be 258 million tons in China. The disposal of corn stalk has been a great problem as one of the major pollutant emissions due to over 20.8% crop residue open burning in China.13 Fan et al.12 showed that CS rich in cellulose could improve its adsorption capacity after chemical modification due to the introduction of functional groups onto the surface. Previous studies mainly focus on the adsorption behaviour of nitrate or phosphate by CS in a single or binary system, but fewer researchers deeply compare the similarity and difference of properties and mechanisms between nitrate and phosphate adsorption on CS and modified corn stalks (MCS). The chemical modified methods on agricultural wastes mainly introduce functional groups like heavy metals1,11 and amine groups9 to improve adsorption capacity. The later was used by many researchers due to its great adsorption capacity to anions. However, fewer researchers selected triethylenetetramine (TETA) as a quaternary ammonium group. Wang et al.11 used magnetic Fe3O4 to improve the separation of materials and then grafted quaternary ammonium group to adsorb phosphate, which is more complexed than this study due to the strict oxygen-free condition of preparing Fe3O4. The effect of nitrate adsorption was also not considered.
In this study, MCS was successfully synthesized by grafting and crossing TETA and triethylamine (TEA) in the presence of epichlorohydrin (EPI) and N,N-dimethylformamide (DMF) for the removal of nitrate and phosphate. The effectiveness of MCS was determined by a series of characterization analysis, such as Zeta potential, elemental analysis (EA), scanning electron microscopy (SEM) and Fourier Transform Infrared Spectroscopy (FTIR). Adsorption properties in both systems were evaluated by comparing the effects of dosage, pH, initial concentration and competing anions. Based on this, adsorption mechanisms of nitrate and phosphate were discussed by analysing the different parameters' values of adsorption kinetics, isotherms and thermodynamic. The purpose of this paper is to provide theoretical basis for the practical application of CS adsorbent in water to control nitrate and phosphate pollution by comparative study the adsorption properties and mechanisms of MCS.
2 Materials and methods
2.1 Materials
CS used in this study were obtained from Rongchang County (Chongqing, China). Raw CS were first washed with tap water to remove the dust and mud, and then dried at 70 °C for 24 h. After that, it was cut into short segments (1 cm) and then pulverized by a food processor into small particles with length of 0.1–0.2 mm. All reagents were analytical grade and bought in Chengdu Kelong Chemical Reagent Factory (China), including potassium nitrate (KNO3), potassium dihydrogen phosphate (KH2PO4), anhydrous sodium sulfate (Na2SO4) and potassium chloride (KCl).
2.2 Preparation of MCS
Raw CS were modified by grafting quandary ammonium groups onto cellulose chains.11 First, 2 g of CS powder was added into a three-neck flask, followed by 15 mL EPI and 10 mL DMF. The reaction was proceeded under 85 °C using water-bath heating for 60 min. Then 5 mL of TETA was added drop-wise at 75 °C and stirred for 60 min, after which 20 mL of TEA14 was added at the temperature of 80 °C and reacted for another 120 min. The product was washed alternatively by ethanol and distilled water until its pH reached neutral, then dried at 70 °C for 24 h. Dried product was grinded and sieved through 100 mesh to obtain small particles. The three-step synthesis process of preparing MCS was shown in the Fig. 1. First, using DMF as an organic solvent, EPI reacted with the hydroxyl groups on cellulose or hemicellulose chains of CS,6 forming epoxy cellulose or hemicellulose ethers.8 Then, epoxy cellulose or hemicellulose ethers crossed linked with TETA after being hydrolyzed. Finally, TEA reacted with the side chains, by which quaternary ammonium groups were grafted.
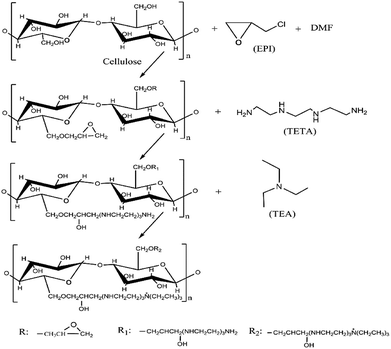 |
| | Fig. 1 Synthesis process of MCS. | |
2.3 Characteristics of CS and MCS
Van Soest methods were used to investigate the basic components of CS including cellulose, hemicellulose, lignin and ash.15 Zeta potential, EA, SEM and FTIR were performed on CS and MCS. Zeta potential was measured by the Nano particle Size and Zeta potent (Malvern Zetasizer Nano ZS90, England). Samples were prepared by mixing 0.1 g dried CS or MCS in 50 mL centrifugal tube with distilled water. Transparencies were then adjusted to 0.3–0.4 by ultraviolet spectrophotometer (TU-1810SPC, China). EA was performed to detect the elemental changes using an element analyzer (vario MACRO cube, Germany). Phenom Pro scanning electron microscope (SEM, Dutch) was used to investigate the surface structural change of CS and MSC. Samples were prepared by immobilizing powdered CS, MCS in sample holders and then coated with gold. The Spectrum 100 Fourier Transform infrared spectroscopy (FTIR, PerkinElmer in America) was used to identify functional groups in CS and MCS, scanning from 450 to 4000 cm−1. MCS after adsorption of 50 mL of 50 mg L−1 nitrate (MCS + N) or phosphate (MCS + P) for 24 h were also measured.
2.4 Adsorption test
Effects of dosage, pH, initial concentration and competing anions (Cl−, SO42−) on adsorption capacities were studied individually. For both anions, dosage effects were studied by varying the dosage from 1.0 to 6.0 g L−1 at the initial concentration of 50 mg L−1. Effects of pH were studied by adjusting initial pH from 2.0 to 11.0 using HCl (1.0 mol L−1) and NaOH (1.0 mol L−1) at the dosage of 4 g L−1. Residual concentrations and pH were measured after adsorption. The initial concentrations were adjusted to 10, 30, 50, 70, 90 mg L−1 at the dosage of 4 g L−1, while pH for nitrate and phosphate was set as 7.0 and 6.0 respectively according to previous results. As for competing anions, effects of Cl− at 30, 50 mg Cl/L, SO42− at 50, 100 mg S/L as well as combinations of Cl− (30, 50 mg Cl/L) and SO42− (50![[thin space (1/6-em)]](https://www.rsc.org/images/entities/char_2009.gif) 100 mg S/L) were investigated. Adsorption tests were all conducted using the magnetic stirrer under room temperature for 120 min. In kinetic and isotherm experiments, dosages were set as 4 g L−1 and pH was adjusted to 7.0 for nitrate and 6.0 for phosphate.
100 mg S/L) were investigated. Adsorption tests were all conducted using the magnetic stirrer under room temperature for 120 min. In kinetic and isotherm experiments, dosages were set as 4 g L−1 and pH was adjusted to 7.0 for nitrate and 6.0 for phosphate.
Parallel samples were prepared in each test, and error bars were presented in all graphs. Origin9.0 was used for plotting and data analysis. Concentrations of nitrate and phosphate were detected according to National Standards Methods (HJ/T346—2007, GB11893-89) using a UV-visible spectrophotometer (Persee, TU-1901, China) at wave length of 220 and 275 nm, 700 nm respectively. Adsorption capacities, qe (mg g−1) was determined by the amount of anions adsorbed per unit weight of the adsorbent at equilibrium using the following equation:
where
c0 is the initial concentration (mg L
−1),
ce is the equilibrium concentration (mg L
−1),
V is the volume of solution (mL) and
m is the amount of adsorbent (g).
Adsorption kinetics (pseudo-first-order, pseudo-second-order model and intra-particle diffusion model16), adsorption isotherms (Langmuir, Freundlich and Temkin isotherm models17) and thermodynamics were used for analysis of the difference of MCS on nitrate and phosphate adsorption. The equations were shown as Table 1.
Table 1 The equations of adsorption kinetics, isotherms and thermodynamics
| Models |
Equation |
Parameters |
| Pseudo-first-order |
q = qe(1 − e−k1t) |
q: the amount of adsorbent anions onto the MCS (mg g−1); k1: the rate constant (min−1) |
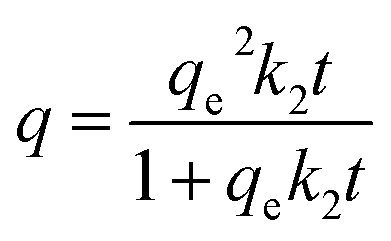
| Pseudo-second-order |
 |
k2: the rate constant (g min−1 mg−1) |
| Intra-particle diffusion |
q = kpt0.5 + C |
kp: the intra-particle rate constant (g mg−1 min−1); C: a constant for any experiments |
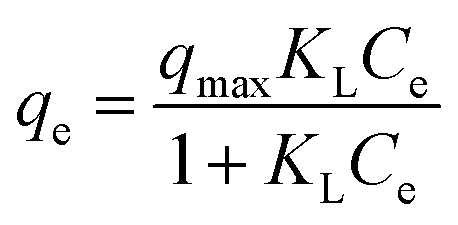
| Langmuir |
 |
qe: the equilibrium adsorption capacity (mg g−1); Ce: the equilibrium concentration of the solution (mg L−1); qmax: the maximum amount of anion required for a monolayer (mg g−1) |
| Freundlich |
qe = kFC1/ne |
kF:the Freundlich equilibrium constant; n: the Freundlich constant |
| Temkin |
qe = Bln(ACe) |
A: the Temkin isotherm constant (L g−1); B: the heat of adsorption (J mol−1) |
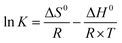
| (ΔG0) |
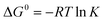 |
R: the gas constant (8.314 J mol−1 K), T: the absolute temperature (K), K: the equilibrium constant for solid–liquid system |
 |
M: the molar mass of nitrate or phosphate |
 |
ΔS0: (kJ mol−1.K), ΔH0: (kJ mol−1) |
3 Results and discussion
3.1 Characteristics of CS and MCS
3.1.1 Zeta potential and EA of CS and MCS. The proportion of cellulose, hemicellulose, acid-soluble lignin and ash in corn stalks was 34.31%, 20.47%, 4.12% and 0.30%, respectively, which indicated CS had a potential to adsorb nitrate and phosphate by modification based on high cellulose production. Zeta potential provides information about electro-kinetic behaviour of samples in solution. Zeta potential of MCS increased from −23.5 mV to +18.1 mV comparing with CS at the pH of 7.0. This increase confirmed that some positively-charged functional groups had been successfully grafted onto CS.8According to the results of EA, the nitrogen content (N%) increased from 1.61% to 12.39%, higher than previous results obtained by Xing, X.17 who used modified wheat stalk for nitrate removal. The rapid increase in N% indicates high-speed reactions and confirms the presence of amine groups on MCS.9 Previous researches proved that N% is correlated with phosphate removal performance, thus a significant increase in N% is a reliable indicator of promising phosphate removal ability.3 Results of Zeta potential and EA all confirmed the enhancement of adsorption capacities.
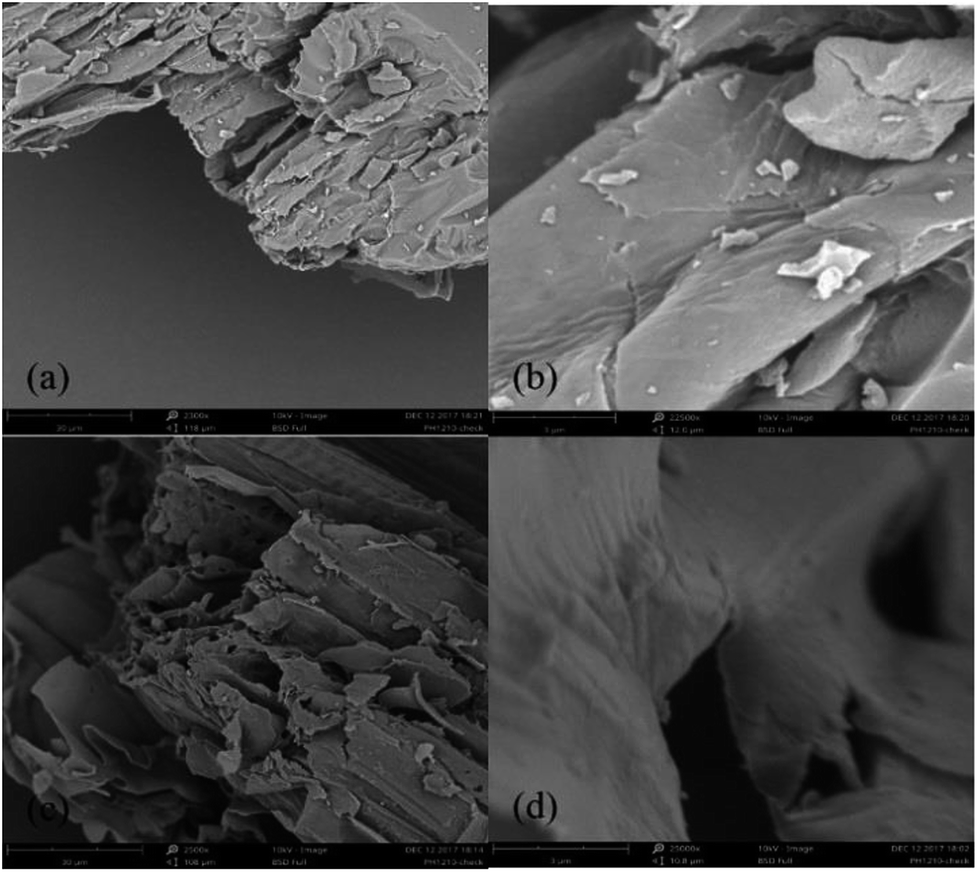
3.1.2 SEM of CS and MCS. The SEM photos of both MCS and CS were presented in Fig. 2. It can be seen from Fig. 2(a) and (c) that MCS has more layers and pores than CS, indicating larger surface area. This can be explained by the partial removal of lignin, hemicellulose, ash and other extractives.19 Fig. 2(b) and (d) showed that the surface of MCS is a lot rougher than CS due to the attachment of functional groups. Similar results were also observed in Fan's research, in which modified cellulose from corn stalks had more irregular surface with protrusions and cracks.12 Multilayer structure and functional groups on surface proved the enhancement of adsorption capacities.
 |
| | Fig. 2 The SEM micrographs of CS at 2300× (a) and 22500× (b), MCS at 2500× (c) and 25000× (d). | |
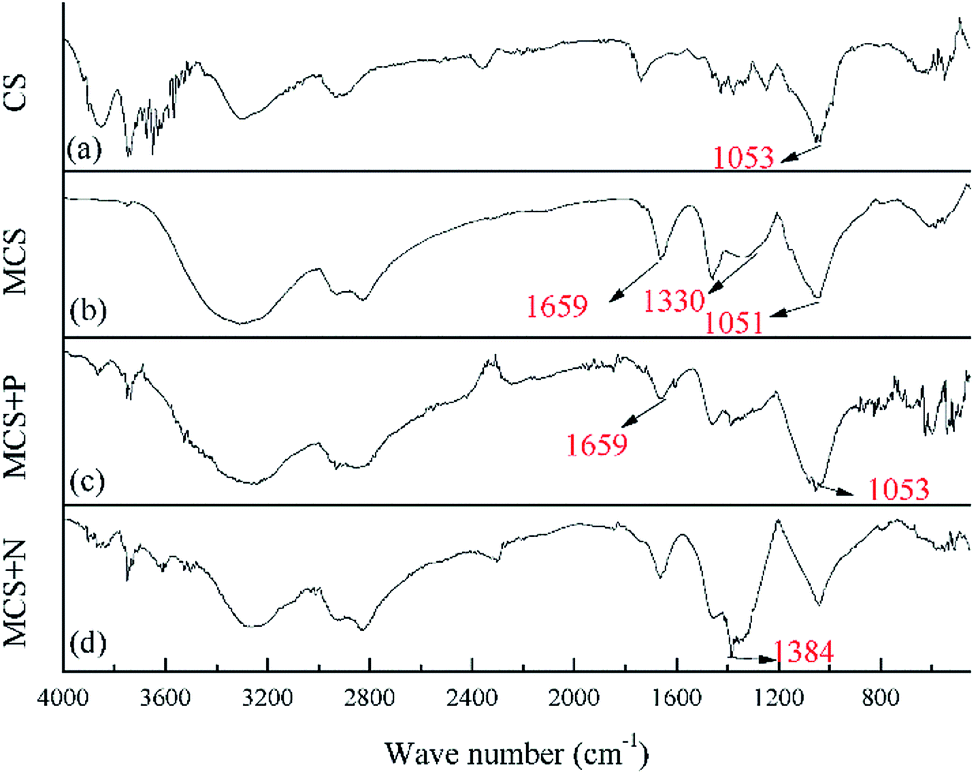
3.1.3 FTIR of CS and MCS. The FTIR spectra of CS, MCS and MCS after phosphate, nitrate adsorption (MCS + P, MCS + N) were shown in Fig. 3. The broad band spanning from 3200 to 3500 cm−1 in the spectrum of CS was due to the hydrogen bonded –OH and nitrogen bonded –NH stretching. The specific peak at 1659 cm−1 is related to the carboxyl group (–COOH) stretching vibration.20 The intense peaks at 1053 cm−1 in CS and 1051 cm−1 in MCS corresponded to specific stretching vibration of C–N bond. The new peak occurred at 1330 cm−1 in MCS corresponded to C–N bending vibrations,14 which indicated the presence of quaternary ammonium groups.20 Fig. 3(c) showed that the specific bands from 1053 cm−1 to 1659 cm−1 were enhanced due to the adsorption of phosphate.14 The nitrate characteristic peak at 1384 cm−1 in Fig. 3(d) indicates that nitrate was adsorbed by MCS.17 FTIR results confirmed the presence of functional groups and proved that MCS had the ability of removal nitrate and phosphate from aqueous.
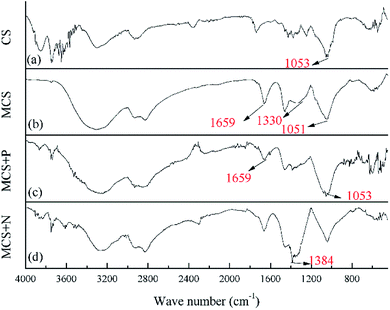 |
| | Fig. 3 FTIR spectra of CS (a), MCS (b), MCS + N (c) and MCS + P (d). | |
3.2 Results of adsorption tests
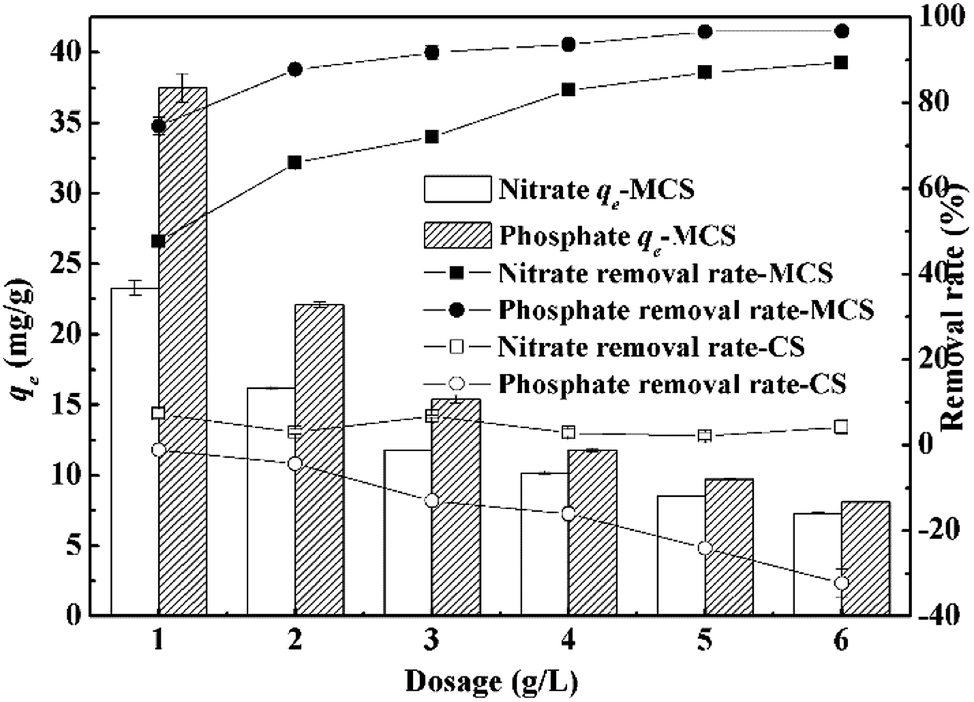
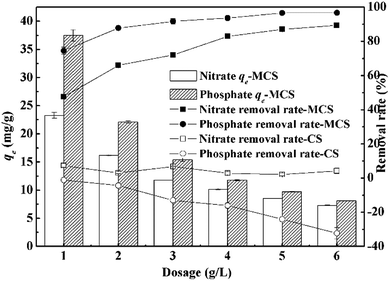
3.2.1 Effect of dosage. Dosage mainly offers active adsorption sites for the removal of nitrate and phosphate. Fig. 4 shows that the removal rates of two anions increased as the dosage increased from 1.0 g L−1 to 6.0 g L−1 by using MCS, which can be ascribed to the increase of available adsorption sites.21 At the dosage of 1.0 g L−1, the removal rate of phosphate was nearly two times as that of nitrate and the removal rates reached 96.72% and 86.38% for phosphate and nitrate when dosage increased to 6 g L−1, respectively. Reversely, the values of qes had the opposite trends with the increase of dosage, indicating that functional sites on MCS were underutilized at high dosage.21 At the dosage of 1.0 g L−1, qe was 37.49 mg g−1 for phosphate and 23.30 mg g−1 for nitrate, showing higher larger capacities for both anions comparing with previous researches using metal-loaded activate carbon (8.73–14.12 mg P g−1)22 and modified rice hull (11–17 mg N g−1).23 Furthermore, there were no obvious adsorption effects in the control groups, and even the removal efficiency of phosphate decreased as CS dosage increased, which might be due to the release of previously pertained phosphate from fertilizer. In a total, MCS had a preference for phosphate over nitrate, and the removal rates of nitrate and phosphate could be narrowed the gab with the increase of dosage. The similar results were reported by Saad, R.7 and Keranen, A.10 The dosage of 4 g L−1, pH 6.0 and initial concentration of 50 mg L−1, the phosphate removal rate was 10.97% higher than that nitrate. As a result, 4.0 g L−1 was selected as the optimal dosage in the following experiments considering removal rate, efficiency and expense.
 |
| | Fig. 4 Effect of CS and MCS dosage on the nitrate and phosphate adsorption. | |
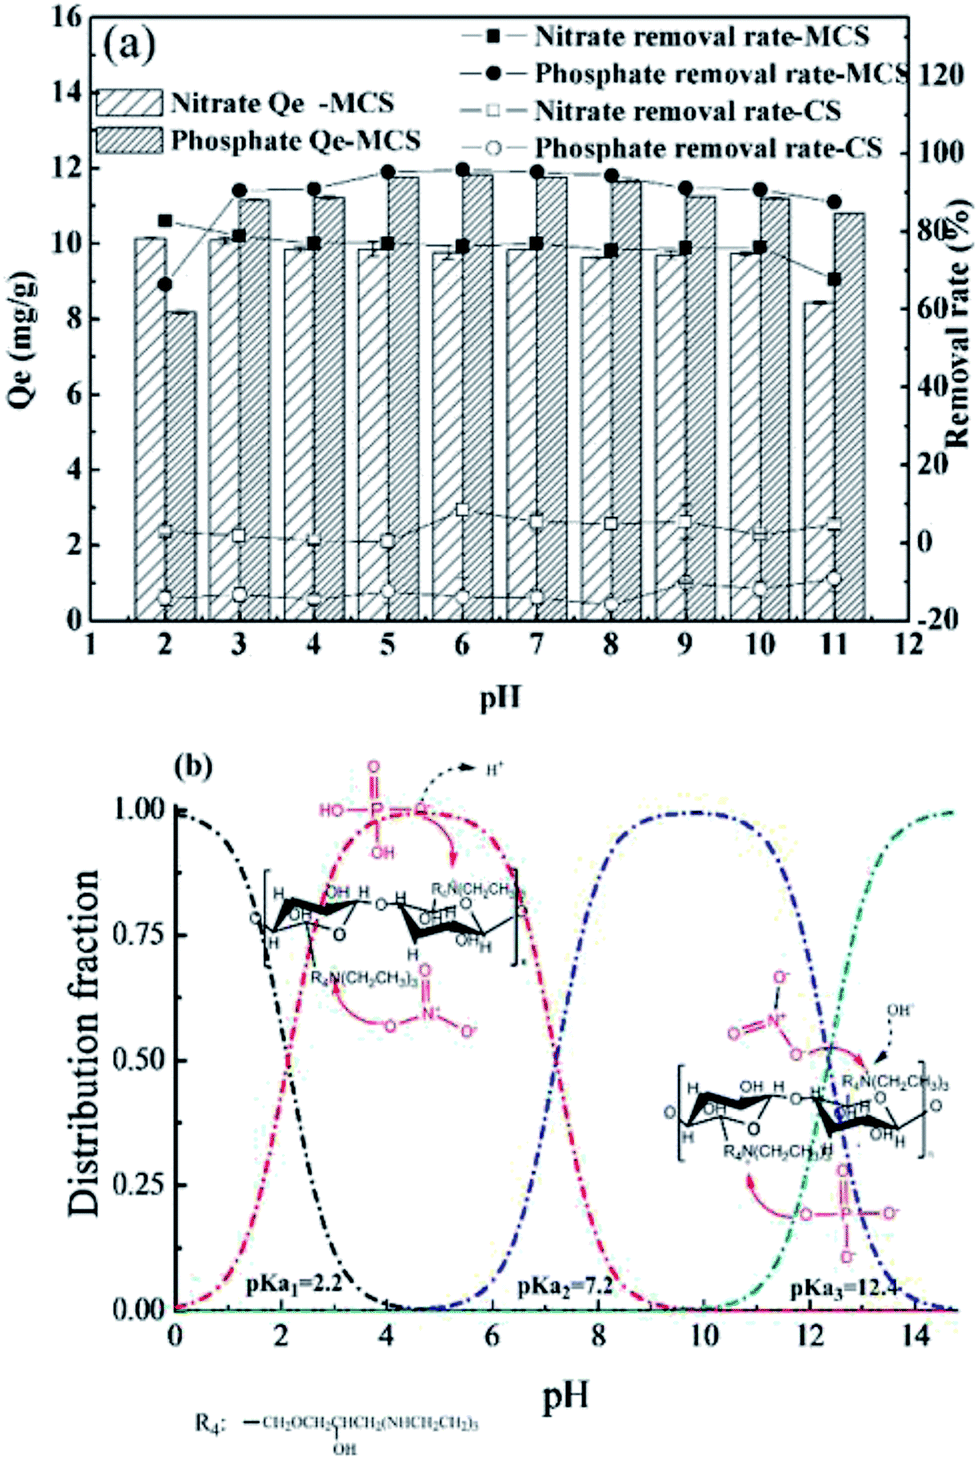
3.2.2 Effect of pH. The pH value has a significant influence on the adsorption capacities of adsorbents in that it is closely related to the electronic charges of functional groups on MCS caused by ionization.7 As shown in Fig. 5(a), the results showed that CS had poor removal rate of nitrate and phosphate with the increase of pH, which was consistent with dosage. Therefore, subsequent experiments no longer focused on CS. For MCS, the optimal pH for nitrate and phosphate was 2.0 and 6.0, respectively, under which the individual removal rates reached 82.69% and 95.86%. However, nitrate and phosphate adsorption presented opposite performances under extreme pH. For nitrate, the adsorption capacity of pH at 2.0 was 16.80% higher than that at pH 11.0, while for phosphate it was 24.80% lower. These results indicated that nitrate adsorption capacity was slightly promoted and phosphate was seriously inhibited at low pH, which differed from Bozorgpour et al.'s previous findings24 that both two anions favoured acidic solution when using chitosan/Al2O3/Fe3O4 composite non-fibrous adsorbent. This distinction can be explained by protonation and competing effect among anions as presented in Fig. 5(b). The protonation of phosphate in form of [H3PO4] in acidic solution will restrict phosphate capture.25 The ionization constants (pKa) for H3PO4 are 2.2, 7.2 and 12.4 respectively.7 As it was shown in Fig. 5(b), high concentration of H+ in acidic solution will compete against positively charged quaternary amino groups for dihydrogen phosphate, forming molecular H3PO4. Low pH would not be an inhibiting factor for nitrate adsorption since HNO3 is a strong electrolyte. Meanwhile, the excessive OH− in alkaline solution will compete against target anions for quaternary amino groups. At the pH of 11, nitrate sorption was inhibited by 16.86% (qe = 8.43 mg g−1) comparing with that at optimal pH, while phosphate was only slightly inhibited, decreased from 11.84 mg g−1 to 10.80 mg g−1. It was presumed that resins generally have a greater affinity towards ions with larger atomic number and higher valence,10 thus the competences of three anions may be ranked as PO43− > OH− > NO3−. Overall, pH from 4.0 to 8.0 was considered optimal for both anions, at which the sorption capacities remained relatively constant. This suggested that MCS is adaptable to various aqueous.
 |
| | Fig. 5 Effect of pH on the nitrate and phosphate adsorption (a) and hydrolysis of phosphate (b). | |
The pH values after adsorption were also measured. For both anions, pH tended to return to neutral after adsorption (ESI Fig. 1†), especially within the range of 4.0 to 8.0. Wang11 also reported similar pH change when using modified corn straw for phosphate adsorption. This buffer effect might be caused by the inherent weak acidic hydroxyl and alkali amidogen groups on MCS. Considering the experimental results and actual aqueous quality, pH was adjusted to 6.0 for phosphate and 7.0 for nitrate in the following tests.
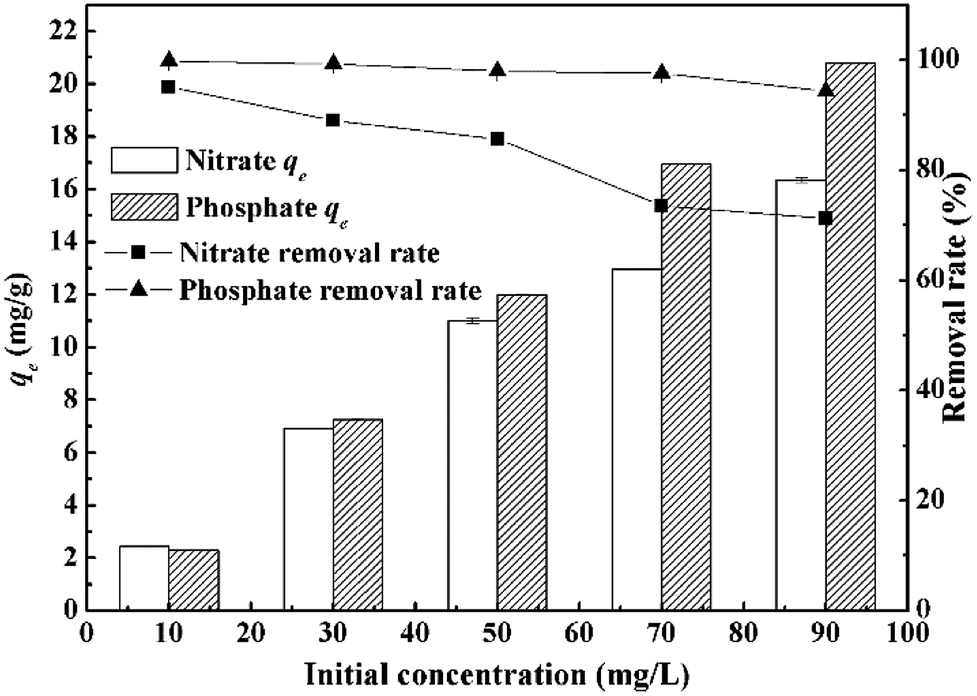
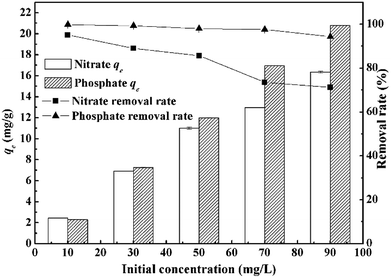
3.2.3 Effect of initial concentration. Initial concentration is an important factor to assess the adsorption capacity of MCS. Fig. 6 showed the adsorption capacities and removal rates of nitrate and phosphate within the initial concentration range of 10 to 90 mg L−1. As initial concentration increased, adsorption capacities of nitrate and phosphate increased by 6.73 and 9.05 times, respectively. MCS still maintained a high removal rate (over 90%) for phosphate when concentration reached 90 mg L−1, while nitrate removal rate dropped from 95.10% to 71.20% in the same case. Therefore, the different properties of nitrate and phosphate adsorption indicated that MCS is more capable of phosphate removal and more resistant to high phosphate concentration.
 |
| | Fig. 6 Effect of initial concentration on nitrate and phosphate adsorption. | |
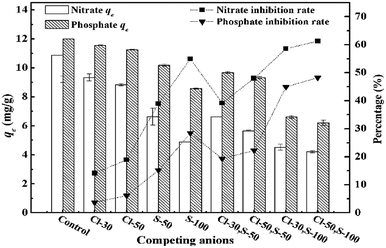
3.2.4 Effect of competing anions. Till now, both the adsorption properties of nitrate and phosphate above were discussed singly. There exists various anions in real wastewater which have the ability to compete active sites. In order to investigate how much other anions affect on MCS, different concentrations of chlorine (Cl−) and sulfate (SO42−), as the represents of real wastewater, were added into nitrate or phosphate solution separately of in combination.Results were presented in Fig. 7. The presence of competing anions had negative effects on the adsorption capacities of both phosphate and nitrate. It can be inferred from Fig. 7 that the concentration of competing anions and classification were the two key factors to affect the adsorption capacities. For the same classification of individual competing anions, especially for sulfate, the former was more predominant. The inhibition rate of nitrate increased from 38.96% to 54.94% as the concentration of sulfate raised from 50 mg S/L to 100 mg S/L, which was nearly two times compared with the inhibition rate of phosphate. These results were coincide with our previous deduction that the phosphate was more competitive and more resistant than nitrate. For the compound system, the classification of competing anions played an important role. Fixed the concentration of sulfate as 50 mg S/L and varied the concentration of chloride from 30 mg Cl/L to 50 mg Cl/L, the adsorption capabilities of nitrate decreased from 10.88 mg g−1 to 6.62 mg g−1 and 5.66 mg g−1, respectively. That of phosphate dropped from 11.99 mg g−1 to 9.67 mg g−1 and 9.33 mg g−1, respectively. However, when the concentration of sulfate changed from 50 mg S//L to 100 mg S/L with a constant concentration of chloride (30 mg Cl/L), the inhibition rate of nitrate was 13.92% higher than that of phosphate at 100 mg S/L. These results indicated that the affinity level between adsorbent and adsorbate was largely determined by concentration and valence of anions. A. Keranen10 observed that 99% of sulfate can be removed by modified sawdust resin at the initial concentration of 50 mg L−1. Therefore, the decrease in adsorption capacities might be due to the adsorption of competing anions.
 |
| | Fig. 7 Effect of competing anions on nitrate and phosphate adsorption. | |
3.3 Adsorption kinetics
The various parameters of adsorption kinetics can reveal the adsorption mechanism of nitrate and phosphate, explaining why the MCS showed more affinity to the later. As can be seen from ESI Fig. 2,† the kinetic behaviours at low, medium and high concentration (10, 50, 90 mg g−1) of both phosphate and nitrate were studied and the results were presented. For both anions, the kinetic trend can be characterized into three stages. In the first stage (0–5 min), the steep slope minutes indicated rapid reaction speed. Reaction began to slow down in the second stage (6–15 min), during which most of the adsorption processes (qt/qe = 0.881–0.971) were completed. The reaction speed further slowed down in the third stage (16–60 min) until final equilibrium was achieved. For both anions, qe increased as initial concentrations increased. Slight delays in equilibrium timing were observed at high concentration, but equilibrium can still be reached within 60 minutes. The distinction of nitrate and phosphate adsorption by MCS became more evident as concentration increased, which can be explained by the adsorption kinetics, such as pseudo-first-order model, pseudo-second-order model and intra-particle diffusion model.
Parameters of pseudo-first-order and pseudo-second-order model were shown in Table 2. Pseudo-second-order model gave better fit under the same conditions (R2 = 0.937–0.993) due to the lower akaike information criterion (AIC) values in terms of the simulation results, and the obtained qe values were consistent with experimental results. Similar fitting results were reported by Boeykens, S. P.26 This suggested that the rate-limiting step may be chemisorption or ion exchange.9 k2 indicates the reaction speed, which decreased with the increase of the solution concentration, corresponded to the slight delays of equilibrium time at high concentration. It can be inferred from Table 2 that phosphate adsorption occurs slightly faster than nitrate at the concentration of 10 and 50 mg L−1, possibly due to its higher valence. When concentrations reached 90 mg L−1, k2 values were the same for both anions, at which point the number of adsorption sites became the key factor to determine the rate of reaction instead of valence.9 As a result, the MCS showed a different affinity on nitrate and phosphate due to its different reaction speed and valence.
Table 2 Adsorption kinetics parameters: the pseudo-first-order kinetic and the pseudo-second-order model
| Model |
|
Nitrate |
Phosphate |
| Pseudo-first-order model |
C0 (mg L−1) |
10 |
50 |
90 |
10 |
50 |
90 |
| qe,exp (mg g−1) |
2.70 |
10.68 |
15.71 |
2.54 |
15.49 |
20.48 |
| k1 |
0.57 |
0.37 |
0.44 |
1.06 |
0.43 |
0.43 |
| s |
0.07 |
0.04 |
0.04 |
0.08 |
0.05 |
0.04 |
| qe |
2.50 |
9.81 |
14.58 |
2.45 |
10.79 |
19.09 |
| s |
0.05 |
0.22 |
0.27 |
0.02 |
0.26 |
0.34 |
| R2 |
0.681 |
0.798 |
0.841 |
0.812 |
0.711 |
0.841 |
| AIC |
−61.14 |
−9.89 |
−0.53 |
−91.35 |
−2.53 |
7.36 |
| p |
≪0.00001 |
|
|
|
|
|
| Pseudo-second order model |
k2 |
0.38 |
0.06 |
0.04 |
0.87 |
0.07 |
0.04 |
| s |
0.03 |
0.01 |
0.002 |
0.02 |
0.01 |
0.001 |
| qe |
2.65 |
10.39 |
15.52 |
2.54 |
11.42 |
20.23 |
| s |
0.03 |
0.13 |
0.09 |
0.01 |
0.15 |
0.10 |
| R2 |
0.941 |
0.953 |
0.987 |
0.993 |
0.937 |
0.999 |
| AIC |
−93.05 |
−37.64 |
−48.77 |
−154.24 |
−31.65 |
−45.42 |
| p |
≪0.00001 |
|
|
|
|
|
Intra-particle diffusion model was applied to discuss the diffusion mechanism during adsorption.18 Multi-linearity in qt vs. t0.5 plots were applied to depict three reaction stages. Parameters of each stage were presented in Table 3. R2 values ranged from 0.808 to 0.997, in which no plot had passed through the origin, suggesting that diffusion is not the only speed-controlling factor.9 kps increased along with contact time and initial concentrations. At concentrations of 10 and 50 mg L−1, kps of nitrate adsorption were generally larger than that of phosphate. However, such advantage became less evident as initial concentration increased, which further indicated that diffusion was not determined by the mechanism of reaction rates only in the process. The positive values of C also indicated the presence of other mechanisms like boundary diffusion.16 Therefore, it's possible that some anions have diffused into MCS during the process, however the removal of anions is mainly achieved by adsorption.
Table 3 Adsorption kinetics parameters: intra-particle diffusion model
| |
Parameters |
Nitrate |
Phosphate |
| 10 mg L−1 |
50 mg L−1 |
90 mg L−1 |
10 mg L−1 |
50 mg L−1 |
90 mg L−1 |
| Stage1 |
kp1 |
0.56 |
2.11 |
4.32 |
0.41 |
1.96 |
5.18 |
| C1 |
0.96 |
2.94 |
2.99 |
1.45 |
4.21 |
4.54 |
| R12 |
0.942 |
0.935 |
0.900 |
0.914 |
0.997 |
0.990 |
| Stage2 |
kp2 |
0.16 |
0.90 |
1.45 |
0.05 |
0.72 |
2.42 |
| C2 |
1.84 |
6.15 |
8.90 |
2.29 |
7.64 |
10.51 |
| R22 |
0.881 |
0.878 |
0.917 |
0.967 |
0.810 |
0.979 |
| Stage3 |
kp3 |
0.03 |
0.20 |
0.25 |
0.01 |
0.15 |
0.39 |
| C3 |
2.33 |
8.58 |
13.22 |
2.42 |
9.93 |
16.91 |
| R32 |
0.903 |
0.958 |
0.967 |
0.958 |
0.929 |
0.892 |
3.4 Adsorption isotherms
The adsorption isotherm fitting curves under four different temperatures were shown in ESI Fig. 3.† Langmuir, Freundlich and Temkin isotherms models were applied to quantify the relationship between qe and ce.
Adsorption capacities for both anions slightly increased along with temperature from 283.15 to 303.15 K, however decreased at 313.15 K. The decrease will be discussed by thermodynamic parameters in the later part. Adsorption capacities changed only a little as temperature varied, confirming the thermostability of MCS. Table 4 listed isotherm parameters of all three models. Freundlich model gave better fits due to lower AIC values and higher R2 (0.978–0.999) for both nitrate and phosphate, indicating non-ideal multilayer adsorption on heterogeneous sites. This result corresponded to previous SEM analysis that MCS acquired a rougher surface due to the grafting of quaternary ammonium groups. The values of were generally smaller for phosphate adsorption (0.39–0.43) comparing to nitrate (0.44–0.48), indicating higher affinity between MCS and phosphate. Langmuir (R2 = 0.956–0.980) and Temkin model (R2 = 0.912–0.979) also presented valuable perspectives about MCS's isotherm behaviour. Compared with other adsorbents (Table 5), at 303.15 K, qes of Langmuir for nitrate and phosphate were 20.04 mg g−1 and 24.20 mg g−1 at the concentration of 90 mg L−1, slightly higher than that reported by Fan, C. et al.12 (13.61 and 22.88 mg g−1 at 100 mg L−1, respectively), which may be due to more functional groups grafted on CS. However, the adsorption capacity of MCS exceeded the sugarcane bagasse27 and rice husk.19 The reason why our adsorption capacities were less than other researchers28 is that the dosage of adsorbent is sufficient to adsorb the adsorbent completely, leading to the incomplete utilization of many active sites, in which the aim is to better compare and analyse the adsorption mechanisms of nitrate and phosphate. Temkin equation suggested the presence of interactions between adsorbates during the process. Therefore, the adsorption process is complexed during which multiple mechanisms contributes to the removal of target anions.
Table 4 Adsorption isotherm parameters: Langmuir, Freundlich and Temkin model
| |
T (K) |
283.15 |
293.15 |
303.15 |
313.15 |
| Parameters |
N |
P |
N |
P |
N |
P |
N |
P |
| Langmuir |
qm (mg g−1) |
17.90 |
20.90 |
18.67 |
21.90 |
20.04 |
24.20 |
18.10 |
19.80 |
| s |
1.49 |
1.07 |
1.04 |
1.20 |
1.34 |
1.79 |
1.13 |
1.16 |
| KL (L mg−1) |
0.12 |
0.67 |
0.13 |
0.59 |
0.11 |
0.54 |
0.10 |
0.69 |
| s |
0.03 |
0.11 |
0.02 |
0.10 |
0.02 |
0.11 |
0.02 |
0.14 |
| R2 |
0.956 |
0.971 |
0.981 |
0.972 |
0.977 |
0.966 |
0.978 |
0.963 |
| AIC |
0.29 |
1.69 |
6.44 |
1.78 |
4.61 |
4.30 |
6.88 |
3.07 |
| p |
≪0.00001 |
| Freundlich |
KF |
3.34 |
8.10 |
3.36 |
8.08 |
3.26 |
8.66 |
2.99 |
7.86 |
| s |
0.08 |
0.39 |
0.27 |
0.33 |
0.23 |
0.17 |
0.22 |
0.31 |
| 1/n |
0.44 |
0.39 |
0.46 |
0.41 |
0.48 |
0.43 |
0.46 |
0.38 |
| s |
0.04 |
0.18 |
0.14 |
0.14 |
0.11 |
0.07 |
0.12 |
0.15 |
| R2 |
0.999 |
0.978 |
0.983 |
0.986 |
0.988 |
0.997 |
0.987 |
0.984 |
| AIC |
31.32 |
0.59 |
7.77 |
4.05 |
10.20 |
16.11 |
11.43 |
4.74 |
| p |
≪0.00001 |
| Temkin |
A (L g−1) |
3.18 |
10.35 |
1.81 |
10.11 |
1.80 |
14.06 |
1.67 |
11.35 |
| s |
1.19 |
2.00 |
0.36 |
2.15 |
0.41 |
4.52 |
0.37 |
1.92 |
| B (mol K J−1) |
2.91 |
3.94 |
3.62 |
4.03 |
3.74 |
3.93 |
3.37 |
3.68 |
| s |
0.32 |
0.24 |
0.25 |
0.27 |
0.30 |
0.38 |
0.26 |
0.19 |
| R2 |
0.912 |
0.972 |
0.963 |
0.966 |
0.952 |
0.929 |
0.956 |
0.979 |
| AIC |
11.66 |
1.53 |
1.13 |
3.63 |
2.47 |
10.73 |
0.60 |
2.08 |
| p |
≪0.00001 |
Table 5 Comparison of different adsorbents on nitrate and phosphate adsorption
| Species |
Dosage (g L−1) |
Initial concentration (mg L−1) |
qe of P (mg g−1) |
qe of N (mg g−1) |
Removal rate of P (%) |
Removal rate of N (%) |
Ref. |
| Corn stalks |
2 |
100 |
22.88 |
13.61 |
— |
— |
12 |
| Sugarcane bagasse |
30 |
30 |
0.33 |
— |
99.27 |
— |
27 |
| Rice husk |
4 |
100 |
— |
— |
— |
94.3 |
19 |
| Wheat straw |
2 |
500 |
45.7 |
52.8 |
— |
— |
28 |
| Corn stalks |
4 |
50 |
20.04 |
24.20 |
96.03 |
82.4 |
This paper |
3.5 Adsorption thermodynamic parameters
Thermodynamics parameters shows the effect of temperature on adsorption capacity, thus implies the spontaneity of the process. Thermodynamic parameters within the temperature range of 283.15–303.15 K were calculated and presented in Table 6. Standard Gibbs free energy (ΔG0) were all negative and decreased as temperature increased, suggesting that the adsorption is spontaneous and favoures high temperature. Phosphate adsorption has a lower ΔG0 than nitrate, which corresponded to previous deduction that phosphate is easier to be adsorbed. The positive standard enthalpy (ΔH0) indicates that the process is endothermal, therefore high temperature can promotes adsorption. This was confirmed by experimental results within the temperature range of 283.15–303.15 K. Positive values of entropy change (ΔS0) indicated the increased randomness of the solution interface during adsorption.29 Experiment results showed that adsorption capacities decreased as temperature reached 313.15 K. Similar downwards trend was observed in previous research using modified pine sawdust as temperature increased from 313.15 to 343.15 K.10 Considering that adsorption is a complex process with various mechanisms, the decrease at high temperature might be attributed to partial desorption caused by excessive heat. Besides, compared the absolute values of ΔG, ΔH and ΔS between nitrate and phosphate, all the values of phosphate were larger than nitrate, which indicated that phosphate can be adsorbed easily than nitrate.
Table 6 Thermodynamic parameters for the nitrate and phosphate adsorption
| |
Nitrate |
Phosphate |
| T (K) |
lnK1 |
ΔG (kJ mol−1) |
ΔH (kJ mol−1) |
ΔS (kJ mol−1 K) |
lnK2 |
ΔG (kJ mol−1) |
ΔH (kJ mol−1) |
ΔS (kJ mol−1 K) |
| 293.15 |
3.43 |
−8.07 |
6.62 |
0.0519 |
5.14 |
−12.1 |
12.92 |
0.0884 |
| 303.15 |
3.52 |
−8.58 |
|
|
5.36 |
−13.05 |
|
|
| 313.15 |
3.61 |
−9.11 |
|
|
5.50 |
−13.86 |
|
|
Adsorption kinetics, adsorption isotherms and adsorption thermodynamics have been used to compare and analyse the distinct adsorption capacity of nitrate and phosphate. All models indicated that phosphate had better affinity than nitrate.
4 Conclusions
In this study, MCS was prepared by grafting quaternary ammonium groups through cross-link reaction from corn stalks. The characteristics of MCS were evaluated by Zeta potential, EA, SEM and FTIR. Results indicated that the MCS had a potential adsorption capacity for anion removal due to the presence of quandary-ammonium functional groups. The adsorption properties of MCS investigated by dosage, pH, initial concentration and competing anions indicated that MCS had a higher adsorption capacity for phosphate over nitrate, which was connected with larger atomic number and higher valence for phosphate. Mechanism analysis including kinetics, isotherm and thermodynamic were used to further reveal the different affinity of MCS on nitrate and phosphate. Both nitrate and phosphate adsorption fitted with pseudo-second-order kinetics, Freundlich isotherms well, indicating the chemisorption and non-ideal multilayer adsorption on heterogeneous sites for anions. Thermodynamic parameters indicated that adsorption onto MCS was an endothermic process. Besides, the values of models' parameters, especially for the rate constants, were closely related to the effect of nitrate and phosphate adsorption, thus confirmed that phosphate was easier to be adsorbed than nitrate. Experimental results proved that MCS can remove nitrate and phosphate effectively, adaptable to various pH as well as temperatures, indicating MCS can be effective to remove nitrate or phosphate from aqueous.
Conflicts of interest
There are no conflicts to declare.
Acknowledgements
This work was supported by Sichuan Key Point Research and Invention Program (2017SZ0179), Science and Technology Service Network Initiative (KFJ-SW-STS-175) and Youth Innovation Promotion Association CAS (2016331).
Citations
- J. J. W. Ronghua Li, B. Zhou, Z. Zhang, S. Liu, S. Lei and R. Xiao, J. Cleaner Prod., 2017, 147, 12 Search PubMed.
- C. Hui, X. X. Guo, P. F. Sun, R. A. Khan, Q. C. Zhang, Y. C. Liang and Y. H. Zhao, Bioresour. Technol., 2018, 248, 146–152 CrossRef CAS PubMed.
- L. Zhang, L. H. Wan, N. Chang, J. Y. Liu, C. Duan, Q. Zhou, X. L. Li and X. Z. Wang, J. Hazard. Mater., 2011, 190, 848–855 CrossRef CAS PubMed.
- P. M. Gilbert, Mar. Pollut. Bull., 2017, 124, 591–606 CrossRef PubMed.
- F. Ogata, A. Ueda, S. Tanei, D. Imai and N. Kawasaki, J. Ind. Eng. Chem., 2016, 35, 287–294 CrossRef CAS.
- T. A. H. Nguyen, H. H. Ngo, W. S. Guo, J. Zhang, S. Liang, D. J. Lee, P. D. Nguyen and X. T. Bui, Bioresour. Technol., 2014, 169, 750–762 CrossRef CAS PubMed.
- R. Saad, K. Belkacemi and S. Hamoudi, J. Colloid Interface Sci., 2007, 311, 375–381 CrossRef CAS PubMed.
- X. Xing, B. Y. Gao, Q. Q. Zhong, Q. Y. Yue and Q. A. Li, J. Hazard. Mater., 2011, 186, 206–211 CrossRef CAS PubMed.
- X. Xu, B. Y. Gao, Q. Y. Yue and Q. Q. Zhong, J. Hazard. Mater., 2010, 182, 1–9 CrossRef CAS PubMed.
- A. Keranen, T. Leiviska, O. Hormi and J. Tanskanen, J. Environ. Manage., 2015, 147, 46–54 CrossRef CAS PubMed.
- H. T. Wang, X. Xu, Z. F. Ren and B. Y. Gao, RSC Adv., 2016, 6, 47237–47248 RSC.
- C. H. Fan and Y. C. Zhang, J. Geochem. Explor., 2018, 188, 95–100 CrossRef CAS.
- L. Peng, Q. Zhang and K. He, Res. J. Environ. Sci., 2016, 29, 1109–1118 Search PubMed.
- H. Wang, X. Xu, Z. Ren and B. Gao, RSC Adv., 2016, 6, 47237–47248 RSC.
- M. I. El-Khaiary, J. Hazard. Mater., 2007, 147, 28–36 CrossRef CAS PubMed.
- T. S. Anirudhan and T. A. Rauf, J. Ind. Eng. Chem., 2013, 19, 1659–1667 CrossRef CAS.
- X. Xu, B. Y. Gao, Q. Y. Yue, Q. Li and Y. Wang, Chem. Eng. J., 2013, 234, 397–405 CrossRef CAS.
- R. Katal, M. S. Baei, H. T. Rahmati and H. Esfandian, J. Ind. Eng. Chem., 2012, 18, 295–302 CrossRef CAS.
- Z. F. Wang, E. Nie, J. H. Li, M. Yang, Y. J. Zhao, X. Z. Luo and Z. Zheng, Environ. Sci. Pollut. Res., 2012, 19, 2908–2917 CrossRef CAS PubMed.
- Z. Ren, X. Xu, X. Wang, B. Gao, Q. Yue, W. Song, L. Zhang and H. Wang, J. Colloid Interface Sci., 2016, 468, 313–323 CrossRef CAS PubMed.
- S. N. Milmile, J. V. Pande, S. Karmakar, A. Bansiwal, T. Chakrabarti and R. B. Biniwale, Desalination, 2011, 276, 38–44 CrossRef CAS.
- Z. Wang, E. Nie, J. Li, M. Yang, Y. Zhao, X. Luo and Z. Zheng, Environ. Sci. Pollut. Res. Int., 2011, 19, 2908–2917 CrossRef PubMed.
- U. S. Orlando, A. U. Baes, W. Nishijima and M. Okada, Chemosphere, 2002, 48, 1041–1046 CrossRef CAS PubMed.
- F. Bozorgpour, H. F. Ramandi, P. Jafari, S. Samadi, S. S. Yazd and M. Aliabadi, Int. J. Biol. Macromol., 2016, 93, 557–565 CrossRef CAS PubMed.
- Y. Shang, K. Guo, P. Jiang, X. Xu and B. Gao, Int. J. Biol. Macromol., 2017, 109, 524–534 CrossRef PubMed.
- S. P. Boeykens, M. N. Piol, L. S. Legal, A. B. Saralegui and C. Vazquez, J. Environ. Manage., 2017, 203, 888–895 CrossRef CAS PubMed.
- P. Ganesan, R. Kamaraj and S. Vasudevan, J. Taiwan Inst. Chem. Eng., 2013, 44, 808–814 CrossRef CAS.
- X. Xu, B. Y. Gao, Q. Y. Yue and Q. Q. Zhong, Bioresour. Technol., 2010, 101, 8558–8564 CrossRef CAS PubMed.
- P. Ganesan, R. Kamaraj and S. Vasudevan, J. Taiwan Inst. Chem. Eng., 2013, 44, 808–814 CrossRef CAS.
Footnotes |
| † Electronic supplementary information (ESI) available. See DOI: 10.1039/c8ra06617e |
| ‡ Theses authors contributed equally to this work. |
|
| This journal is © The Royal Society of Chemistry 2018 |
Click here to see how this site uses Cookies. View our privacy policy here. 
 Open Access Article
 This Open Access Article is licensed under a Creative Commons Attribution-Non Commercial 3.0 Unported Licence
 *bc
*bc