 Open Access Article
Novel high-efficiency Eu3+-activated Na2Gd2B2O7 red-emitting phosphors with high color purity
Thangavel Sakthivel,
Liangling Sun,
Balaji Devakumar,
Bin Li and
Xiaoyong Huang *
*
College of Physics and Optoelectronics, Taiyuan University of Technology, Taiyuan 030024, P. R. China. E-mail: huangxy04@126.com
First published on 24th September 2018
Abstract
In this study, a series of Na2(Gd1−xEux)2B2O7 (abbreviated as: Na2Gd2B2O7:xEu3+; x = 0, 0.05, 0.15, 0.35, 0.45, and 0.50) phosphors were synthesized by conventional solid state reaction approach. The structure and morphology of the as-prepared phosphors were studied by X-ray diffraction, scanning electron microscopy and elemental mapping. The results indicated that the phosphors had micro-size particles with monoclinic phases. The photoluminescence excitation and emission study indicated that the as-prepared phosphors could give rise to efficient red emissions under near-ultraviolet excitation. The optimal doping concentration of Eu3+ ions was x = 0.35, and the corresponding deduced critical distance (Rc) was about 9.4 Å. The concentration quenching mechanism was dominated by energy-transfer among the Eu3+ ions through dipole–dipole interactions. The calculated internal quantum efficiency of the Na2Gd2B2O7:0.35Eu3+ red phosphor was 70.8% and the color purity was as high as 99%. Furthermore, decay dynamics revealed that with the increase in the content of Eu3+, the lifetimes decreased due to the increase in non-radiative transition. Importantly, the present Na2Gd2B2O7:0.35Eu3+ phosphors also exhibited good thermal stability, and the emission intensity at 150 °C was about 56% of that at 30 °C. Furthermore, a warm white light-emitting diode (WLED) device was fabricated with commercial BaMgAl10O17:Eu2+ blue phosphors, (Ba,Sr)2(SiO4):Eu2+ green phosphors, and the as-prepared Na2Gd2B2O7:0.35Eu3+ red phosphors as well as a 395 nm LED chip. The device exhibited CIE coordinates of (0.4367, 0.3987), a high color rendering index (CRI = 92.2), a low correlated color temperature (CCT = 2960 K), and a luminous efficacy of 40.65 lm W−1. The observed results strongly indicate that the as-prepared Na2Gd2B2O7:Eu3+ phosphors may be used as the red emitting component in pc-WLEDs.
Introduction
The design and development of novel rare-earth doped phosphors are critical areas studied around the world for encountering the energy crisis.1–4 Phosphor-converted white light-emitting diodes (pc-WLEDs) are a boon for solid-state lighting.5–8 The outstanding advantages of pc-WLEDs, such as low power consumption, enhanced lifetime (>100![[thin space (1/6-em)]](https://www.rsc.org/images/entities/char_2009.gif) 000 h), durability, affordability and compact design, make them promising candidates to replace traditional incandescent, fluorescent and discharge lamps.8,9 The pc-WLED applications have experienced exponential growth in the areas of indoor and outdoor lighting.10,11 In past decades, the pc-WLEDs have been fabricated via different approaches. Among these, a blue LED (InGaN) chip coated with cerium-doped yttrium aluminum garnet (YAG:Ce3+) yellow phosphors produced white light.12,13 However, the device exhibits a low color-rendering index (CRI) and high correlated color temperature (CCT) due to the lack of red color14–16 To overcome these shortcomings, hybridizing tri-color phosphors was introduced to develop the pc-WLEDs.17,18 The blended tri-color phosphors emit white light when excited by near ultraviolet (UV) photons.19 Moreover, for indoor lighting applications, high CRI and low CCT are the two crucial factors.20 Therefore, the development of novel high-efficiency red-emitting phosphors is important and has gained considerable attention.
000 h), durability, affordability and compact design, make them promising candidates to replace traditional incandescent, fluorescent and discharge lamps.8,9 The pc-WLED applications have experienced exponential growth in the areas of indoor and outdoor lighting.10,11 In past decades, the pc-WLEDs have been fabricated via different approaches. Among these, a blue LED (InGaN) chip coated with cerium-doped yttrium aluminum garnet (YAG:Ce3+) yellow phosphors produced white light.12,13 However, the device exhibits a low color-rendering index (CRI) and high correlated color temperature (CCT) due to the lack of red color14–16 To overcome these shortcomings, hybridizing tri-color phosphors was introduced to develop the pc-WLEDs.17,18 The blended tri-color phosphors emit white light when excited by near ultraviolet (UV) photons.19 Moreover, for indoor lighting applications, high CRI and low CCT are the two crucial factors.20 Therefore, the development of novel high-efficiency red-emitting phosphors is important and has gained considerable attention.
Rare earth-activated red-emitting phosphors such as Y2O3:Eu3+ and Y2O3S:Eu3+ have been commercialized.21 However, the unstable nature of this sulfide-based phosphor under ambient environment highly restricts the device performance during long-time operation. These problems could be addressed through the discovery of a novel red emitting phosphor which should possess high stability.15 Moreover, the Eu3+ ions exhibit better narrow red emissions among the discovered rare earth ions.22–28 Eu3+ ions show two prominent characteristic emission peaks in the orange-red and pure red regions due to the 5D0 → 7F1 and 5D0 → 7F2 intra-configurational transitions, respectively.29 In addition, the phosphor emission is strongly correlated to chemical surroundings around the crystallographic site. As seen from the literature, Eu3+ ion-activated phosphor emits two distinct colors, which are induced from magnetic–dipole transition (5D0 → 7F1) and electric–dipole transition (5D0 → 7F2).30 If the activator prefers the inversion symmetry site, the magnetic–dipole transition (5D0 → 7F1) will dominate, resulting in orange-red emission.31 On the contrary, when the dopant ions occupy a non-inversion symmetry site, the resulting phosphors will exhibit pure red emissions because the electric–dipole transition (5D0 → 7F2) dominates.32 Thus, the selection of host materials is a crucial factor and decides the final emission color of the phosphor. Accordingly, different inorganic host materials such as sulfides, oxysulfides, nitrides, phosphates, silicates, borates and aluminates families have been studied for developing inorganic phosphors.33–36 Among these, borates have attracted much interest due to their inherent physical and chemical properties, such as good thermal stability, large band-gap, ultraviolet (UV) transparency, and high luminescence efficiency.37 Na2Gd2B2O7 is an important class of alkali earth borate phosphor.38 To the best of our knowledge, the synthesis and luminescence properties of Eu3+-doped Na2Gd2B2O7 phosphors have not been reported so far.
Hence, in the present study, we prepared novel Na2Gd2B2O7:Eu3+ phosphors doped with different concentrations of Eu3+ ions. The photoluminescence behaviors of the Na2Gd2B2O7:Eu3+ phosphors were studied through complementary analyses such as photoluminescence excitation (PLE), photoluminescence emission (PL), color coordinates, color purity, internal quantum efficiency (IQE), luminescence lifetimes, and temperature-dependent emission spectra. Moreover, a warm WLED device was fabricated and the device performance was studied under the excitation of near-UV light. The acquired aforementioned results for the Na2Gd2B2O7:Eu3+ phosphors are discussed and compared with earlier published reports.
Experimental
Powder samples of pristine Na2Gd2B2O7 and Na2(Gd1−xEux)2B2O7 (abbreviated as: Na2Gd2B2O7:xEu3+; x = 0, 0.05, 0.15, 0.35, 0.45, and 0.50) phosphors were synthesized by a solid-state reaction method. The raw materials were Na2CO3 (analytical reagent, AR), H3BO3 (AR), Eu2O3 (99.99%), and Gd2O3 (99.99%). These raw materials were stoichiometrically weighed and homogeneously mixed for 15 min using an agate mortar. The homogeneous mixture powder was placed in a covered alumina crucible and kept in the muffle furnace. The muffle furnace was operated at 980 °C for 6 h at ambient atmosphere. Subsequently, the sintered samples were cooled to room temperature and again ground for 15 min to acquire fine particles. The obtained phosphors were further used for characterizations.The phase and structural information of the as-prepared Na2Gd2B2O7 and Na2Gd2B2O7:0.35Eu3+ phosphors were obtained via powder X-ray diffraction (XRD) using a Bruker D8 Advance diffractometer with Cu-Kα radiation source. The morphology and elemental distribution of the Na2Gd2B2O7:0.35Eu3+ phosphors were analyzed using field emission scanning electron microscopy (FE-SEM, MAIA3 TESCA). Room temperature PLE and PL spectra were analyzed using an Edinburgh FS5 fluorescence spectrophotometer equipped with a 150 W Xenon lamp as the excitation source. Color coordinates of the phosphors were examined with the Commission International de I'Eclairage (CIE 1931) color chromaticity system. Furthermore, the IQE was analyzed in integrating sphere mode using commercial BaSO4 as reference. The decay lifetimes of the Na2Gd2B2O7:Eu3+ phosphors were measured by recording decay profiles using the same spectrophotometer and pulse Xenon lamp as an excitation source. Temperature-dependent PL measurements were performed from room temperature to 480 K with 20 K intervals. The temperature was precisely controlled by a digital temperature controller.
The prototype warm WLED device was assembled by blending commercial BaMgAl10O17:Eu2+ (BAM:Eu2+) blue phosphors, commercial (Ba,Sr)2(SiO4):Eu2+ green phosphors, the as-synthesized Na2Gd2B2O7:0.35Eu3+ red phosphors and a 365 nm near-UV LED chip. The three phosphors were mixed homogenously with epoxy resin and the mixture was coated on the LED chip surface. Subsequently, the device performance was examined with different forward basis currents: 20, 40, 60, 80, 100 and 120 mA.
Results and discussion
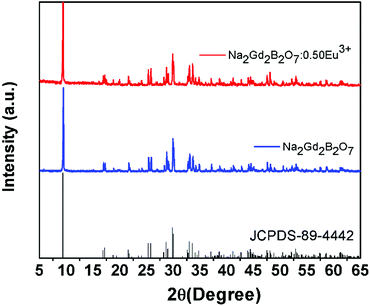
In order to analyze the phase purity and structure of the phosphor, XRD measurements were performed for the pure Na2Gd2B2O7 and Na2Gd2B2O7:0.35Eu3+ phosphors (Fig. 1). The diffraction peaks of the as-synthesized pure Na2Gd2B2O7 were well matched with those in the JCPDS file No 89-4442.38 The crystal structure of the Na2Gd2B2O7 compound was found to possess a monoclinic phase with space group P21/c.39 Furthermore, on addition of Eu3+ ions into Na2Gd2B2O7 host material, the observed diffraction peaks were identical to those of pure Na2Gd2B2O7. This result indicated that Eu3+ doping does not impact the phosphor structure since no impurity peak was observed.Moreover, in order to better understand the crystal structure of the Na2Gd2B2O7:0.35Eu3+ phosphor, refinement analysis was performed using Fullprof program. Fig. 2(a) illustrates the structure refinement of Na2Gd2B2O7:0.35Eu3+ phosphors and their crystallographic parameters are shown in Table 1. There is a good agreement between the observed and calculated XRD patterns. The crystal structure of the Na2Gd2B2O7:0.35Eu3+ phosphor is shown in Fig. 2(b). In this compound, the sodium atoms have six-fold Na(1) coordination, while the boron atom has triangular coordination. The lanthanide ions may settle in the center of the distorted LnO8 triangulated dodecahedra.
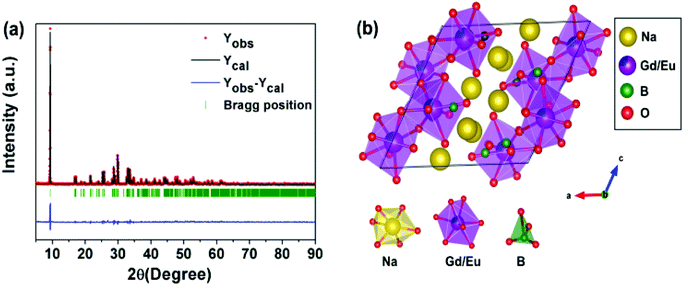 | ||
| Fig. 2 (a) Rietveld refinement of XRD data of Na2Gd2B2O7:0.35Eu3+ and (b) crystal structure of the Na2Gd2B2O7:Eu3+ phosphor. | ||
| Formula | Na2Gd2B2O7:0.35Eu3+ |
|---|---|
| Crystal system | Monoclinic |
| Space group | P121/c1 |
| a | 10.6902(3) Å |
| b | 6.31743(19) Å |
| c | 10.3205(3) Å |
| α | 90° |
| γ | 90° |
| β | 117.806(2) |
| V | 616.51(3) Å3 |
| Rp% | 12.64 |
| Rwp% | 17.66 |
The FE-SEM micrograph images of the Na2Gd2B2O7:0.35Eu3+ phosphors are shown in Fig. 3(a). The morphology of the phosphor was irregular and agglomerated with particle size of few micrometers. The histogram of the particle size distribution was calculated and shown in Fig. 3(b). The calculated average particle size was 1.6 μm. Elemental mapping results are presented in Fig. 3(c–h). Clearly, elements Na, Gd, B, O and Eu are observed. Furthermore, these elements are homogeneously distributed in the particles of the Na2Gd2B2O7:0.35Eu3+ phosphors.
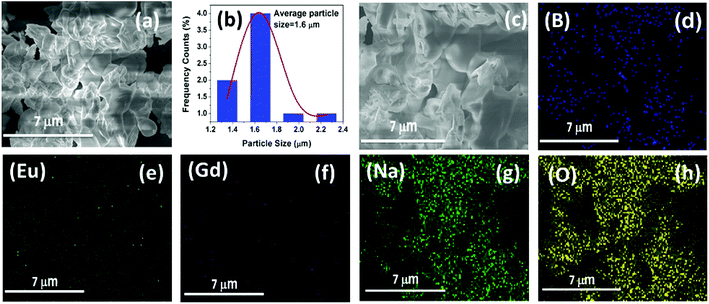 | ||
| Fig. 3 (a) SEM image, (b) histogram of the particle size distribution, and (c–h) elemental mapping of Na2Gd2B2O7:0.35Eu3+ phosphors. | ||
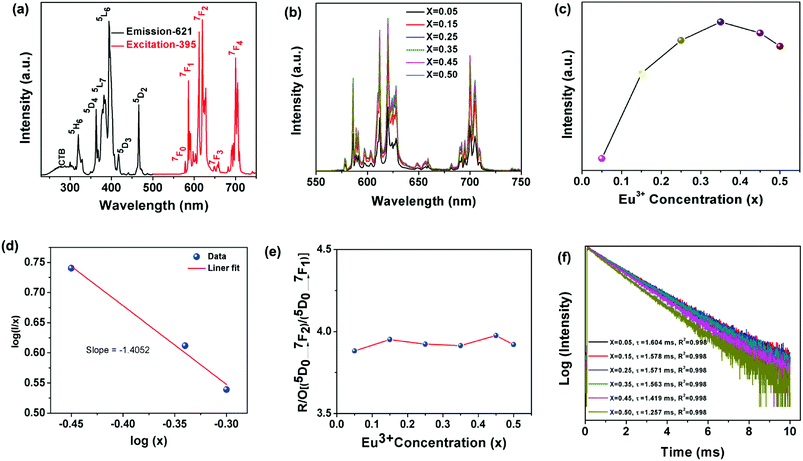
Fig. 4(a) shows the PLE and PL spectra of the Na2Gd2B2O7:0.35 Eu3+ phosphors. The PLE spectrum of the Na2Gd2B2O7:0.35Eu3+ phosphor was monitored at 621 nm. The PLE spectrum of the Na2Gd2B2O7:0.35Eu3+ phosphor was composed of a single broad band and several distinct sharp lines. This broad excitation band located within the region of 240–310 nm was ascribed to the O2− → Eu3+ charge transfer band.40 The sharp distinct PLE peaks at 321, 363, 382, 395, 417 and 466 nm were due to the 4f–4f forbidden transitions of Eu3+ ions, corresponding to the transitions of 7F0 → 5H6, 7F0 → 5D4, 7F0 → 5L7, 7F0 → 5L6, 7F0 → 5D3, and 7F0 → 5D2. The 7F0 → 5L6 transition at 395 nm had the highest intensity. These PLE results depicted that the as-prepared Na2Gd2B2O7:Eu3+ phosphors would be appropriate candidates for pc-WLEDs device pumped by near-UV light.41 As shown in Fig. 4(a), upon excitation at 395 nm, the obtained PL spectrum displays a group of narrow emissions centered at 577, 585, 621, 659, and 700 nm due to the transitions of 5D0 → 7F0, 5D0 → 7F1, 5D0 → 7F2, 5D0 → 7F3, and 5D0 → 7F4, respectively.42 The primary 5D0 → 7F2 transition is known as the magnetic dipole (MD) transition, while the 5D0 → 7F1 transition belongs to the electric dipole (ED) transition. The MD transition is strongly influenced by the surrounding chemical environment. In sharp contrast, the ED transition is independent of the coordination surroundings around the crystallographic site.43 However, the dopant (Eu3+) ions can occupy either an inversion symmetry site or a site without inversion symmetry in the host lattice. When the Eu3+ ions occupy an inversion symmetry site in a coordination surrounding, the 5D0 → 7F1 transition has higher intensity than the 5D0 → 7F2 transition, and the Eu3+ ions exhibit orange-red emission.44 Similarly, when Eu3+ ions occupy a crystallographic site without inversion symmetry, the red emission due to 5D0 → 7F2 transition will be dominant and thus, the Eu3+ ions will produce pure red emissions.45 In Na2Gd2B2O7:0.35Eu3+ phosphors, the red emission at 621 nm, owing to the 5D0 → 7F2 transition, exhibited the highest emission intensity; therefore, the Eu3+ ions occupied sites without inversion symmetry in the Na2Gd2B2O7 host lattice.
In order to obtain the relationship between PL intensity and Eu3+ concentration, PL spectra of the Na2Gd2B2O7:xEu3+ phosphors with various concentrations of Eu3+ ions were measured and shown in Fig. 4(b). The profiles of the obtained PL spectra were almost identical and no peak shift was observed. Moreover, with an increase in the Eu3+ concentration, the PL intensity increased accordingly until x = 0.35, as shown in Fig. 4(c). Furthermore, when the Eu3+ concentration was above x = 0.35, the PL intensity decreased due to concentration quenching.46
Concentration quenching was observed owing to the non-radiative energy transfer to the neighbouring Eu3+ ions. The concentration quenching mechanism is highly influenced by the critical distance (Rc) between neighbouring Eu3+ ions. Based on Rc values, the energy transfer for concentration quenching can be involved in different mechanisms. When Rc is less than 5 Å, the mechanism for concentration quenching can be attributed to an exchange interaction. When Rc exceeded 5 Å, electric multipolar interaction would be the mechanism for concentration quenching. To calculate the Rc values of the Na2Gd2B2O7:Eu3+ phosphors, the following expression was used:47
 | (1) |
 | (2) |
In addition, the integrated red/orange (R/O) emission intensity ratio of the (5D0 → 7F2) and (5D0 → 7F1) transitions was calculated to understand the site symmetry of the Na2Gd2B2O7:Eu3+ phosphors. Fig. 4(e) illustrates the R/O intensity ratio of [(5D0 → 7F2)/(5D0 → 7F1)] as a function of Eu3+ concentration in the Na2Gd2B2O7:xEu3+ phosphors. The calculated intensity ratio was 3.8, 3.9, 3.9, 3.9, 3.9 and 3.9 for x = 0.05, 0.15, 0.25, 0.35, 0.45 and 0.50, respectively. The calculated R/O was higher than unity for all the samples. This result further proves that the Eu3+ ion occupies non-centrosymmetric sites in the Na2Gd2B2O7:Eu3+ phosphors.
The decay curves of Na2Gd2B2O7:xEu3+ phosphors with different Eu3+ concentrations were measured upon excitation at 395 nm and by monitoring the emission at 621 nm, as presented in Fig. 4(f). The measured decay curves were well fitted with the first-order exponential equation, and the lifetimes of 621 nm emission were determined by the following expression:53
 | (3) |
Color coordinates of the Na2Gd2B2O7:xEu3+ phosphors were analyzed using computer imaging software given in CIE 1931 (Commission Internationale de l'Eclairage) color chromaticity diagram. The calculated CIE coordinates were shown to be (0.650, 0.349), (0.652, 0.347), (0.652, 0.347), (0.652, 0.347), (0.653, 0.346) and (0.652, 0.346) for x = 0.05, 0.15, 0.25, 0.35, 0.45 and 0.50, respectively. Fig. 5 denotes the CIE coordinates of the Na2Gd2B2O7:0.35Eu3+ phosphors, commercial Y2O3:Eu3+ phosphors and National Television Standard Committee (NTSC) for red phosphors. Clearly, the CIE coordinates of the Na2Gd2B2O7:0.35Eu3+ phosphor [CIE: (0.652, 0.347)] were close to that of NTSC red phosphors [CIE: (0.67, 0.33)], and was better than that of the commercial Y2O2S:Eu3+ phosphor [CIE: (0.63, 0.35)].55 Furthermore, the inset in Fig. 5 shows the digital images of the as-prepared Na2Gd2B2O7:0.35Eu3+ phosphors' illumination under natural sunlight and a 365 nm UV lamp. Upon UV light exposure, the phosphors emitted pure red color.
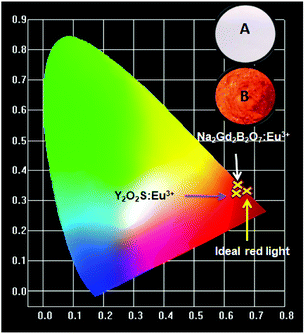 | ||
| Fig. 5 CIE chromaticity diagram of Na2Gd2B2O7:0.35Eu3+ and Y2O2S:Eu3+ phosphors. Inset: photographs of Na2Gd2B2O7:0.35Eu3+ under daylight (A) and 365 nm UV lamp (B). | ||
Furthermore, to better understand the phosphor emission, the color purity of the Na2Gd2B2O7:0.35Eu3+ phosphor was calculated using the given equation:56
 | (4) |
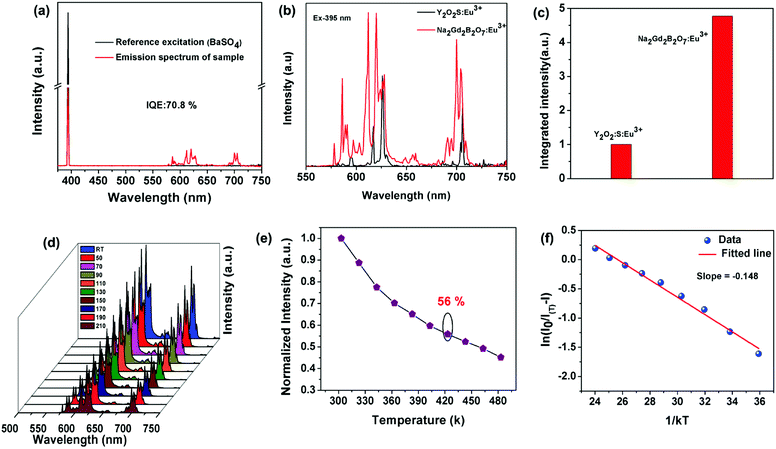
In addition, the IQE of Na2Gd2B2O7:0.35Eu3+ phosphor was determined. Fig. 6(a) represents the excitation line and the emission spectrum of BaSO4 and Na2Gd2B2O7:0.35Eu3+ phosphors. The IQE was determined using the following expression:57
 | (5) |
As seen in Fig. 6(e), the emission intensity at 150 °C (423 K) is approximately 56% of that at room temperature. This value is higher than that obtained for some previously reported Eu3+ ion-activated red phosphors, such as LaSiO2N:Eu3+ (42.3%) and Gd2ZnTiO6:Eu3+ (51%).62,63
Furthermore, the activation energy of the Na2Gd2B2O7:0.35Eu3+ phosphors was determined using the following expression:47
 | (6) |
In order to realize practical applications, a WLED device was fabricated using a 395 nm UV LED chip and phosphor blends of commercial BAM:Eu2+ blue phosphors, commercial (Ba,Sr)2(SiO4):Eu2+ green phosphors and the as-synthesized Na2Gd2B2O7:0.35Eu3+ red phosphors. Fig. 7 shows the electroluminescence (EL) spectrum of the fabricated WLED device under an operating current of 20 mA. Digital photographs of WLED with and without driving current are shown in the inset of Fig. 7. The obtained CIE coordinates, CCT, CRI, and luminous efficacy were found to be (0.4367, 0.3987), 2960 K, 92.2, and 40.65 lm W−1, respectively. These results suggest that the Na2Gd2B2O7:0.35Eu3+ red emitting phosphor may be applied in warm LEDs for indoor lighting.
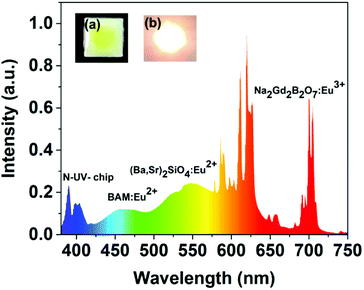 | ||
| Fig. 7 Electroluminescence spectrum of the as-fabricated WLED lamp with 395 nm near-UV chip and BAM:Eu2+, (Ba2Sr)2SiO4:Eu2+ and Na2Gd2B2O7:Eu3+ phosphors driven by 20 mA. | ||
Conclusions
In conclusion, we successfully prepared a series of novel red emitting Na2Gd2B2O7:xEu3+ phosphors through solid state reactions. The excitation spectra evidenced that the phosphor could be efficiently excited by near-UV light. The Eu3+ ions occupied the non-centrosymmetric lattice site since the phosphor showed pure red emission at around 621 nm. The optimal dopant concentration of Eu3+ ions in Na2Gd2B2O7:xEu3+ phosphors was x = 0.35 and the corresponding critical distance (Rc) was found to be 9.4 Å. The color coordinates and color purity of the Na2Gd2B2O7:0.35Eu3+ phosphors were found to be (0.652, 0.347) and 99%, respectively. The measured IQE was 70.8% for the Na2Gd2B2O7:0.35Eu3+ phosphor and its integrated PL intensity was 4.7-fold higher than that of the commercial Y2O2S:Eu3+ red phosphor. At 150 °C, the emission intensity remained at approximately 56% of that at room temperature. Finally, a warm WLED device was fabricated with commercial BaMgAl10O17:Eu2+ blue phosphors, (Ba,Sr)2(SiO4):Eu2+ green phosphors, and the as-prepared Na2Gd2B2O7:0.35Eu3+ red phosphors as well as a 395 nm LED chip. The device showed CIE coordinates of (0.4367, 0.3987), high CRI (92.2), low CCT (2960 K), and luminous efficacy of 40.65 lm W−1. The overall results indicated that the Na2Gd2B2O7:Eu3+ phosphors could be favorable red phosphor candidates for the application in pc-WLEDs under near-UV excitation.Conflicts of interest
There are no conflicts to declare.Acknowledgements
This study was supported by the National Natural Science Foundation of China (No. 51502190), the Program for the Outstanding Innovative Teams of Higher Learning Institutions of Shanxi, and the Open Fund of the State Key Laboratory of Luminescent Materials and Devices (South China University of Technology, No. 2017-skllmd-01).Notes and references
- X. Huang, Nat. Photonics, 2014, 8, 748–749 CrossRef.
- X. Huang, J. Alloys Compd., 2017, 690, 356–359 CrossRef.
- P. Du, L. Luo, X. Huang and J. S. Yu, J. Colloid Interface Sci., 2018, 514, 172–181 CrossRef PubMed.
- P. Du, X. Huang and J. S. Yu, Inorg. Chem. Front., 2017, 4, 1987–1995 RSC.
- Z.-w. Zhang, L.-j. Wang, S.-s. Yang, W.-g. Chen and X.-j. Chu, Dyes Pigm., 2017, 142, 272–276 CrossRef.
- X. Huang, B. Li, H. Guo and D. Chen, Dyes Pigm., 2017, 143, 86–94 CrossRef.
- X. Huang and H. Guo, Dyes Pigm., 2018, 152, 36–42 CrossRef.
- X. Huang, J. Liang, B. Li, L. Sun and J. Lin, Opt. Lett., 2018, 43, 3305–3308 CrossRef PubMed.
- L. Sun, H. Guo, J. Liang, B. Li and X. Huang, J. Lumin., 2018, 202, 403–408 CrossRef.
- K. Park, H. Kim and D. Hakeem, Dyes Pigm., 2017, 136, 70–77 CrossRef.
- X. Huang, B. Li and H. Guo, J. Alloys Compd., 2017, 695, 2773–2780 CrossRef.
- Y. Chu, Q. Zhang, Y. Li, Z. Liu, J. Xu, H. Zeng and H. Wang, J. Alloys Compd., 2017, 693, 308–314 CrossRef.
- X. Huang, H. Guo and B. Li, J. Alloys Compd., 2017, 720, 29–38 CrossRef.
- T. Sreena, P. P. Rao, A. K. Raj and T. A. Thara, J. Alloys Compd., 2018, 751, 148–158 CrossRef.
- X. Huang and H. Guo, RSC Adv., 2018, 8, 17132–17138 RSC.
- Y. Wang, J. Ding, Y. Li, L. Yang, X. Ding and Y. Wang, RSC Adv., 2016, 6, 42618–42626 RSC.
- H. Guo, X. Huang and Y. Zeng, J. Alloys Compd., 2018, 741, 300–306 CrossRef.
- P. Du, Y. Hua and J. S. Yu, RSC Adv., 2018, 8, 26676–26681 RSC.
- S. Zhang, H. Luo, Z. Mu, J. Li, S. Guo, Z. Li, Q. Wang and F. Wu, J. Alloys Compd., 2018, 757, 423–433 CrossRef.
- X. Huang and H. Guo, Dyes Pigm., 2018, 154, 82–86 CrossRef.
- M. Xie, Y. Li and R. Li, J. Lumin., 2013, 136, 303–306 CrossRef.
- H. Deng, Z. Gao, N. Xue, J. H. Jeong and R. Yu, J. Lumin., 2017, 192, 684–689 CrossRef.
- B. Li, X. Huang, H. Guo and Y. Zeng, Dyes Pigm., 2018, 150, 67–72 CrossRef.
- X. Li, D. Xu, X. Liu and H. Guo, RSC Adv., 2017, 7, 53839–53845 RSC.
- P. Du, Y. Guo, S. H. Lee and J. S. Yu, RSC Adv., 2017, 7, 3170–3178 RSC.
- J. Zhong, W. Zhao, L. Yang, P. Shi, Z. Liao, M. Xia, W. Pu, W. Xiao and L. Wang, RSC Adv., 2018, 8, 13054–13060 RSC.
- L. Li, W. Chang, W. Chen, Z. Feng, C. Zhao, P. Jiang, Y. Wang, X. Zhou and A. Suchocki, Ceram. Int., 2017, 43, 2720–2729 CrossRef.
- L. Li, Y. Pan, X. Zhou, C. Zhao, Y. Wang, S. Jiang, A. Suchocki and M. Brik, J. Alloys Compd., 2016, 685, 917–926 CrossRef.
- Z. Zhang, D. Ma, Y. Yue, M. Ma and R. Liu, J. Alloys Compd., 2015, 636, 113–116 CrossRef.
- L. Li, Y. Pan, W. Wang, Y. Zhu, W. Zhang, H. Xu, L. Zhou and X. Liu, J. Alloys Compd., 2018, 731, 496–503 CrossRef.
- Y. Onishi, T. Nakamura, H. Sone and S. Adachi, J. Lumin., 2018, 197, 242–247 CrossRef.
- K. Szczodrowski, J. Barzowska, N. Górecka and M. Grinberg, J. Alloys Compd., 2018, 748, 44–50 CrossRef.
- Y. Kang, B. Thuy, Y. Shimokawa, T. Hayakawa, S. Sakaida, L. Miao, S. Tanemura, S. Honda and Y. Iwamoto, J. Lumin., 2016, 169, 78–85 CrossRef.
- K. Uheda, H. Takizawa, T. Endo, H. Yamane, M. Shimada, C.-M. Wang and M. Mitomo, J. Lumin., 2000, 87, 967–969 CrossRef.
- H. Yang, L. Yu, L. Shen and L. Wang, Mater. Lett., 2004, 58, 1172–1175 CrossRef.
- Y. Naik, M. Mohapatra, N. Dahale, T. Seshagiri, V. Natarajan and S. Godbole, J. Lumin., 2009, 129, 1225–1229 CrossRef.
- F. Xiong, J. Luo, H. Lin, X. Meng, Y. Wang, H. Shen and W. Zhu, Optik, 2018, 156, 31–38 CrossRef.
- C. Guo, H. Jing and T. Li, RSC Adv., 2012, 2, 2119–2122 RSC.
- G. Corbel, M. Leblanc, E. Antic-Fidancev and M. Lemaıtre-Blaise, J. Solid State Chem., 1999, 144, 35–44 CrossRef.
- Z.-w. Zhang, L.-j. Wang, X.-j. Chu, P. Zhang, Y.-j. Cao, Y.-r. Xi, W.-g. Chen and D.-j. Wang, J. Alloys Compd., 2017, 695, 3220–3224 CrossRef.
- I. P. Sahu, D. Bisen, N. Brahme and R. K. Tamrakar, J. Mater. Sci.: Mater. Electron., 2015, 26, 10075–10086 CrossRef.
- P. Du, X. Huang and J. S. Yu, Chem. Eng. J., 2018, 337, 91–100 CrossRef.
- B. Wang, Q. Ren, O. Hai and X. Wu, RSC Adv., 2017, 7, 15222–15227 RSC.
- X. Huang, B. Li and H. Guo, Ceram. Int., 2017, 43, 10566–10571 CrossRef.
- D. Singh, S. Sheoran, V. Tanwar and S. Bhagwan, J. Mater. Sci.: Mater. Electron., 2017, 28, 3243–3253 CrossRef.
- Y. Meng, W. Zhao, L. Wang, Y. Zhou, M. He and Y. Zhu, J. Mater. Sci.: Mater. Electron., 2017, 28, 4984–4989 CrossRef.
- W. Ran, H. M. Noh, B. K. Moon, S. H. Park, J. H. Jeong, J. H. Kim, G. Liu and J. Shi, J. Lumin., 2018, 197, 270–276 CrossRef.
- Q. Shao, H. Ding, L. Yao, J. Xu, C. Liang and J. Jiang, RSC Adv., 2018, 8, 12035–12042 RSC.
- X. Zhang, J. Zhang and M. Gong, Opt. Mater., 2014, 36, 850–853 CrossRef.
- Q. Zhang, X. Wang, X. Ding and Y. Wang, Inorg. Chem., 2017, 56, 6990–6998 CrossRef PubMed.
- R. Yu, H. M. Noh, B. K. Moon, B. C. Choi, J. H. Jeong, K. Jang, S. S. Yi and J. K. Jang, J. Alloys Compd., 2013, 576, 236–241 CrossRef.
- H. Li, R. Zhao, Y. Jia, W. Sun, J. Fu, L. Jiang, S. Zhang, R. Pang and C. Li, ACS Appl. Mater. Interfaces, 2014, 6, 3163–3169 CrossRef PubMed.
- M. Janulevicius, P. Marmokas, M. Misevicius, J. Grigorjevaite, L. Mikoliunaite, S. Sakirzanovas and A. Katelnikovas, Sci. Rep., 2016, 6, 26098 CrossRef PubMed.
- L.-L. Wang, Q.-L. Wang, X.-Y. Xu, J.-Z. Li, L.-B. Gao, W.-K. Kang, J.-S. Shi and J. Wang, J. Mater. Chem. C, 2013, 1, 8033–8040 RSC.
- G. Zhu, Z. Li, C. Wang, F. Zhou, Y. Shi, Y. Wen and S. Xin, J. Mater. Sci.: Mater. Electron., 2018, 29, 2216–2221 CrossRef.
- M. Fuwang, C. Peican, G. Anxiang, W. ZHANG and Z. Liya, J. Rare Earths, 2015, 33, 1064–1071 CrossRef.
- Q. Sun, S. Wang, B. Li, H. Guo and X. Huang, J. Lumin., 2018, 203, 371–375 CrossRef.
- A. G. Bispo, D. A. Ceccato, S. A. Lima and A. M. Pires, RSC Adv., 2017, 7, 53752–53762 RSC.
- C. Feldmann, T. Jüstel, C. Ronda and D. Wiechert, J. Lumin., 2001, 92, 245–254 CrossRef.
- X. Zhao, J. Wang, L. Fan, Y. Ding, Z. Li, T. Yu and Z. Zou, Dalton Trans., 2013, 42, 13502–13508 RSC.
- A. R. Sharits, J. F. Khoury and P. M. Woodward, Inorg. Chem., 2016, 55, 12383–12390 CrossRef PubMed.
- J. Chen, Y. Liu, L. Mei, P. Peng, Q. Cheng and H. Liu, Sci. Rep., 2016, 6, 31199 CrossRef PubMed.
- S. H. Lee, Y. Cha, H. Kim, S. Lee and J. S. Yu, RSC Adv., 2018, 8, 11207–11215 RSC.
- X. Min, Y. Sun, L. Kong, M. Guan, M. Fang, Y. g. Liu, X. Wu and Z. Huang, Dyes Pigm., 2018, 157, 47–54 CrossRef.
- J. He, Z. Gao, S. Liu, J. H. Jeong, R. Yu and B. Deng, J. Lumin., 2018, 202, 7–12 CrossRef.
| This journal is © The Royal Society of Chemistry 2018 |

