
 Open Access Article
 This Open Access Article is licensed under a Creative Commons Attribution-Non Commercial 3.0 Unported Licence
In situ combined analysis of gases and electrochemical signals of an activated carbon-based supercapacitor at 2.7–4 V†
Jie Li,
Zhou Xu * and
ZhiAn Zhang*
* and
ZhiAn Zhang*
School of Metallurgy and Environment, Central South University, Changsha 410083, China. E-mail: csuxuzhou@163.com; zza75@163.com
First published on 18th September 2018
Abstract
An activated carbon (AC) electrode-based capacitor soft-pack was incorporated into a gas bag, and the gases, if produced during the charge and discharge of the capacitor, can be online analyzed by Gas chromatography. This method is effective to test the stability of capacitors using PC-based organic electrolytes up to 4 V. The kinetics of gas production was obtained and the components of the gases were analyzed quantitatively. Salts in the organic electrolyte were firstly decomposed, rather than the solvent, under the conditions of less water and AC with few functional groups. It provided new insight into understanding the stability of capacitors in high potential.
Supercapacitors (SCs) are widely used in many fields, owing to their extraordinary high power density and extra long cycling life.1–4 Most electrical double-layer capacitors (EDLCs) used commercially are based on an electrode of activated carbon (AC) and organic electrolytes in propylene carbonate (PC) or acetonitrile (AN) solvents, working at 2.7 V. Recently, potential application in vehicles (start-up acceleration and bracing) called for the sustainable increase of energy density of the device.1–9 The increase of working voltage is effective to increase the energy density of EDLC, but one should care the stability of electrode and electrolyte accordingly. The sp2 hybridized carbon nanomaterials, such as carbon nanotube and graphene, was promising as new electrode materials, considering their huge surface area, and higher chemical stability, higher accessible surface area and higher capacitance performance at 4 V,2,5–9 compared to AC. However, these new materials were of far lower yield and far higher cost, compared to AC, as well as the lower packing density. Conventional AC was produced from various sources from biomass or oil-derived precursor.10–13 In general, the activation process of AC, from biomass or oil-derived precursor, by using KOH, H2O or CO2, often brings about functional groups such as COOH, OH, –C
![[double bond, length as m-dash]](https://www.rsc.org/images/entities/char_e001.gif) O with mass loading of 5–20% on the AC. These functional groups is unstable upon charge at high voltage, resulting in the production of gases in large amount. The gases produced in device resulted in the poor contact of electrode with current collector, even the destroying of the device. The gas evolution was widely used in the past decades, which is also the key reason to limit the working potential of AC-based EDLC to 2.7 V for many years. But, with the technique development, it is now possible to reduce the oxygen content of AC as low as 0.5% to 2%, as well as to reduce the content of metal impurities.14,15 It deserved the re-visit on the gas evolution study of AC with high purity, considering the new possibility of the application in higher voltages.
O with mass loading of 5–20% on the AC. These functional groups is unstable upon charge at high voltage, resulting in the production of gases in large amount. The gases produced in device resulted in the poor contact of electrode with current collector, even the destroying of the device. The gas evolution was widely used in the past decades, which is also the key reason to limit the working potential of AC-based EDLC to 2.7 V for many years. But, with the technique development, it is now possible to reduce the oxygen content of AC as low as 0.5% to 2%, as well as to reduce the content of metal impurities.14,15 It deserved the re-visit on the gas evolution study of AC with high purity, considering the new possibility of the application in higher voltages.
In the present work, we report the gas evolution of EDLC with the commercial AC (YP50F) with very low oxygen amount as electrode and organic electrolyte (1 M MeEt3NBF4 in PC) from 2.7 V to 4 V. Electrochemical signals can be simultaneously obtained as analysing gases produced in charge and discharge, via incorporating a soft-pack of capacitor inside the gas bag. Time dependent gas volume and gas components was obtained, which suggested that the serious pseudo-capacitance occurred at the first charge at 2.7 V, but no gases were released at 2.7–3.5 V till the voltage was elevated to 4 V. Predominant gases produced at 4 V are different from those (propene and CO2) reported previously.16–19 The self-decomposition of salt, rather than the decomposition of solvent (PC), contributed to the most gases in the initial stage of charge. The result, in turn, reflected that the AC electrode was usable if optimizing the combination of electrode and electrolytes in high potential in the future.
Experimental
AC of YP-50F (produced by Kuraray Co., Japan) was treated to have an oxygen amount of 2%.13 AC was mixed uniformly with super P, adhesives (polymerized styrene butadiene rubber (SBR) and sodium carboxymethyl cellulose (CMC)) and de-ion water to make slurry with stirring of 300 rpm for 12 h. Then the slurry was pasted onto the two sides of flat Al foil (20 μm in thickness, current collector), as controlling the thickness of each side as 120 μm.The sheet was dried at 70 °C for 5 h and then dried at 120 °C for 24 h. Electrode of 4 sheets with size of 3 cm × 5 cm were separated with cellulose membrane and was sealed to fabricate a soft pack. The soft pack was further degassed for 24 h under 100 Pa and at 65 °C. Then electrolyte of 1 mol l−1 MeEt3NBF4 in PC was fed into the soft pack with the weight ratio of electrolyte to electrode as 2.5![[thin space (1/6-em)]](https://www.rsc.org/images/entities/char_2009.gif) :1. The soft pack, after staying static in vacuum for 2 h at 25 °C, was sealed tightly. The soft pack was charged at the current density of 0.01A g−1 to 2.7 V, 3.0 V, 3.5 V and 4.0 V. Since the soft pack was inside the gas bag and the volume of gas bag was far larger than that of soft pack, any gases produced can be online detected by GC (7890D), equipped with the TCD and FID detector. Time-dependent volume of gases was measured for several or several ten hours.
:1. The soft pack, after staying static in vacuum for 2 h at 25 °C, was sealed tightly. The soft pack was charged at the current density of 0.01A g−1 to 2.7 V, 3.0 V, 3.5 V and 4.0 V. Since the soft pack was inside the gas bag and the volume of gas bag was far larger than that of soft pack, any gases produced can be online detected by GC (7890D), equipped with the TCD and FID detector. Time-dependent volume of gases was measured for several or several ten hours.
The AC of YP50F was widely used as electrode in supercapacitor. It had surface area of around 1400 m2 g−1 and its pores were dominantly micropores.13 As shown in Fig. 1a, the SC pack and gas analysis sealed in one bag allowed the instant detection of electrochemical signal and gas component via GC. CV curves of the cell charged at 2.7 V, 3 V and 3.5 V at 0.1 A g−1 were recorded in Fig. 1b, respectively. The CV curves kept all perfect response without obvious redox peaks around in 2.7–3.5 V for AC electrode (YP50F) in PC-based electrolyte. Recent work proposed the contribution of pseudo capacitance on such perfect CV curves can be distinguished from that of electrical double-layer capacitance (EDLC), by varying the scanning rate and the correlation using some equations.4,20 Correlation suggested that the pseudo capacitance contributed to 50% in the total capacitance value at lower scanning rate (e.g. 5 mV s−1 at 4 V), but contributed to 20% at higher scanning rate (e.g. 30 mV s−1 at 4 V), which, however, is not our focus in the present work. Quantitatively, the specific capacitance of AC electrode increased with the potential (Fig. 1b), since the area enclosed increased drastically. EIS data under 0.1 A g−1, it is around 0.2 Ohm at 2.7 V, and increased to 0.25 Ohm if charging at 3.0 V and 3.5 V (Fig. 1c).
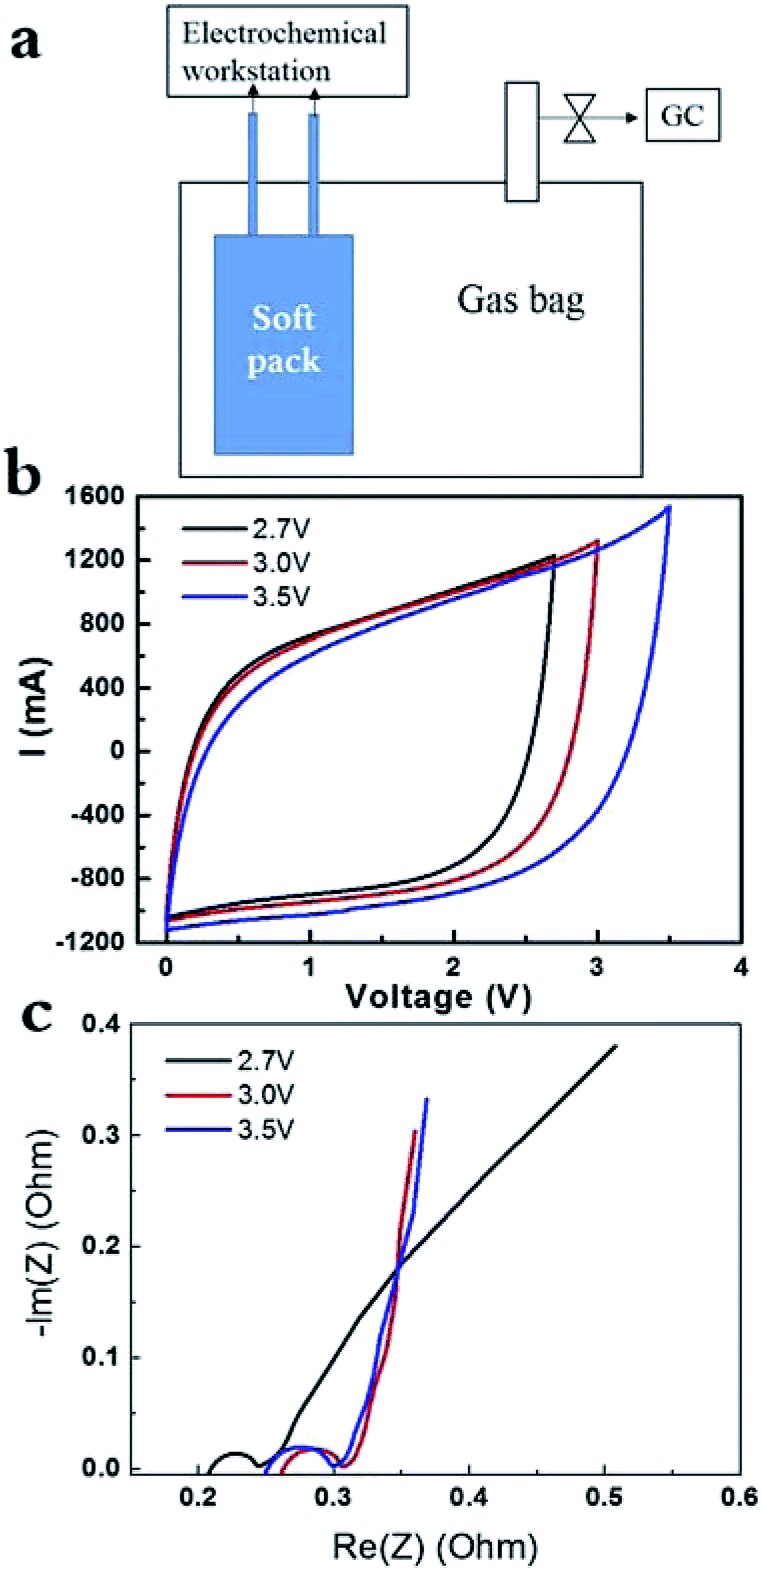 | ||
| Fig. 1 (a) SC soft pack and gas analysis sealed in one bag. (b) CV curves of the cell charged at 2.7 V, 3 V and 3.5 V, respectively. (c) EIS data of the cell charged at 2.7, 3 and 3.5 V, respectively. | ||
In addition, the capacitance didn't decrease drastically with the elevated current density in the range of 0.1–0.5 A g−1 at 3.5 V (ESI, Fig. SI-1a†). CV curves became relatively slope with the increase of current density, which is due to the limitation in power density. In addition, EIS data remained the same at various current densities (Fig. SI-1b†), suggesting the performance of soft pack of SC did not decreased drastically under high current densities at high voltage (3.5 V). As follows, we obtained the galvanostatic charge and discharge curves at 2.7 V, 3 V and 3.5 V (ESI, SI-2†). We are unable to observe the formation of gases at 2.7 V for 8 h, although serious pseudo-capacitance response appeared on the initial stage of charge and discharge (Fig. SI-2a†). After that, the galvanostatic charge and discharge curves turn to the normal curves at 2.7 V. Then, we elevated the operating voltages to 3 V with the same soft pack, all the charge and discharge curves are very normal, with no gases were released within 8 h. Similar cases were observed when the operating voltages were further elevated to 3.5 V and still no gases were produced with the same soft pack. Accordingly, the starting resistance of EIS data (in Fig. SI-1b†) didn't change significantly at 3.5 V. If gases in large amounts were produced, it would destroy the contact between AC electrode and Al foil (current collector) and would result in the drastic increase of contact resistance. It suggested that the AC of YP50, with oxygen amount of 2%, had relatively higher chemical stability at elevated potential, at least in a small sized device. The result is reasonable considering any CNTs or graphene with high chemical stability still had a content of oxygen in the range of 0.6–2%.5
However, if further elevating the operating voltages to 4 V, gases were produced rapidly with a very large pseudo-capacitance peak in the charge side (Fig. 2a). Actually, it took very short time for the potential increased from 0 V to 3.5 V, but took very long time for the potential increased from 3.5 V to 4 V. The pseudo-capacitance below 3.5 V is insignificant if compared to that between 3.5 V–4 V. It agrees very well with the volume of gases collected in the gas bag, which is very small below 3.5 V, but is very large at 4 V. The 1st stage of charge and discharge lasted for 18 h. The discharge line in this stage is relatively straight, suggesting the gases were mainly produced in the initial stage of charge (0–9 h). After that, the galvanostatic charge and discharge curves recovered the normal response (9–18 h), although there is still some redox response, but insignificant. It is noticed that the discharge time is shortened and the disclosed area under the charge and discharge curve became gradually smaller. The gases probably blew off the electrolyte in local region and influenced the diffusion of ions and the contact between electrode and current collector. Note that, when the gases were released off after 18 h in the 1st stage and the device were sealed and compressed again, the area enclosed under galvanostatic charge and discharge curve became larger to some degree (Fig. 2b). Then the gases were released again after 9 h and the device was compressed again. The area enclosed under galvanostatic charge and discharge curve of 3rd cycle (Fig. 2c) seemingly kept nearly unchanged as that in 2nd cycle.
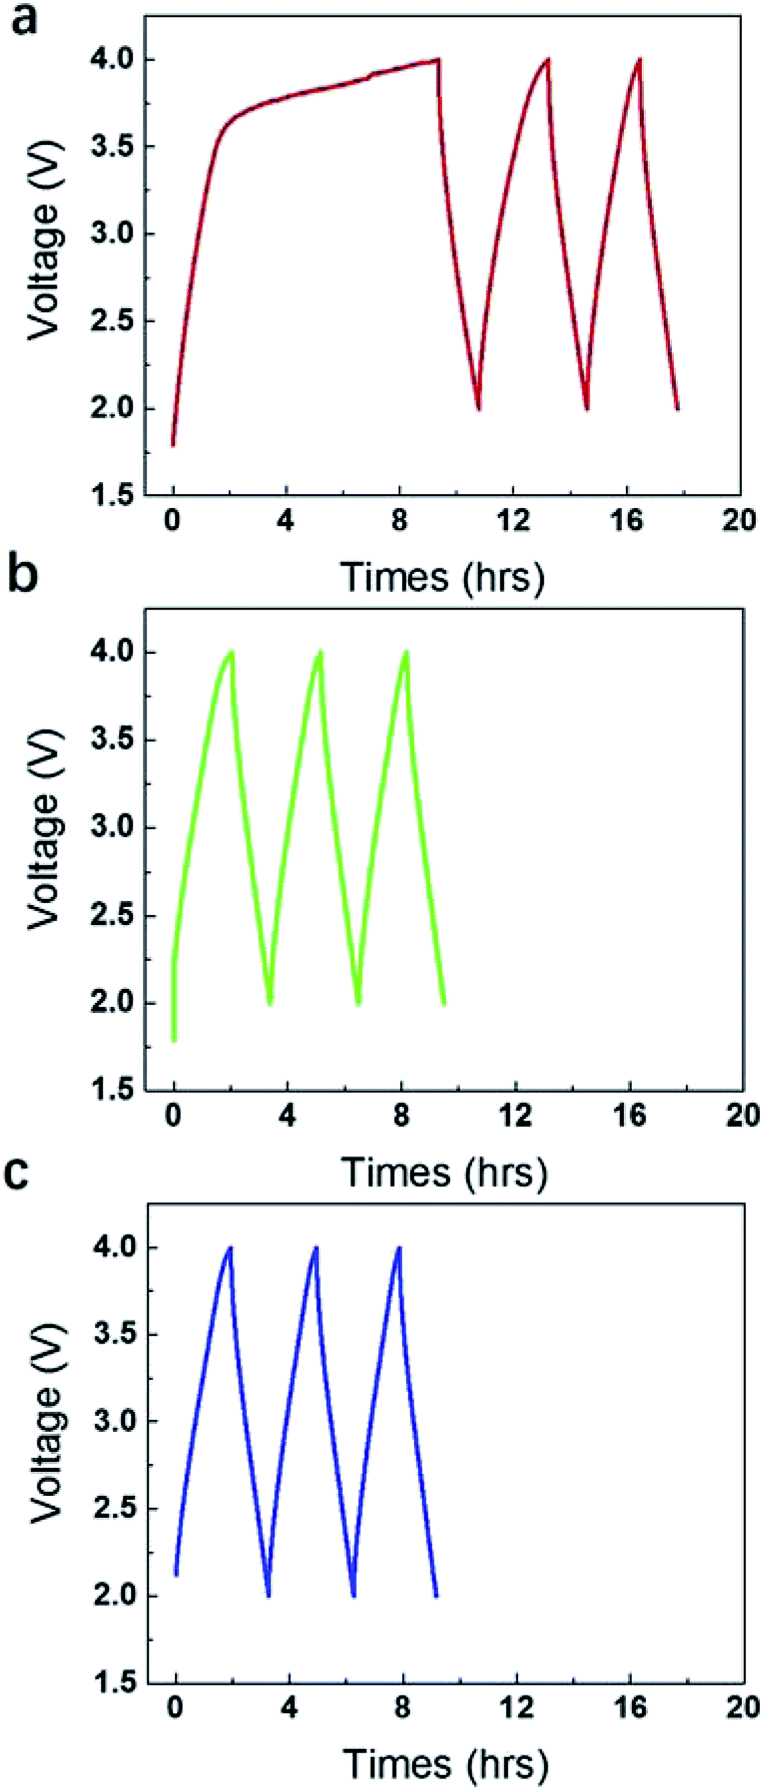 | ||
| Fig. 2 (a) Galvanostatic charge and discharge line at 4 V in the initial stage for 18 h. (b) Galvanostatic charge and discharge line at 4 V for 9 h after a, when the gases were released off and the device was sealed and compressed again. (c) Galvanostatic charge and discharge line at 4 V for 8 h after (b), when the gases were released off and the device was sealed and compressed again. | ||
As follows, we compared the efficiency of discharge/charge at different voltages (Fig. 3a). The efficiency at 1st charge is only 22%, suggesting the energy due to the pseudo-capacitance occurred is unable to discharge smoothly, but stored in liquid phase (electrolyte) in certain form, without released as gases. After that, the efficiency was increased to 78–85% at the following charge and discharge at 2.7 V, 3 V and 3.5 V (Fig. 3a). However, 58 ml gases were produced in 1st stage (18 h) at 4 V, exhibiting a low efficiency discharge/charge of 16%. It after that the volume of gases was significantly reduced in the 2nd stage and 3rd stage at 4 V, which is 10 ml for 9 h in 2nd stage and 3 ml for 8 h in 3rd stage. It suggested that the removal of functional groups or the decomposition of electrolyte mainly occurred in liquid phase at 2.7–3.5 V was mostly converted into gases at 4 V. Release of gases at 1st, 2nd and 3rd stage at 4 V is favourable for the recovery of the efficiency of discharge/charge to the level of 80–83%. In addition, we compared the absolute value of discharged energy of the soft pack of SC (Fig. 3b). The discharged energy kept the constant of 25 mA h at 2.7 V, regardless of the pseudo-capacitance in the first charge. In following charge at 3 V and 3.5 V, the discharged energy were also both stable at 29 mA h and 35 mA h, respectively. In addition, the discharged energy at 4 V is constant at 39–42 mA h, ignore of the gases produced in three stages, which were 58 ml in first 18 h, 10 ml in second 9 h and 3 ml in third 8 h, respectively. If fitting all data in different operating condition, the discharged energy of the soft pack is strictly proportional to the two orders of the operating voltages (Fig. 3c), where the R (stand error) is high up to 97%. These results all suggested that the soft pack with AC electrode worked smoothly and was not destroyed by gases produced by the removal of functional groups of AC or the decomposition of electrolyte up to 4 V.
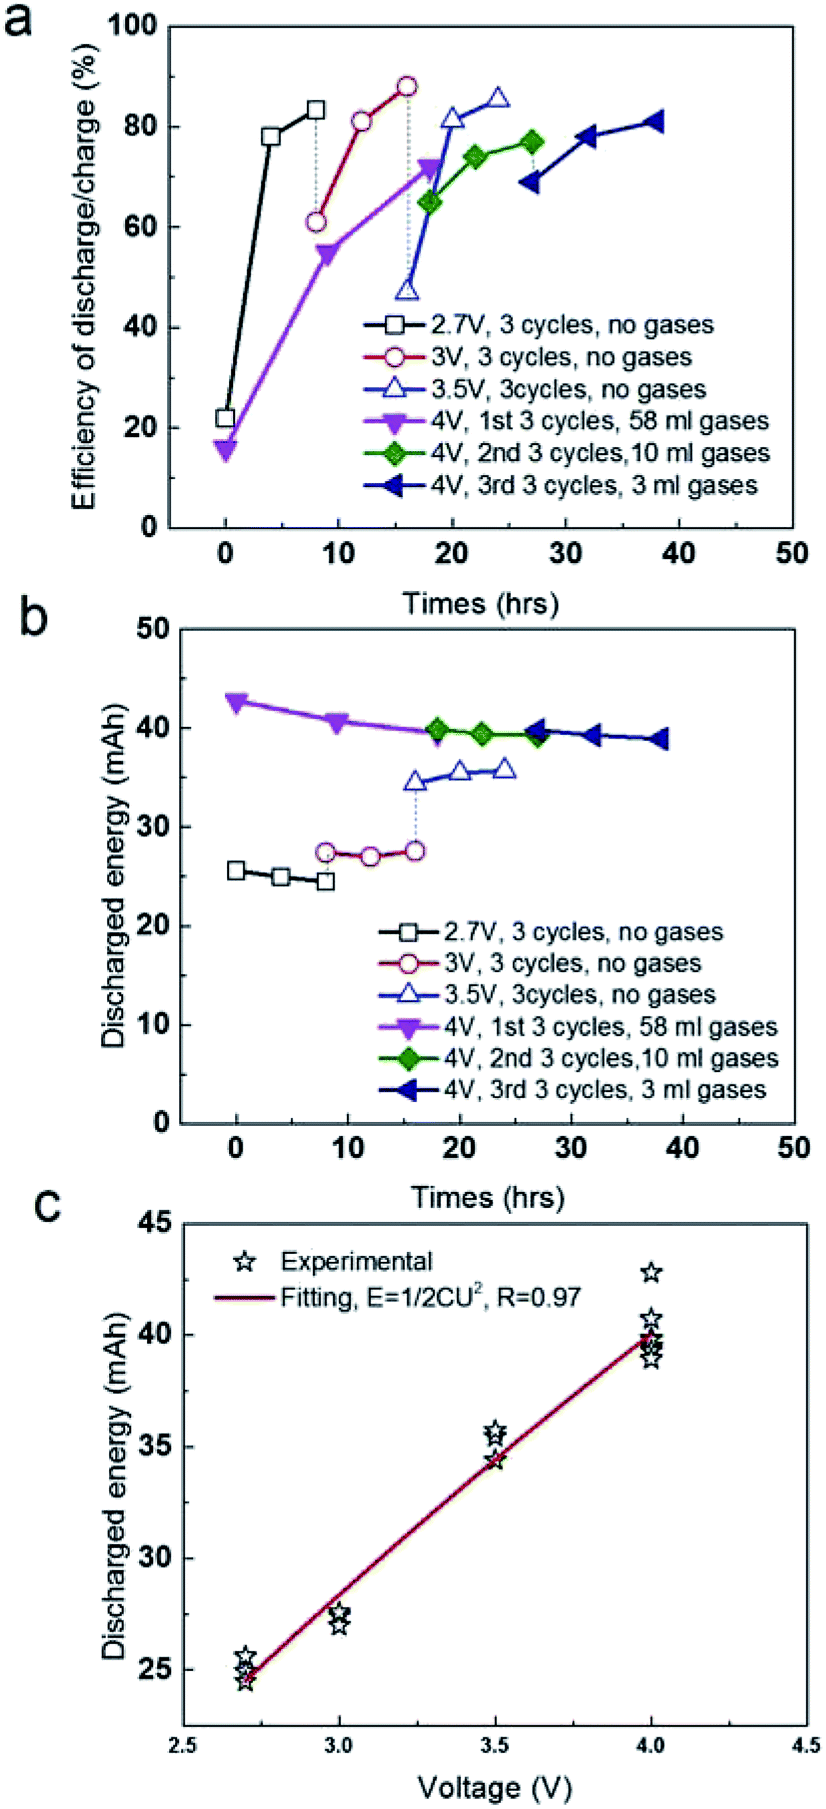 | ||
| Fig. 3 (a) Comparison of efficiency of discharge/charge in different voltages. (b) Comparison of discharged energy in different voltages. (c) Fitting the discharged energy with operating voltages. | ||
Calculation of the production rate of gases at 4 V (Fig. 4a) suggested it is 3.23 ml h−1 at 1st stage, 1.1 ml h−1 at 2nd stage and 0.37 ml h−1 at 3rd stage, respectively. The rapid decay trends of gas amount with the time at 4 V were in agreement with the conventional aging process of a very large device in voltage of 2.5–2.7 V previously. As follows, gas components were carefully analysed by the on-line GC (Fig. 4b). Since the gas analysis needed certain amount of gas with some pressure, it is difficult to accurate to determine the gases in the very beginning of charge. However, the average values of the gas components in different stages still provide useful information of the stability of the materials under high potential. In the 1st stage at 4 V, the gases included large amount of paraffins including CH4, C2H6, C3H8 and C4H10. The ratio of C2H6 is higher than C2H4. Similar, the ratio of C3H8 is higher than C3H6 and the ratio of C4H10 is higher than C4H8. Water in gases is undetectable by GC, but H2 if decomposed from water or other sources can be detected with high sensitivity. Actually, H2 in large amount appeared in the 2nd and 3rd stage. It implied that H2 was produced in the 1st stage, but was further consumed by other reactions. Actually, H2 was consumed in the production of paraffins by hydrogen transfer of olefins with the same carbon number. It explained well why the amount of paraffins were always higher than that of olefins with the same carbon number. In addition, the ratio of CH4 in 2nd and 3rd stage were much smaller than that in the 1st stage. The production of CH4 from the methyl groups also consumes H2 in large amounts. In addition, the ratio of olefins in 2nd and 3rd stage increased relatively, compared to that in 1st stage, suggesting that the hydrogenation of H2 became weak with the increase of charge time.
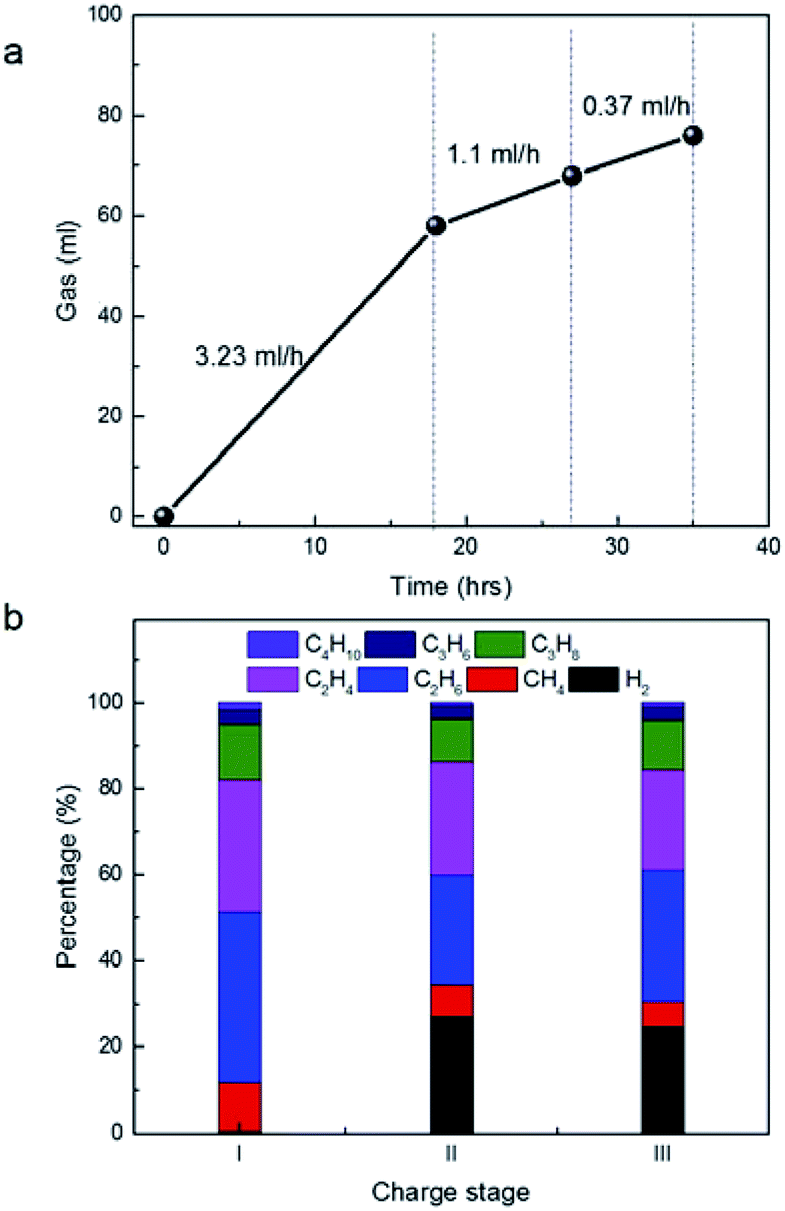 | ||
| Fig. 4 (a) Time-dependent gas volume in different charge stages at 4 V in this figure. (b) Time-dependent gas components in different charge stages at 4 V in (a). | ||
We noticed that the percentage of C3H6 and C3H8 is far smaller than that of C2H4 and C2H6. The result is in sharp contrast to the previous statement that C3H6 is the dominant product from the decomposition of PC.15–18 In addition, we are unable to detect CO2, which is also the main product by the decomposition of PC in previous works.19,20 In other words, if PC was decomposed significantly, nearly equal mole of CO2 and propene can be detected simultaneously. From the ion structure of the salt of MeEt3NBF4, its decomposition, in theory, would release directly 1 methyl group and 3 ethyl groups. Apparently, C2H4 and C2H6 were mainly produced from the direct decomposition of the salt, not from PC, which provided new information as operated at 4 V.
On the other hand, it is noticed that the volume ratio of ethane and ethylene to CH4 is far larger than 3:1 in any stage of the charge. If assumed that CH4 was produced mainly from the decomposition of the salt (MeET3NBF4), the excess of C2H4 and C2H6 will not originated from the salt but other sources (e.g. PC). Probably, the decomposition of PC contribute to not only the formation of C3 species, but also C2 and C4 species, similar to the disproportionation reaction in other systems.21,22 The disproportionation of C3H6 on AC is possible under an electro-catalytic condition and in the presence of H2. In addition, the data in 2nd and 3rd cycles indicated that the percentage of CH4 decreased a little bit, but the percentage of C3H6 and C3H8 remained nearly the same. It suggested the decomposition of the salt become weak when the water or oxygen containing gases were released at the end of first 18 h. However, their percentage of CH4 is still large in 2nd and 3rd cycles, suggesting that the decomposition of salt and PC in 2nd and 3rd run is not due to the presence of water or functional groups of AC, but probably due to the self decomposition by thermal effect.23
In addition, effect of H2O was also considered. If H2O existed, its percentage would be larger in the 1st stage than in 2nd and 3rd stage. Water is electrolysis to form H2 and O2 or to produce CO2 when O2 was further reacted with organics. The absence of CO2 in our result would be the direct evidence of the AC sample with less oxygen content and the effective removal of water in the processing. In addition, the presence of water in large amount will limit the elevation of the potential in the charge. Actually, water in small amount in the system is effective to suppress the formation of HF from the salt, favourable to the high stability of the Al foil in SC. In this case, it is concluded that the decomposition of the salt in electrolyte, serious than the solvent of PC, occurred as using AC with less oxygen amount under high voltage. Probably the latter (high voltage) played an important role. The intrinsic chemical stability of the salt would be important for the choice of the salt. Our study also suggested that the in situ method for charging and GC analysis simultaneously may be used as an effective tool to find useful combination of electrolyte (solvent-salt) and electrolyte. In addition, further investigation is needed to understand the serious pseudo-capacitance at the first charge at 2.7 V, but not forming gases till to 4 V.
In summary, we evaluated the gas evolution in the supercapacitor with AC electrode and electrolyte of PC-MeEt3NBF4. The serious pseudo-capacitance were recorded at the first charge at 2.7 V, but not forming gases till to 4 V. Gases were produced in larger amount in the initial stage and became lower with the time, which is in agreement with the previous work qualitatively. The composition of the gases is apparently different from the previous work that propene and CO2 is not the dominant product, but C2H4 and C2H6 from the salt. This work also validated the complicated cycle of H2 consumption, which is time dependent. These works are useful for the deep understanding of the chemical stability of organic electrolyte of SC under high potential.
Conflicts of interest
There are no conflicts to declare.Notes and references
- M. Inagaki, H. Konno and O. Tanaike, J. Power Sources, 2010, 195, 7880–7903 CrossRef.
- A. S. Arico, P. Bruce, B. Scrosatl, J. M. Tarascon and W. V. Schalkwijk, Nat. Mater., 2005, 4, 366–377 CrossRef PubMed.
- Y. F. Zhang and S. J. Park, Carbon, 2017, 122, 287–297 CrossRef.
- Y. Xia, T. S. Mathis, M. Q. Zhao, B. Anasori, A. Dang, Z. H. Zhou, H. S. Chol, Y. Gogotsi and S. Yang, Nature, 2018, 557, 409–412 CrossRef PubMed.
- C. Zheng, W. Z. Qian, C. J. Cui, Q. Zhang, Y. G. Jin, M. Q. Zhao, P. H. Tan and F. Wei, Carbon, 2012, 50, 5167–5175 CrossRef.
- X. W. Yang, C. Cheng, Y. F. Wang, L. Qiu and D. Li, Science, 2013, 341, 534 CrossRef PubMed.
- C. J. Cui, W. Z. Qian, Y. T. Yu, C. Y. Kong, B. Yu, L. Xiang and F. Wei, J. Am. Chem. Soc., 2014, 136, 2256–2259 CrossRef PubMed.
- Y. Wang, Y. P. Wu, Y. Huang, F. Zhang, X. Yang, Y. F. Ma and Y. S. Chen, J. Phys. Chem. C, 2011, 115, 23192 CrossRef.
- A. Izadi-Najafabadi, S. Yasuda, K. Kobashi, T. Yamada, D. N. Futaba, H. Hatori, M. Yumura, S. Iijima and K. Hata, Adv. Mater., 2010, 22, E235 CrossRef PubMed.
- G. Wang, Q. Dong, Z. Ling, C. Pan, C. Yu and J. S. Qiu, J. Mater. Chem., 2012, 22, 21819–21823 RSC.
- Z. H. Zhao, S. M. Hao, P. Hao, Y. H. Sang, A. Manivannan, N. Q. Wu and H. Liu, J. Mater. Chem. A, 2015, 3, 15049–15056 RSC.
- A. Bello, N. Manyala, F. Barzegar, A. A. Khaleed, D. Y. Momodua and J. K. Dangbegnon, RSC Adv., 2016, 6, 100–1809 Search PubMed.
- S. Porada, D. Weingarth, H. V. M. Hamelers, M. Bryjak, V. Presser and P. M. Biesheuvelef, J. Mater. Chem. A, 2014, 2, 9313–9321 RSC.
- K. Gadkaree and J. Liu, US Pat., US9006136B2, 2015.
- Y. T. Ju, M. Y. Cho, M. H. Kim, J. W. Lee, S. Y. Park, B. H. Choi and K. C. Roh, J Ceram. Process. Res., 2012, 13, s159–s162 Search PubMed.
- M. Hahn, A. Wursig, R. Gallay, P. Novák and R. Kötz, Electrochem. Commun., 2005, 7, 925–930 CrossRef.
- R. Kötz, M. Hahn, P. Ruch and R. Gallay, Electrochem. Commun., 2008, 10, 359–362 CrossRef.
- P. Kurzweil and M. Chwistek, J. Power Sources, 2008, 176, 555–567 CrossRef.
- P. Azäıs, L. Duclaux, P. Florian, D. Massiot, M. A. Lillo-Rodenas, A. Linares-Solano, J. P. Peres, C. Jehoulet and F. Bèguin, J. Power Sources, 2007, 171, 1046–1053 CrossRef.
- H. T. Sun, L. Mei, J. F. Liang, Z. P. Zhao, C. Lee, H. L. Fei, M. N. Ding, J. Lau, M. F. Li, C. Wang, X. Xu, G. L. Hao, B. Papandrea, I. Shakir, B. Dunn, Y. Huang and X. F. Duan, Science, 2017, 356, 599–604 CrossRef PubMed.
- K. Nishi, A. Hidaka and Y. Yokomori, Acta Crystallogr., 2005, 61, 160–162 Search PubMed.
- H. K. Min, S. H. Cha and S. B. Hong, ACS Catal., 2012, 2, 971–981 CrossRef.
- T. Yoon, M. S. Milien, B. S. Parimalam and B. L. Lucht, Chem. Mater., 2017, 29, 3237–3245 CrossRef.
Footnote |
| † Electronic supplementary information (ESI) available. See DOI: 10.1039/c8ra06568c |
| This journal is © The Royal Society of Chemistry 2018 |