 Open Access Article
Degradation of recalcitrant organics in landfill concentrated leachate by a microwave-activated peroxydisulfate process
Zhepei Gua,
Weiming Chenb,
Qibin Lib,
Ying Wanga,
Chuanwei Wub and
Aiping Zhang *a
*a
aKey Laboratory of Treatment for Special Wastewater of Sichuan Province Higher Education System, College of Chemistry and Materials Science, Sichuan Normal University, Chengdu 610066, China. E-mail: apzhang@sicnu.edu.cn; Tel: +86 13488951126
bFaculty of Geosciences and Environmental Engineering, Southwest Jiaotong University, Chengdu 611765, China
First published on 26th September 2018
Abstract
A microwave (MW)-activated peroxydisulfate (PDS) process was applied to remove recalcitrant organics in concentrated leachate. In this study, the optimum activation conditions were studied using the absorbance at 254 nm (UV254) and color number removal efficiencies and by comparison of the different processes. The inner oxidation mechanism was investigated by ultraviolet-visible (UV-vis) spectrophotometry and three-dimensional (3D) excitation–emission matrix (EEM) tests. The results show that oxidation effects followed the order MW/PDS > MW/H2O2 > heat/PDS. The efficiencies of chemical oxygen demand (COD) removal, UV254, and color number were 45.50%, 48.95%, and 88.35%, respectively. The biodegradability was enhanced to 0.23 under optimum conditions (initial pH of 3, MW irradiation power of 450 W, PDS dosage of 3.5 g L−1, and reaction time of 10 min). The UV-vis spectra suggest that the humification degree and aromaticity of organics in the concentrated leachate greatly declined in the MW/PDS process. 3D EEM spectra indicate that the molecular weight of organic substances in the concentrated leachate decreased markedly and that the constitution of the organics became simpler after the MW/PDS process. In a word, the MW/PDS process is a promising method for concentrated leachate treatment.
1. Introduction
Large quantities of leachates are produced by decomposition of municipal solid waste (MSW) in landfills by factors such as rainfall and runoff. Leachates have complex composition and are typically heavily contaminated, very hazardous, and difficult to treat.1,2 Many organic pollutants in leachate are included in USEPA's list of priority pollutants. Leachate that is treated improperly can lead to heavy pollution of the surrounding water and soil. Reverse osmosis (RO) and nanofiltration (NF), a method combining a biological process and membrane technology, is capable of removing almost all of the organic pollutants in leachates, but it has the main drawback of producing concentrated leachate at proportions of 0.5–30%.3,4 Concentrated leachate contains a high concentration of recalcitrant macromolecular organics, hazardous organics, and residual metal ions;5 in addition, its high concentration of salt would be intercepted by the membrane. Hence, efficient treatment using a biological process is difficult to achieve.At present, common treatment technologies for concentrated leachate include recirculation, concentration, coagulation, and advanced oxidation processes (AOPs). The cost of recirculation is low, and this method can accelerate the stabilization of MSW, but it is not capable of effectively degrading recalcitrant organics and removing salts.6,7 Additionally, leachate treatment is influenced by the production effluent and the quality of RO and NF technology.8 Membrane technology can effectively decrease the COD, BOD5, and total nitrogen content;9–11 however, it is constrained by the limited service life of RO and NF membranes and by the increasing treatment expense due to membrane pollution by extremely high concentrations of humic acid and fulvic acid.12 Coagulation is widely applied to the pretreatment of concentrated leachate because of its convenient operation and its low cost; however, it is not very effective in removing organics in concentrated leachate.13 AOPs play an important role in water treatment,14–17 utilizing produced radicals with strong oxidizing ability, (·OH and SO4˙−), thus effectively degrading organics in concentrated leachate.18,19 Although AOPs have many advantages such as high reaction rate and high treatment efficiency, the high cost of their processing has mainly constrained their application. Fenton and ozone method are the most common AOPs. The conventional Fenton method is limited by its low reaction rate, strict pH condition, low utilization of H2O2, and production of iron sludge.20,21 The ozone method is limited by the high production cost of ozone and its low utilization. Moreover, the treatment efficiency of single AOPs is quite limited.
Persulfate (as peroxymonosulfate or peroxydisulfate, PDS) is well known for its stable capacity and high water solubility. It has attracted much attention as a Fenton-like reagent in wastewater treatment since the publication of studies of Anipsitakis and Dionysiou.22,23 Persulfate has low oxidizing capacity (E0 = 2.01 V), but after activation by factors such as such as heat, ultraviolet radiation, ultrasound, microwave (MW) (eqn (1)), and transition metals (eqn (2)),23–27 it can generate sulfate radical (SO4˙−). This radical has a high oxidation potential, i.e., 2.6 V, which is close to that of hydroxyl radical (E0 = 2.8 V, half-life < 1 s). It also has a long half-life, i.e., 4 s,28,29 which enables it to oxidize recalcitrant organics at high efficiency. Many activation methods use much energy, thus increasing the treatment cost, and transition-metal activation leads to secondary pollution due to metal corrosion and metal recycling.30 Thus, an economic and efficient activation method for persulfate activation is urgently needed.
 | (1) |
| S2O2−8 + Mn+ → SO4˙− + SO2−4 + Mn+1 | (2) |
MW is an electromagnetic wave with a frequency of 300 MHz to 300 GHz and has both thermal and non-thermal effects. In contrast to conventional heating, MW heating can cause dipolar molecules to rotate and collide and thus raise them to an excited state, which increases the collision possibility and reduces the reaction time.31 Because of the thermal and non-thermal effects of MW irradiation, persulfate can produce sulfate radical, which can effectively degrade acid orange 7,32 reactive yellow 145,33 sulfamethoxazole,34 and pentachlorophenol35 in aqueous solution. In particular, MW can substantially increase the reaction rate as compared with conventional heating.36 Kim37 systematically studied the decomposition of landfill leachate by persulfate under MW assistance and proved that this process is capable of removing organics from landfill leachate. However, few works have investigated the application of the MW/PDS process as a pretreatment for concentrated leachate. Few also have compared the oxidation efficiencies and degradation mechanisms of the heat/PDS, MW/H2O2, and MW/PDS processes.
In the present study, we aimed (1) to study the effects of persulfate dosage, MW irradiation power, and initial pH in the process on the degradation efficiency of recalcitrant organics; (2) to compare different processes for concentrated leachate treatment; and (3) to investigate the oxidation mechanism in each process and compare them using ultraviolet-visible (UV-vis) spectra and three-dimensional excitation–emission matrix (3D EEM) spectra.
2. Materials and methods
2.1 Concentrated leachate samples
Concentrated leachate samples were collected from a landfill in southwestern China that adopts a technology with the combination process of anoxic oxic (A/O), anoxic oxic (A/O), membrane bioreactor (MBR), and nanofiltration (NF) or reverse osmosis (RO). The daily capacity of membrane filtration for the concentrated leachate is 200 m3 d−1. Each concentrated leachate's color was originally dark brown, and it had no obvious stench. Characteristics of the concentrated leachate are listed in Table 1. According to the 3D EEM spectrum, the fluorescence index (f450/500) is 1.61, showing that the concentrated leachate was mainly terrigenous and of biological origin. Its humification index (8.96) shows that the humification degree is high; its biological source index (0.92) indicates that it originated from an autogenous medium. In all, the collected concentrated leachate has typical characteristics of a recalcitrant pollutant.2.2 Reagents
Potassium persulfate (K2S2O8), hydrogen peroxide (H2O2), sodium hydroxide (NaOH), and other reagents, all of analytical grade, were purchased from Kelong Co. Ltd., Chengdu (China). The MW irradiation initiator (M1-211A) was from Midea Co. Ltd. (China).2.3 Experimental procedure
First, 100 mL of concentrated leachate (pH adjusted using NaOH and H2SO2) was transferred to a 250 mL round-bottom flask. A preset dosage of PDS was then added, and the flask was placed in the MW initiator. After a preset reaction time, the MW oven was switched off, and the flask was cooled in ice water. After the sample was cooled, it was filtered through 0.45 μm glass fiber filters and then water testing was conducted.2.4 Analytical methods
The COD of samples was determined by MW rapid digestion titration method, in accordance with the Water Quality-Determination of the Chemical Oxygen Demand-Dichromate Method (HJ 828-2017).38 BOD5 was determined by following the Water Quality-Determination of Biochemical Oxygen Demand after 5 Days (BOD5) for Dilution and Seeding Method (HJ 505-2009).38 The absorbance of the sample at 254 nm (UV254) was analyzed to ascertain the amount of humic acid. The color number was evaluated from that the absorbances of sample at 436, 525, and 620 nm (A436, A525, and A620 respectively; eqn (3)) in order to determine the content of humic substance in the concentrated leachate. The COD removal efficiency was calculated using eqn (4):
 | (3) |
 | (4) |
UV-vis spectrometry using 1 cm quartz cells was applied to record the absorbances of samples from 220 to 800 nm and to reveal the degradation extent of organics in the concentrated leachate. The sample was filtered through a 0.45 μm glass fiber filter after elimination of residual hydrogen peroxide and then diluted with ultrapure water obtained by secondary reverse osmosis. A Perkin-Elmer Lambda 950 UV-vis spectrometer (USA) was used. The test wavenumber range was 220–600 nm, and the scan interval was 1 nm.
3D EEM spectra were used to characterize the aromatic dissolved organic matter (DOM) in concentrated leachate. Synchronized adsorption was observed using 3D fluorescence spectra obtained with a Horiba Scientific Aqualog-UV-800-C (USA). The excitation wavelength slit width was 5 nm, the scan speed was 500 nm min−1, the excitation wavelength was 239–550 nm, and the emission wavelength was 230–650 nm. 3D EEM spectra were obtained using a CCD detector. Ultrapure water was used to obtain the blank value, and Rayleigh scattering and Raman scattering were eliminated by using a Horiba Scientific software kit. Spectra were constructed and the isoheight was set using Origin 9.0 software.
3. Results and discussion
3.1 Effects of PDS dosage on the efficiency of concentrated leachate degradation
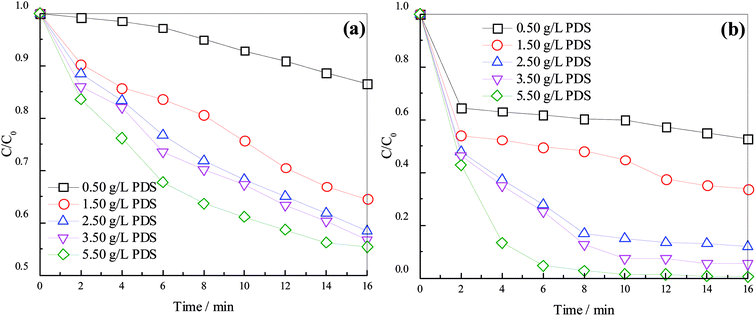
On the basis of the MW activation process, the effects of PDS dosage on degradation efficiency of concentrated leachate were investigated using the UV254 and color number. Fig. 1 shows the degradation efficiencies of concentrated leachate.As shown in Fig. 1, UV254 and color number decreased with the reaction time in the process, indicating that an increasing dosage of PDS enhanced the degradation of organics. Removal efficiencies as indicated by UV254 and color number increased from 13.45% and 47.35% to 44.57% and 94.63%, respectively, when the reaction time was 16 min and as the PDS dosage increased from 0.50 g L−1 to 5.50 g L−1. The results indicate that more active species formed with the increase in PDS dosage, thus strengthening the oxidizing ability and accelerating the degradation of organics, consistent with the conclusion of Qi.34,36 At a reaction time of 16 min, removal efficiencies of UV254 and color number increased by 28.20% and 40.73%, respectively, when the PDS dosage increased from 0.50 to 2.50 g L−1. Further increase in PDS dosage to 3.50 and 5.50 g L−1 apparently did not increase the removal efficiencies. We can see that a PDS dosage of 3.50 g L−1 was optimal, considering the economical aspect; the removal rate first increased, and finally tended to decrease more slowly under this condition. In the early stage of reaction, MW can pyrolyze organics and destroy their chemical bonds;31 meanwhile, PDS can undergo activation, producing sulfate radical, which oxidizes organics in wastewater. In the later stage of reaction, the concentration of organics decreased, thus stopping reaction despite the increase in sulfate radical concentration. On the other hand, the excessive PDS can quench sulfate radical (eqn (5)). A similar process was reported by Hori.39 Sulfate radical is also a scavenger for itself (eqn (6)), resulting in consumption of a large amount of oxidized matter and the weakening effect of sulfate radical due its decreasing quantity. However, the removal efficiency was relatively stable because of the compensation of thermal and non-thermal effects of MW with the decrease in radicals concentration.40
| SO4˙− + S2O2−8 ↔ SO2−4 + S2O8˙− | (5) |
| SO4˙− + SO4˙− → S2O2−8 | (6) |
3.2 Effects of pH on the degradation of concentrated leachate
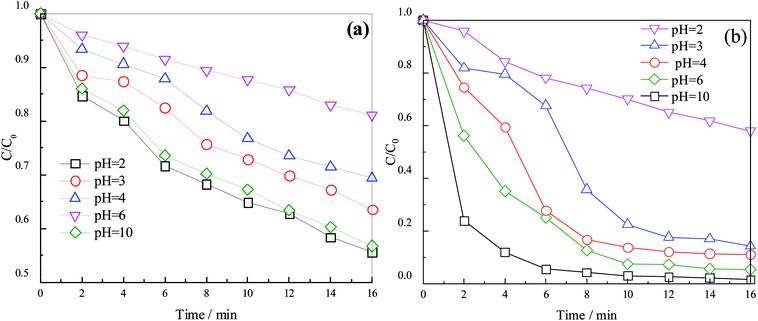
The species and quantity of radicals are related to the pH. Sulfate radical is dominant under acidic conditions, and hydroxyl radical is dominant under neutral and alkaline conditions (Liang, 2009). Hence, the effects of pH (2, 3, 4, 6, and 10) on the degradation efficiency in the process were studied (results are shown in Fig. 2).Different pH levels had large impacts on the removal of organics, as shown in Fig. 2. Clearly, acidic conditions enhanced the removal. At a reaction time of 16 min, the UV254 and color number increased from 18.96% and 42.06% to 44.41% and 98.31%, respectively, when the pH decreased from 10 to 2. This result can be explained as follows. First, persulfate has a certain oxidation capacity (E0 = 2.01 V) that can lead to production of sulfate radical (E0 = 2.60 V) by MW activation (eqn (1)). Second, these reactions can take place under acidic conditions (eqn (7) and (8)), increasing the production of sulfate radical and thus enhancing the UV254 and color number. Third, sulfate radical can react with OH− to form hydroxyl radical under alkaline conditions (eqn (9)). However, sulfate radical (half-life = 4 s) has stability better than that of hydroxyl radical (half-life of <1 s; Nosaka, 2002), and it has the same oxidation capacity as hydroxyl radical under acidic conditions.23 Thus, the generation of hydroxyl radical under alkaline conditions reduced the amount of sulfate radical to a certain degree, and low pH showed a positive effect on UV254 and color number. Moreover, when the pH decreased from 10 (alkaline condition) to 6 (acid condition) and the reaction time reached 16 min, the UV254 and color number were remarkably enhanced. The UV254 did not change as much as that of color number; this may because radicals in the process first react with chromophores, decompose them into micromolecular organics, and then continuously react with radicals.
| S2O2−8 + H+ → HS2O−8˙ | (7) |
| HS2O−8 → SO4˙− + SO2−4 + H+ | (8) |
| SO4˙− + OH− → SO2−4 + ·OH | (9) |
3.3 Effects of MW irradiation power on the degradation of concentrated leachate
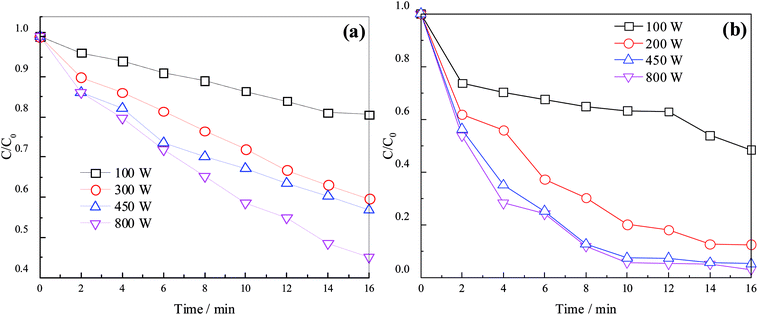
Sulfate radical can be produced from PDS by MW activation. The production of sulfate radical is vital to the degradation of organics in concentrated leachate. The effects of different MW irradiation powers (100, 300, 450, and 800 W) on UV254 and color number are shown in Fig. 3.As illustrated in Fig. 3, the removal efficiency increased with the MW power. At a reaction time of 16 min, UV254 and color number increased from 19.45% and 51.56% to 54.94% and 96.89%, respectively, when the MW irradiation power increased from 100 to 800 W. The temperature of the sample rose faster with rising MW irradiation power, and the quantity of sulfate radical increased because of the thermal effect of MW irradiation. On the other hand, an increase in MW irradiation power enhanced the reactivity of dipolar molecules, which absorbed the MW irradiation, and the probability of collision between molecules, thus increasing the reaction rate. Meanwhile, the non-thermal effect of MW irradiation can decrease the reaction activation energy, further shortening the reaction time. Removal efficiencies at 450 and 800 W were similar, implying that MW irradiation power reached optimum condition. In addition, the removal efficiency before 10 min was much higher than that after 10 min. This can be explained by the increased production of sulfate radical and oxidation rate due to the gradual rise of process temperature and the increase in the amount of sulfate radical.33 Before 10 min, a large amount of sulfate radical could oxidize most organics effectively; after 10 min, most organics were degraded, and changes in the removal efficiency were not obvious. On the basis of the above observations, the optimum conditions were an MW irradiation of 450 W and a reaction time of 10 min.
3.4 Comparison of different processes and analysis of biodegradability
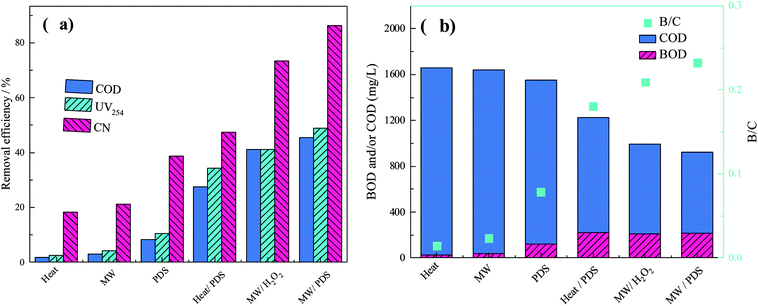
The characteristics of different processes on the degradation of organics at a temperature of 85 °C, MW irradiation power of 450 W, PDS dosage of 3.5 g L−1, and H2O2 dosage of 0.24 g L−1 are shown in Fig. 4.As shown in Fig. 4, the removal efficiency of the MW/PDS process was much higher than those of the other processes. The removal efficiencies of conventional heat and single MW processes were 1.75% and 2.99% (COD), 2.59% and 4.05% (UV254), and 18.41% and 21.23% (color number), respectively; in addition, biodegradability in both processes was extremely low (heat, 0.01 and MW, 0.02). In the absence of oxidizing reagents, COD removal efficiencies, UV254, and color number were low; however, the MW process results were better than those of the heat process. Heat alone can volatilize some of the organics with low boiling point, resulting in low removal efficiency. On the other hand, the thermal and non-thermal effects of MW irradiation can destroy unstable chemical bonds with increasing process temperature, thus giving good results. However, conventional heat and single MW processes did not have an obvious effect on the organic composition of wastewater on a macroscopic level.
In the PDS, heat/PDS, and MW/PDS processes, the removal efficiencies were 8.37%, 27.46%, and 45.50% (COD); 10.37%, 34.36%, and 48.95% (UV254); and 38.73%, 47.39%, and 86.35% (color number), respectively. Additionally, the biodegradability of the samples after the processes were 0.08 (PDS), 0.18 (heat/PDS), and 0.23 (MW/PDS), indicating that the MW/PDS process can effectively degrade recalcitrant organics in wastewater and enhance the biodegradability remarkably. In the presence of an oxidizing reagent (PDS, E0 = 2.01 V), the PDS process had better removal efficiencies than those of conventional heat and MW processes. Both the heat/PDS and MW/PDS process produced sulfate radical (E0 = 2.6 V) and gave good results, but the MW/PDS process had better removal efficiency. MW activated the PDS process, which produced sulfate radical. On the other hand, MW irradiation is more effective than heat because MW irradiation can cause dipolar molecules to rotate and vibrate intensely, increasing the probability of contact between organic molecules and oxidation reagents. To sum up, the MW/PDS process can produce radicals, resulting in high efficiency of removal of organics in wastewater.
In the MW/H2O2 and MW/PDS processes, the removal efficiencies were 41.12% and 45.50% (COD), 41.00% and 48.95% (UV254), and 73.49% and 88.35% (color number), respectively. Both processes could effectively decrease the COD of wastewater and enhance the biodegradability to 0.21 (MW/H2O2) and 0.23 (MW/PDS). Overall, the MW/PDS process had better results. MW activated H2O2, producing hydroxyl radical (E0 = 2.8 V), which can effectively oxidize organics in wastewater and enhance biodegradability. But extension of the reaction time caused mineralization of organics and a decrease in pH in the process, resulting in reduction of H2O2 to H2O and decreasing the production of hydroxyl radical. On the other hand, PDS can produce a large amount of sulfate radical by MW activation with increasing temperature and declining pH (eqn (7) and (8)), as reported in studies of Qi.34,41 Thus, the MW/PDS process can remarkably enhance the wastewater treatment efficiency.
3.5 UV-vis spectra analysis of the different processes
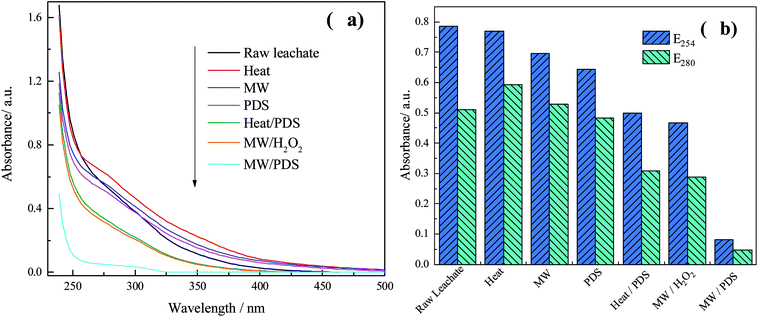
The absorbance in the UV-vis spectra was related to the species and concentration of the organics in wastewater. In the ultraviolet region (200–380 nm), the absorbance was related to the complexity and amount of aromatic compounds in wastewater. To analyze the degradation characteristics in the different processes, the variation of dissolved organic matter was investigated. The UV-vis spectra from the different processes and the specific absorbance values are shown in Fig. 5.As demonstrated in Fig. 5, the absorbance was related to the concentration of organics; however, the absorbance decreased to different extents after each process. It is worth noting that the absorbances for the heat, MW, and PDS processes were higher than those of raw concentrated leachate. This result can be explained by the absence of oxidants in the heat and MW processes; both have thermal effects and water may evaporate as the reaction time increases, resulting in an increment of the concentration of organics. The complexity of the PDS process might increase because of the addition of oxidants; however, the oxidation effect was not good because there was no activation. Hence, the incomplete oxidation might result in the production of many relatively small molecules and aromatic substances. Overall, the absorbances follow the trend heat > MW > PDS > raw concentrated leachate. However, a significant decrease occurred in the heat/PDS, MW/H2O2, and MW/PDS processes, especially, in the MW/PDS process, suggesting that the three processes can destroy the molecular structure of organics and decrease the aromaticity and complexity of wastewater.
Both E254 and E280 (absorbance at 254 and 280 nm, respectively) represent the aromaticity of organics in concentrated leachate.2,42,43 In addition, a significant peak at 220–250 nm indicates that the organics in concentrated leachate contain conjugated and unsaturated bonds.44 A visible absorbance peak in the 250–290 nm range shows that concentrated leachate contained aromatic heterocyclic rings.2 Moreover, the absorbance at 290–350 nm shows that the DOM had carbonyl groups, conjugated groups, or both.45 E254 and E280 in the MW/PDS process sharply decreased from 0.79 and 0.51 to 0.08 and 0.04, respectively, revealing that the aromaticity of organics in the concentrated leachate declined substantially. In addition, each absorption value in the different processes (heat/PDS, MW/H2O2, and MW/PDS processes) greatly decreased. This shows that these processes can effectively destroy the structure of recalcitrant organics in concentrated leachate, leading to a tendency for a simple constitution of the concentrated leachate. Overall, the results obtained in the UV–vis analysis are consistent with the COD and biodegradability.
3.6 3D EEM spectrum analysis of samples before and after the different processes
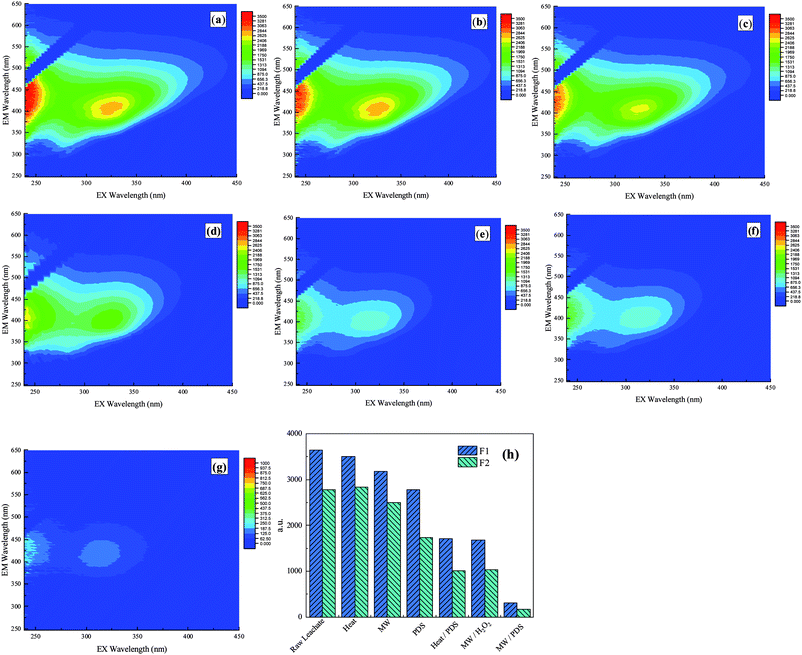
3D EEM spectra were widely used to characterize the dissolved organic matter and to determine the fluorescence index, humification degree, and molecular weight.46–49 To investigate the removal efficiencies of the humic substances in the different processes, 3D EEM spectra of the samples after the different processes are compared and illustrated in Fig. 6. In the spectrum, F1 (λEx/λEm = 310–360 nm/370–450 nm) represents substances resembling fulvic acid in the visible region, which are mainly relative stable, and macromolecular aromatic substances.49,50 F2 (λEx/λEm = 235–255 nm/410–450 nm) represents the substances resembling fulvic acid in the ultraviolet region, which are mainly small-molecular-weight and high-fluorescence-intensity matter.51–54 The above results show that the concentrated leachate contained a large amount of recalcitrant organics.As shown in Fig. 6, the fluorescence peak values of raw concentrated leachate were 3467.86 (F1) and 2775.07 (F2), and each fluorescence peak value was different. In the different processes, the fluorescence peak values of substances resembling fulvic acid in the ultraviolet and visible regions decreased after each process. In the conventional heat and MW process, the removal efficiencies at the fluorescence peak values were low because of the absence of oxidants; however, a better result was observed in the MW process because of the non-thermal effect. In the PDS, heat/PDS, and MW/PDS processes, the values of F1 and F2 decreased to 2780.67, 1709.99, and 312.15 (F1) and to 1735.87, 1012.92, and 164.78 (F2), respectively. These results reveal that MW can effectively activate PDS and enhance the oxidizing ability of the process. Comparison of the MW/H2O2 and MW/PDS processes showed that the peak values of both F1 and F2 decreased significantly and that the removal efficiencies were 52.03% and 63.48% (MW/H2O2) and 91.09% and 94.17% (MW/PDS), respectively. These findings suggest that these processes were capable of degrading substances resembling fulvic acid in both the ultraviolet and visible regions, and that the MW/PDS process was more effective in the degradation of organics than was the MW/H2O2 process. After MW/PDS treatment, the fluorescence peak of raw concentrated leachate shifted from 239 nm and 454 nm and from 326 nm and 407 nm to 239 nm or 447 nm and 410 nm, respectively, indicating that the molecular weight and humification degree declined remarkably and that the constitution of organics tended to be relatively simple after oxidation in the process.55,56
4. Conclusions
In this study, MW-activated PDS process proved to be a promising method for the treatment of concentrated leachate. By investigating the effects of PDS dosage, pH change, and MW irradiation power, the COD removal efficiencies, UV254, and color number were found to be 45.50%, 48.95%, and 88.35%, respectively. The biodegradability was markedly enhanced to 0.23 at a PDS dosage of 3.5 g L−1, an MW irradiation power of 450 W, and a reaction time of 16 min. The, MW/PDS process proved to be the most efficient process in enhancing the effluent quality among the different treatment processes. The UV-vis spectra suggest that the humification degree of concentrated leachate decreased and that the constitution of organics in the concentrated leachate tended to be simple. By analyzing 3D EEM spectra, we found that the concentration of substances resembling fulvic acid in concentrated leachate decreased substantially, that the humification degree declined, and that the recalcitrant macromolecular organics decomposed to relatively simple small-molecule organic substances.Conflicts of interest
There are no conflicts to declare.Acknowledgements
The authors gratefully acknowledge the financial support of the Key Laboratory of Treatment for Special Wastewater (SWWT2015-4).References
- A. Imai, T. Fukushima, K. Matsushige, Y. H. Kim and K. Choi, Water Res., 2002, 36, 859–870 CrossRef CAS PubMed.
- K. H. Kang, H. S. Shin and H. Park, Water Res., 2002, 36, 4023–4032 CrossRef CAS PubMed.
- D. Dolar, K. Košutić and T. Strmecky, Sep. Purif. Technol., 2016, 168, 39–46 CrossRef CAS.
- J. Huang, J. Chen, Z. Xie and X. Xu, Environ. Technol., 2015, 36, 1001–1007 CrossRef CAS PubMed.
- J. L. de Morais and P. P. Zamora, J. Hazard. Mater., 2005, 123, 181–186 CrossRef PubMed.
- H. D. Robinson and P. J. Maris, Water Res., 1983, 17, 1537–1548 CrossRef CAS.
- I. A. Talalaj and P. Biedka, Ecol. Eng., 2015, 85, 185–192 CrossRef.
- H. Wang, Y. N. Wang, X. Li, Y. Sun, H. Wu and D. Chen, J. Waste Manage., 2016, 56, 271–279 CrossRef CAS PubMed.
- Z. Li, S. Zhou and J. Qiu, Environ. Eng. Sci., 2007, 24, 1245–1256 CrossRef CAS.
- W. Rukapan, B. Khananthai, T. Srisukphun, W. Chiemchaisri and C. Chiemchaisri, Water Sci. Technol., 2015, 71, 580 CrossRef CAS PubMed.
- Y. Zhou, M. Huang, Q. Deng and T. Cai, Desalination, 2017, 420, 99–105 CrossRef CAS.
- Q. Q. Zhang, B. H. Tian, X. Zhang, A. Ghulam, C. R. Fang and R. He, J. Waste Manage., 2013, 33, 2277–2286 CrossRef CAS PubMed.
- Y. Long, J. Xu, D. Shen, Y. Du and H. Feng, Chemosphere, 2017, 167, 512–519 CrossRef CAS PubMed.
- F. Chen, Q. Yang, Y. Zhong, H. An, J. Zhao, T. Xie, Q. Xu, X. Li, D. Wang and G. Zeng, Water Res., 2016, 101, 555–563 CrossRef CAS PubMed.
- F. Chen, Q. Yang, X. Li, G. Zeng, D. Wang, C. Niu, J. Zhao, H. An, T. Xie and Y. Deng, Appl. Catal., B, 2017, 200, 330–342 CrossRef CAS.
- F. Chen, Q. Yang, S. Wang, F. Yao, J. Sun, Y. Wang, C. Zhang, X. Li, C. Niu, D. Wang and G. Zeng, Appl. Catal., B, 2017, 209, 493–505 CrossRef CAS.
- F. Chen, Q. Yang, J. Sun, F. Yao, S. Wang, Y. Wang, X. Wang, X. Li, C. Niu, D. Wang and G. Zeng, ACS Appl. Mater. Interfaces, 2016, 8, 32887–32900 CrossRef CAS PubMed.
- A. Fernandes, L. Labiadh, L. Ciríaco, M. J. Pacheco, A. Gadri, S. Ammar and A. Lopes, Chemosphere, 2017, 184, 1223 CrossRef CAS PubMed.
- X. Jing, Y. Long, D. Shen, H. Feng and T. Chen, J. Hazard. Mater., 2017, 323, 674–680 CrossRef PubMed.
- A. A. Babaei, B. Kakavandi, M. Rafiee, F. Kalantarhormizi, I. Purkaram, E. Ahmadi and S. Esmaeili, J. Ind. Eng. Chem., 2017, 56, 163–174 CrossRef CAS.
- D. Hermosilla, M. Cortijo and C. P. Huang, Sci. Total Environ., 2009, 407, 3473–3481 CrossRef CAS PubMed.
- G. P. Anipsitakis and D. D. Dionysiou, Environ. Sci. Technol., 2003, 37, 4790 CrossRef CAS PubMed.
- G. P. Anipsitakis and D. D. Dionysiou, Environ. Sci. Technol., 2004, 38, 3705 CrossRef CAS PubMed.
- F. Ghanbari and M. Moradi, Chem. Eng. J., 2017, 102, 307–315 Search PubMed.
- P. Hu and M. Long, Appl. Catal., B, 2016, 181, 103–117 CrossRef CAS.
- Y. B. Kim and J. H. Ahn, Korean J. Chem. Eng., 2017, 34, 1980–1984 CrossRef CAS.
- Q. Yang, Y. Zhong, H. Zhong, X. Li, W. Du, X. Li, R. Chen and G. Zeng, Process Saf. Environ. Prot., 2015, 98, 268–275 CrossRef CAS.
- Y. Nosaka, M. Nakamura and T. Hirakawa, Phys. Chem. Chem. Phys., 2002, 4, 1088–1092 RSC.
- X. H. Xia, J. L. Xu and Y. Yun, J. Environ. Sci., 2002, 14, 188–194 CAS.
- Z. Li, Q. Yang, Y. Zhong, X. Li, L. Zhou, X. Li and G. Zeng, RSC Adv., 2015, 6, 987–994 RSC.
- C. Costa, V. H. S. Santos, P. H. H. Araujo, C. Sayer, A. F. Santos and M. Fortuny, Eur. Polym. J., 2009, 45, 2011–2016 CrossRef CAS.
- S. Yang, P. Wang, X. Yang, G. Wei, W. Zhang and L. Shan, J. Environ. Sci., 2009, 21, 1175–1180 CrossRef CAS.
- N. N. Patil and S. R. Shukla, Journal of Water Process Engineering, 2015, 7, 314–327 CrossRef.
- C. Qi, X. Liu, C. Lin, X. Zhang, J. Ma, H. Tan and W. Ye, Chem. Eng. J., 2014, 249, 6–14 CrossRef CAS.
- C. Qi, X. Liu, W. Zhao, C. Lin, J. Ma, W. Shi, Q. Sun and H. Xiao, Environ. Sci. Pollut. Res. Int., 2015, 22, 4670–4679 CrossRef CAS PubMed.
- C. Qi, X. Liu, C. Lin, H. Zhang, X. Li and J. Ma, Chem. Eng. J., 2017, 315, 201–209 CrossRef CAS.
- Y. B. Kim and J. H. Ahn, J. Environ. Eng., 2016, 142, 04015084 CrossRef.
- W. Chen, A. Zhang, Z. Gu and Q. Li, Chem. Eng. J., 2018, 354, 680–691 CrossRef CAS.
- H. Hori, A. Yamamoto, E. Hayakawa, S. Taniyasu, A. Nobuyoshi Yamashita, S. Kutsuna, H. K. And and R. Arakawa, Environ. Sci. Technol., 2005, 39, 2383–2388 CrossRef CAS PubMed.
- X.-Y. Yu, Z.-C. Bao and J. R. Barker, ChemInform, 2004, 35, 295–308 Search PubMed.
- C. Qi, X. Liu, C. Lin, H. Zhang, X. Li and J. Ma, Chem. Eng. J., 2017, 315, 201–209 CrossRef CAS.
- G. V. Korshin, M. M. Benjamin and R. S. Sletten, Water Res., 1997, 31, 1643–1650 CrossRef CAS.
- F. Lü, H. Zhang, C. H. Chang, D. J. Lee, P. J. He, L. M. Shao and A. Su, Chemosphere, 2008, 72, 1381–1386 CrossRef PubMed.
- B. Lai, Y. Zhou, J. Wang, Z. Yang and Z. Chen, Chemosphere, 2013, 93, 2805–2813 CrossRef CAS PubMed.
- Y. P. Chin, G. Aiken and E. O'Loughlin, Environ. Sci. Technol., 1994, 28, 1853–1858 CrossRef CAS PubMed.
- A. Baker and M. Curry, Water Res., 2004, 38, 2605–2613 CrossRef CAS PubMed.
- L. Guo, M. Lu, Q. Li, J. Zhang, Y. Zong and Z. She, Bioresour. Technol., 2014, 171, 22–28 CrossRef CAS PubMed.
- J. A. Leenheer and J. P. Croué, Environ. Sci. Technol., 2003, 37, 18A–26A CrossRef CAS PubMed.
- W. Chen, P. Westerhoff, J. A. Leenheer and K. Booksh, Environ. Sci. Technol., 2015, 37, 5701–5710 CrossRef.
- C. A. Stedmon and S. Markager, Limnol. Oceanogr., 2005, 50, 686–697 CrossRef CAS.
- X. S. He, B. D. Xi, X. Li, H. W. Pan, D. An, S. G. Bai, D. Li and D. Y. Cui, Chemosphere, 2013, 93, 2208–2215 CrossRef CAS PubMed.
- X. S. He, B. D. Xi, R. T. Gao, H. Zhang, Q. L. Dang, D. Li and C. H. Huang, Chemosphere, 2016, 144, 75–80 CrossRef CAS PubMed.
- F. Lu, C. H. Chang, D. J. Lee, P. J. He, L. M. Shao and A. Su, Chemosphere, 2009, 74, 575–582 CrossRef CAS PubMed.
- X. Wang, F. Zhang, H. T. Kung, A. Ghulam, A. L. Trumbo, J. Yang, Y. Ren and Y. Jing, Catena, 2017, 155, 62–74 CrossRef CAS.
- Z. P. Liu, W. H. Wu, P. Shi, J. S. Guo and J. Cheng, J. Waste Manage., 2015, 41, 111–118 CrossRef CAS PubMed.
- H. Wang, Y. Wang, Z. Lou, N. Zhu and H. Yuan, J. Waste Manage., 2017, 69, 274–280 CrossRef CAS PubMed.
| This journal is © The Royal Society of Chemistry 2018 |

