 Open Access Article
Fabrication of cotton textile waste-based magnetic activated carbon using FeCl3 activation by the Box–Behnken design: optimization and characteristics
Zhihua Xu,
Tianqi Zhang,
Zhihang Yuan,
Daofang Zhang *,
Zhenhua Sun,
YuanXing Huang,
Weifang Chen*,
Danqi Tian,
Haixuan Deng and
Yuwei Zhou
School of Environment and Architecture, University of Shanghai for Science and Technology, 516 Jungong Rd., Shanghai 200093, PR China. E-mail: dfzhang_usst@163.com; chenweifang@tsinghua.org.cn
First published on 13th November 2018
Abstract
Cotton textile waste-based magnetic activated carbon was prepared via simultaneous activation-pyrolysis using FeCl3 as a novel activating agent. The response surface methodology based on the Box–Behnken design method was applied to optimize the preparation parameters and predict the specific surface area of the samples. The optimal activated carbon was obtained at a mass ratio of FeCl3/CTW, activation time and activation temperature of 1.62![[thin space (1/6-em)]](https://www.rsc.org/images/entities/char_2009.gif) :
:![[thin space (1/6-em)]](https://www.rsc.org/images/entities/char_2009.gif) 1, 1 h and 700 °C, respectively. The experimental maximum yield and iodine adsorptive value (32.66% and 714.55 mg g−1) of the resultant carbon were close to that of the predicated response values (34.85% and 783.75 mg g−1), respectively. SEM, N2 adsorption–desorption isotherms, XRD, PPMS, FTIR and pHpzc measurements were conducted to analyze the physicochemical characteristics of the optimal sample. The results showed that the carbon matrix had a high specific surface area of 837.39 m2 g−1 with abundant micropores and acidic surface functional groups, and the saturation magnetization (Ms) was 5.2 emu g−1 due to the formation of Fe3O4. The maximum adsorption of Cr(VI) by the carbon reached 212.77 mg g−1. Furthermore, the addition of FeCl3 lowered the pyrolytic carbonization temperature and inhibited the generation of volatiles in the activation-pyrolysis process. Meanwhile, the formation of Fe2O3 and Fe3O4 derived from FeCl3 was beneficial for the development of vast micropores.
1, 1 h and 700 °C, respectively. The experimental maximum yield and iodine adsorptive value (32.66% and 714.55 mg g−1) of the resultant carbon were close to that of the predicated response values (34.85% and 783.75 mg g−1), respectively. SEM, N2 adsorption–desorption isotherms, XRD, PPMS, FTIR and pHpzc measurements were conducted to analyze the physicochemical characteristics of the optimal sample. The results showed that the carbon matrix had a high specific surface area of 837.39 m2 g−1 with abundant micropores and acidic surface functional groups, and the saturation magnetization (Ms) was 5.2 emu g−1 due to the formation of Fe3O4. The maximum adsorption of Cr(VI) by the carbon reached 212.77 mg g−1. Furthermore, the addition of FeCl3 lowered the pyrolytic carbonization temperature and inhibited the generation of volatiles in the activation-pyrolysis process. Meanwhile, the formation of Fe2O3 and Fe3O4 derived from FeCl3 was beneficial for the development of vast micropores.
1. Introduction
In recent decades, textile waste has received widespread attention due to its large quantity discarded and inappropriate disposal. It was identified as a type of fast-growing sector in household waste and estimated to further grow with the increased sales of new textiles.1 As one of the major components of textile waste, it was predicted that the production of cotton textile waste was up to 5.62 million tons in China in 2013.2 Generally, cotton textile waste is disposed by direct processing or recycling, which mainly includes landfill disposal, incineration, composting and mechanical processing.3,4 However, although these methods for the disposal of cotton textile waste have achieved good results, most of them remain challenges for due to their low recycling rate, high technical requirements and persistent environmental pollution.5 Consequently, it is of great importance to explore alternative and environment-friendly methods to deal with cotton textile waste. It was reported that cotton textile waste can be utilized to manufacture mops through a mechanical method, and some researchers obtained glucose from cotton cellulose through complex separation and purification processes;6 however, the drawbacks of these methods of low recycling rate and high technical requirements limit their further development. Recently, some works have been reported concerning activated carbon materials manufactured with cotton textile waste as a precursor. Duan7 successfully prepared activated carbon fibers with a specific surface area of 1370 m2 g−1, which were derived from waste cotton by H3PO4 activation. Activated carbon fibers developed from medical waste cotton balls were synthesized by Chiu,8 and their specific surface area was up to 2060 m2 g−1. Boudrahem9 found that cotton cloth waste-based activated carbon made by chemical activation method had a high adsorption performance for clofibric acid, tetracycline and paracetamol.As a class of carbon materials, magnetic activated carbon (MAC) has been widely utilized in the water treatment field due to its advantages of high surface area, excellent adsorption performance and easy recovery compared to conventional carbons.10,11 In general, some raw materials such as coconut shells,12 acorn shells13 and carbon nanotubes14 are usually employed as precursors to prepare MAC due to their high carbon content (>40%).15 However, the large-scale production and application of activated carbons derived from the above-mentioned materials are hindered due to their non-renewability and relatively high cost. Thus, the search for substitute raw materials is increasing. Cotton textile waste has the characteristics of high carbon content (40–50%), alternative carbon source, abundance and low add value, which can be regarded as a potential precursor of MAC.16
The activated pyrolysis method should be fully considered in the preparation of MAC. Generally, MAC is prepared through a co-precipitation process to facilitate the embedding of iron oxides or their loading in the carbon matrix.17–19 However, this usually involves two steps, which might lead to complicated and costly procedures, secondary pollution and loss of adsorption capability. Nowadays, one-step activation-pyrolysis methods are desirable, which usually utilize different iron compounds such as FeCl3, FeCl2 and Fe(NO3)3 as the activating agent or magnetic additive agent to load iron species onto the activated carbon. In contrast, the MAC prepared by this way has several advantages, such as high specific surface area, stable magnetic properties, relatively high adsorption capacity, and simultaneous loading of iron oxides during the activation-pyrolysis stage.20 Compared with other iron salts, FeCl3 is commonly used as an activating agent to prepare MAC due to its low cost, low pollution and high efficiency of pore formation.21 However, there is still a dispute on the optimal preparation conditions for the production of MAC using FeCl3 as the activating agent. Oliveira22 found that coffee husk-based MAC with a surface area of 965 m2 g−1 was obtained at the activation temperature of 280 °C through FeCl3 activation, while the carbon sample had no pores as the activation temperature went up to 550 °C. Rufford23 prepared MAC derived from coffee grounds via a one-step FeCl3 activation-pyrolysis process, and an interesting finding was obtained, where with an increase in the activation temperature (300–900 °C), the BET surface area gradually increased. Meanwhile, the type of carbon precursor also plays a key role in the porosity development of MAC, and the differences in the physical properties and chemical compositions of raw materials obviously affect the optimum preparation conditions and performance of the resulting activated carbons.24,25 At present, the research on cotton textile waste-based MAC utilizing FeCl3 as the activating agent through a one-step activation-pyrolysis process remains rare. Additionally, few reports focus on the activation-pyrolysis pathway between carbon precursors and FeCl3, and the corresponding mechanism of porosity development has not been clarified.
Different parameters in the preparation process affect the characteristics and properties of carbon materials. In conventional experiments, full factorial design has been certified as an effective statistical approach to evaluate the effect of variables on the results.26 However, these methods are relatively time-consuming or unable to yield the true optimal value if the interactions between variables are ignored.27 Recently, the response surface methodology, such as the Box–Behnken Design (BBD), has been commonly selected to assist experimental design.28 Compared to other methods, the minimal amount of experimental data is demanded in the BBD, which exhibits excellent predictability within the design space and can analyze the interactions between different variables.29,30 Besides, the BBD is a rotatable or nearly rotatable design.31,32
In this study, FeCl3 was utilized as an activating agent to prepare cotton textile waste-based magnetic activated carbon via one-step pyrolysis activation. The response surface methodology based on the Box–Behnken design method was carried out to optimize the preparation process. The characteristics of the optimum activated carbon were determined to evaluate the activation effect of FeCl3, and the activation-pyrolysis mechanism was also proposed in detail.
2. Materials and methods
2.1 Materials
Cotton textile waste (CTW), used as the precursor of activated carbon, was mainly composed of warp and weft yarn mixtures, which was purchased from WUXI No. 1 Cotton Mill (Jiangsu, P. R. China). All chemicals (FeCl3·6H2O, HCl, HNO3, H2SO4, H3PO4 and K2Cr2O7) were of analytical reagent grade and obtained from Sinopharm Chemical Reagent Co. (Shanghai, P. R. China). The deionized water used was produced by an Ultra-pure water system (Milli-Q Advantage A10, USA). The purity of N2 was higher than 99.9%.2.2 Preparation
5 g of CTW (cut into lengths of 0.5 cm) was fully immersed in 25 mL FeCl3 solution in different mass ratios (FeCl3![[thin space (1/6-em)]](https://www.rsc.org/images/entities/char_2009.gif) :
:![[thin space (1/6-em)]](https://www.rsc.org/images/entities/char_2009.gif) CTW = 1
CTW = 1![[thin space (1/6-em)]](https://www.rsc.org/images/entities/char_2009.gif) :
:![[thin space (1/6-em)]](https://www.rsc.org/images/entities/char_2009.gif) 1–3
1–3![[thin space (1/6-em)]](https://www.rsc.org/images/entities/char_2009.gif) :
:![[thin space (1/6-em)]](https://www.rsc.org/images/entities/char_2009.gif) 1) at room temperature for 24 h, and then the mixture was put into a drying oven at 60 °C overnight. Afterwards, the mixture loaded in a quartz boat was heated in a tubular oven at different activation temperatures (400–700 °C) and times (1–3 h) under an N2 atmosphere (100 mL min−1). The rate of the programmed temperature was set at 10 °C min−1. Subsequently, the products were soaked in boiling HCl solution (1 + 9) for 15 min, and then the resultant carbons were repeatedly washed with deionized water until a neutral pH filtrate was obtained. Finally, the resultant carbons were dried in a desiccation oven at 105 °C for 24 h.
1) at room temperature for 24 h, and then the mixture was put into a drying oven at 60 °C overnight. Afterwards, the mixture loaded in a quartz boat was heated in a tubular oven at different activation temperatures (400–700 °C) and times (1–3 h) under an N2 atmosphere (100 mL min−1). The rate of the programmed temperature was set at 10 °C min−1. Subsequently, the products were soaked in boiling HCl solution (1 + 9) for 15 min, and then the resultant carbons were repeatedly washed with deionized water until a neutral pH filtrate was obtained. Finally, the resultant carbons were dried in a desiccation oven at 105 °C for 24 h.
The optimum activated carbon obtained by the Box–Behnken design method (mass ratio of 1.62![[thin space (1/6-em)]](https://www.rsc.org/images/entities/char_2009.gif) :
:![[thin space (1/6-em)]](https://www.rsc.org/images/entities/char_2009.gif) 1, activation time of 1 h and activation temperature of 700 °C) was designated as OAC. The blank samples prepared at the above-mentioned activation temperature and time without any activating agent and commercial activated carbon were denoted as WAC and CAC, respectively.
1, activation time of 1 h and activation temperature of 700 °C) was designated as OAC. The blank samples prepared at the above-mentioned activation temperature and time without any activating agent and commercial activated carbon were denoted as WAC and CAC, respectively.
2.3 Characterization
The yield of activated carbon was calculated using eqn (1), as follows:
 | (1) |
The iodine adsorption was measured according to the method in the Chinese National Standards (GB/T 12496.8-2015).33 Scanning electron microscopy (HITACHI, S4800, Japan) was used to analyze the surface morphology of the activated carbon. The N2 adsorption–desorption isotherms were obtained on an automatic adsorption instrument (Quantachrome, autosorb-iQ-2MP, USA) at 77 K. The specific surface area (SBET) was calculated using the Brunauer–Emmett–Teller (BET) equation. The microporous surface area (Smic) and microporous volume (Vmic) were assessed using the t-plot method. The average pore diameter (Dp) was estimated from the BET method (4V/A by BET). Also, the DFT (density functional theory) method was used for calculation of the pore size distribution. X-ray diffraction (Bruker, D8 ADVANCE, Germany) patterns were measured with a scintillation counter using Cu Kα radiation and recorded in the 2θ of 5° to 80° at a scanning rate of 3° min−1. The hysteresis loop was analyzed using a physical property measurement system (Quantum Design, PPMS-9T (EC-II), USA) at 300 K. The surface functional groups of the samples were detected via Fourier transform infrared spectroscopy (Thermo Scientific, Nicolet iS10, USA) in the wavenumber range of 4000 to 400 cm−1. The pHpzc measurement was carried out by adding 1 g of sample to 20 mL deionized water and shaking on a shaker for 24 h.34 The obtained pH of the slurry equalled the pHpzc. The measurement of weight loss for the mixture was conducted on a thermogravimetric (TG) analyzer (PerkinElmer, STA 8000, USA) under an N2 atmosphere from room temperature to 800 °C at a heating rate of 10 °C min−1.
2.4 Box–Behnken design method
The Box–Behnken design is a spherical, revolving response surface methodology (RSM) design, which consists of a central point and the middle points of the edges of the cube circumscribed on the sphere.35 It is a three-level fractional factorial design consisting of a full 22 factorial seeded into a balanced incomplete block design. It consists of three interlocking 22 factorial designs having points, all lying on the surface of a sphere surrounding the center of the design.36 Since, the Box–Behnken does not have corners and dissociate parametric extremes, it can reduce the risk of update failures.The response results of the Box–Behnken design (BBD) were analyzed using the Design-Export 9.0 software. As shown in Table 1, the parameters mainly including mass ratio (1![[thin space (1/6-em)]](https://www.rsc.org/images/entities/char_2009.gif) :
:![[thin space (1/6-em)]](https://www.rsc.org/images/entities/char_2009.gif) 1–3
1–3![[thin space (1/6-em)]](https://www.rsc.org/images/entities/char_2009.gif) :
:![[thin space (1/6-em)]](https://www.rsc.org/images/entities/char_2009.gif) 1), activation time (1–3 h) and activation temperature (400–700 °C) were designed with X1, X2 and X3, respectively. Meanwhile, the ranges of the parameters were coded as −1, 0 and 1 according to eqn (2).
1), activation time (1–3 h) and activation temperature (400–700 °C) were designed with X1, X2 and X3, respectively. Meanwhile, the ranges of the parameters were coded as −1, 0 and 1 according to eqn (2).
 | (2) |
| Parameters | Factors | Levels | ||
|---|---|---|---|---|
| −1 | 0 | 1 | ||
| Mass ratio | X1 | 1![[thin space (1/6-em)]](https://www.rsc.org/images/entities/char_2009.gif) : :![[thin space (1/6-em)]](https://www.rsc.org/images/entities/char_2009.gif) 1 1 |
2![[thin space (1/6-em)]](https://www.rsc.org/images/entities/char_2009.gif) : :![[thin space (1/6-em)]](https://www.rsc.org/images/entities/char_2009.gif) 1 1 |
3![[thin space (1/6-em)]](https://www.rsc.org/images/entities/char_2009.gif) : :![[thin space (1/6-em)]](https://www.rsc.org/images/entities/char_2009.gif) 1 1 |
| Activation time (h) | X2 | 1 | 2 | 3 |
| Activation temperature (°C) | X3 | 400 | 550 | 700 |
The predicted response values and analysis of variance data were obtained by the second-order polynomial model in eqn (3) as follows:
 | (3) |
2.5 Adsorption experiments
To conduct Cr(VI) adsorption tests, a stock solution containing a Cr(VI) concentration of 1200 mg L−1 was prepared by dissolving 3.3936 g of K2Cr2O7 in 1000 mL of deionized water and acidifying to a pH below 2.0 with HCl. The solution was kept at 4 °C for further dilution to the desired concentrations. Then 0.1 g of OAC, WAC and CAC were added to 18 centrifuge tubes containing 50 mL Cr(VI) solution of different concentrations ranging from 100 to 1200 mg L−1. The mixtures were placed on a rotary shaker at 25 °C and shaken at 150 rpm for 24 h. The concentration of Cr(VI) was determined using the Chinese National Standards (GB/T 7467-1987)37 and a visible spectrophotometer (Shanghai Precision Science Instrument Co., Ltd, 723N, China). The adsorptive capacity of Cr(VI) was calculated using eqn (4) as follows:
 | (4) |
The Langmuir isotherm and Freundlich isotherms were expressed as eqn. (5) and (6):
Langmuir model:
 | (5) |
Freundlich model:
 | (6) |
3. Results and discussion
3.1 Optimization
As presented in Table 2, a group of 17 experiments based on BBD were carried out to determine the effect of key parameters on the yield (Y1) and the iodine adsorption value (Y2). The actual and predicted response values for assessing the significance of the regression coefficient of the proposed models are listed in Table 2. Based on the experimental data, the final equations in terms of coded factors were obtained as eqn (7) and (8):| Y1 = 35.57 − 1.88X1 + 0.049X2 − 2.91X3 − 0.33X1X2 − 1.14X1X3 − 0.18X2X3 − 0.36X12 + 1.84X22 − 0.39X32 | (7) |
| Y2 = 401.10 + 27.41X2 + 201.25X3 + 11.19X1X2 + 124.25X1X3 − 60.96X2X3 − 30.94X12 − 41.94X22 + 204.57X32 | (8) |
| Numbers | Variable | Response | |||||
|---|---|---|---|---|---|---|---|
| X1 | X2 (h) | X3 (°C) | Y1 (%) | Y2 (mg g−1) | |||
| Actual | Predicted | Actual | Predicted | ||||
| 1 | 1 | 0 | −1 | 38.15 | 38.55 | 339.74 | 311.96 |
| 2 | 0 | 1 | −1 | 35.98 | 35.44 | 304.34 | 344.4 |
| 3 | −1 | −1 | 0 | 38.76 | 39.3 | 329.72 | 289.67 |
| 4 | −1 | 1 | 0 | 35.28 | 34.88 | 339.09 | 366.87 |
| 5 | 0 | −1 | 1 | 39.76 | 38.47 | 432.36 | 470.32 |
| 6 | 0 | 0 | 0 | 37.34 | 36.98 | 306.52 | 276.65 |
| 7 | 0 | −1 | −1 | 34.58 | 34.94 | 594.46 | 624.33 |
| 8 | 1 | −1 | 0 | 27.60 | 28.89 | 965.6 | 927.64 |
| 9 | −1 | 0 | 1 | 38.80 | 39.7 | 311.66 | 301.48 |
| 10 | 0 | 1 | 1 | 39.40 | 40.15 | 421.39 | 423.48 |
| 11 | 1 | 0 | 1 | 35.00 | 34.25 | 827.99 | 825.9 |
| 12 | 0 | 0 | 0 | 34.88 | 33.98 | 693.88 | 704.06 |
| 13 | 0 | 0 | 0 | 36.00 | 35.57 | 357.38 | 401.1 |
| 14 | 0 | 0 | 0 | 34.90 | 35.57 | 439.67 | 401.1 |
| 15 | −1 | 0 | −1 | 35.90 | 35.57 | 399.4 | 401.1 |
| 16 | 1 | 1 | 0 | 35.72 | 35.57 | 402.28 | 401.1 |
| 17 | 0 | 0 | 0 | 35.34 | 35.57 | 406.76 | 401.1 |
As listed in Table 3, the results of variance analysis are an important tool to test the significance of the model.38 In general, values of “P” less than 0.05 demonstrate that the model terms were significant in the surface response analysis.39 Certainly, the smaller the P-value, the more significant the model or factors.26 Regarding yield, the model P-value of 0.0021 meant that only a 0.21% chance that a “Model F-Value” (11.24) this large could occur due to noise, which implied the model of the yield (Y1) was significant. Similarly, the Model F-value of 35.08 and P-value < 0.0001 implied the model of the iodine adsorption value (Y2) was significant.
| Source | Y1 (%) | Y2 (mg g−1) | ||
|---|---|---|---|---|
| F-value | P-value | F-value | P-value | |
| Model | 11.24 | 0.0021 | 35.08 | <0.0001 |
| X1 | 24.58 | 0.0016 | 3.22 | 0.1159 |
| X2 | 0.017 | 0.9014 | 8.20 × 10⁻⁶ | 0.9978 |
| X3 | 58.62 | 0.0001 | 173.53 | <0.0001 |
| X1X2 | 0.37 | 0.5609 | 0.27 | 0.6204 |
| X1X3 | 4.51 | 0.0712 | 33.07 | 0.0007 |
| X2X3 | 0.11 | 0.7471 | 7.96 | 0.0257 |
| X12 | 0.49 | 0.508 | 2.16 | 0.1853 |
| X22 | 12.31 | 0.0099 | 3.97 | 0.0867 |
| X32 | 0.55 | 0.4831 | 94.37 | <0.0001 |
| Radj2 | 0.9504 | 0.8520 | ||
| Rpred2 | 0.7352 | 0.0592 | ||
For their individual and cumulative interaction factors, the P-value of X1, X3, and X22 in Y1 model along with X3, X1X3, X2X3, and X32 in Y2 model all met the conditions of <0.05. In this case, X1, X3, and X22 were significant model terms for Y1, and X3, X1X3, X2X3, and X32 were significant model terms for Y2. However, the predicted determination coefficient (Rpred2) of 0.7352 was not as close to the adjusted determination coefficient (Radj2) of 0.9504 as normally expected, indicating a large block effect or possible problem with the yield model. This also occurred in the iodine adsorption value model for its Rpred2 (0.0592) and Radj2 (0.8520). Therefore, to eliminate the insignificant terms from the second-order polynomial model, model reduction was conducted for both the yield and iodine adsorption values. The final equation in terms of coded factors were obtained as follows as eqn (9) and (10):
| Y1 = 35.24 − 1.88X1 − 2.91X3 + 1.79X22 | (9) |
| Y2 = 368.71 + 201.25X3 + 124.25X1X3 − 60.96X2X3 + 204.52X32 | (10) |
The analysis of variance table after simplification is presented as Table 4. The P-values in the yield and the iodine adsorption value models satisfied the condition of value <0.0001, indicating that they were both significant. For Y1, the Rpred2 of 0.7389 was in reasonable agreement with the Radj2 of 0.8508 due to the relative differences (<0.2), which was consistent with the results of Y2. In addition, the Radj2 for Y1 and Y2 were 0.8508 and 0.9300, respectively. It was manifested that the models represented observed variability of approximately 85% and 93% for the yield and iodine adsorptive value, respectively, indicating that the model terms became more significant after simplification.
| Source | Y1 (%) | Y2 (mg g−1) | ||
|---|---|---|---|---|
| F-value | P-value | F-value | P-value | |
| Model | 31.42 | <0.0001 | 54.16 | <0.0001 |
| X1 | 24.38 | 0.0003 | — | — |
| X3 | 58.14 | <0.0001 | 122.94 | <0.0001 |
| X1X3 | — | — | 23.43 | 0.0004 |
| X2X3 | — | — | 5.64 | 0.0351 |
| X22 | 11.73 | 0.0045 | — | — |
| X32 | — | — | 64.62 | <0.0001 |
| Radj2 | 0.8508 | 0.9300 | ||
| Rpred2 | 0.7389 | 0.8629 | ||
Fig. 1(a and b) display the 3D surface response and the contour for the desirability function of the simultaneous optimization of the yield and iodine adsorption value. Both of them were plotted according to the models for the yield and iodine adsorptive value in order to reflect the interactions of different variables as well as determine the optimal sample preparation conditions.
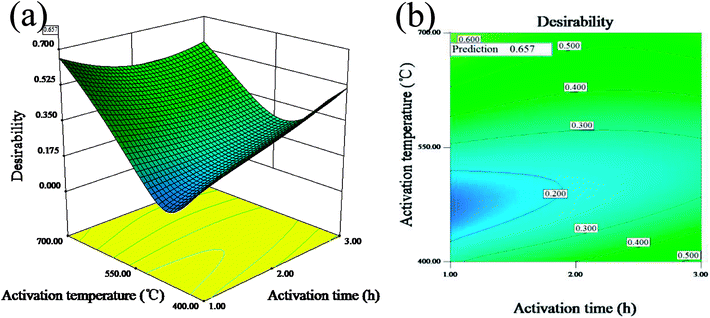 | ||
| Fig. 1 3D surface response (a) and the contour (b) for the desirability function for the simultaneous optimization of the yield and iodine adsorption value. | ||
The maximum value of desirability function (0.657) was obtained at the mass ratio of 1.62![[thin space (1/6-em)]](https://www.rsc.org/images/entities/char_2009.gif) :
:![[thin space (1/6-em)]](https://www.rsc.org/images/entities/char_2009.gif) 1, activation time of 1 h and activation temperature of 700 °C. The predicted maximum value of yield and iodine adsorptive from BBD were 34.85% and 783.75 mg g−1, respectively, which were close to 32.66% for the yield and 714.55 mg g−1 for the iodine adsorptive value obtained from the verification experiment. The results showed that the relative errors of the predicated response values were 6.20% and 8.83%, respectively, indicating the high reliability of the simplified model for predicting the optimal value.
1, activation time of 1 h and activation temperature of 700 °C. The predicted maximum value of yield and iodine adsorptive from BBD were 34.85% and 783.75 mg g−1, respectively, which were close to 32.66% for the yield and 714.55 mg g−1 for the iodine adsorptive value obtained from the verification experiment. The results showed that the relative errors of the predicated response values were 6.20% and 8.83%, respectively, indicating the high reliability of the simplified model for predicting the optimal value.
3.2 Characteristics
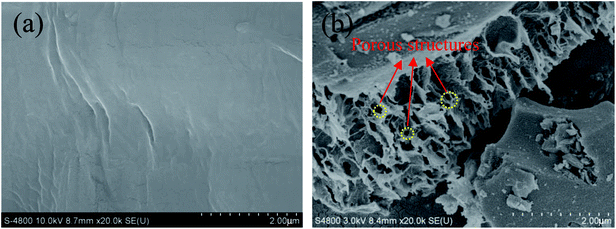
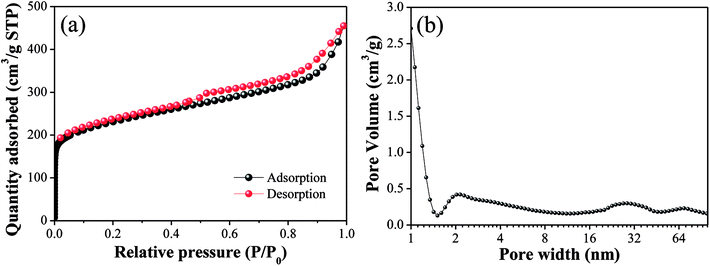
The N2 adsorption/desorption isotherms and pore size distributions of OAC are exhibited in Fig. 3. In Fig. 3(a), the isotherm of OAC exhibited a sharp increase at low pressure (∼0.1 P/P0), which is characteristic of a microporous structure.42 A hysteresis loop of type H4 was found at the high relative pressure (>0.4 P/P0), which is attributed to the existence of slit-shaped mesopores.43 Besides, the isotherm also characterised with a type IV shape in the medium pressure (0.3–0.8 P/P0) and a sharp increase in adsorption at a high relative pressure (∼0.9 P/P0), which further imply the occurrence of capillary condensation in the mesopores and existence of wider pores.44 From Fig. 3(b), it was obvious that the size of the micropores was mainly concentrated in the range of 1–2 nm, and that of the meso- and macropores ∼30 nm and ∼90 nm, respectively.
The specific surface area and pore volume parameters of OAC are listed in Table 5. The results indicated that a specific surface area of 837.39 m2 g−1 was achieved. The proportion of micropores was the largest (>50%), indicating that the addition of FeCl3 promoted the formation of micropores owing to the small molecular sizes of the different types of iron species existing in the activated carbon after activation.42 These interesting findings are consistent with that reported by some other researchers. Su45 showed the evolution of micropores on coir pith-based activated carbon with different activation temperatures and times and found that iron compounds had a significant impact on the development of micropores through one-step pyrolysis. Ahmed25 inferred that FeCl3 facilitated the activation of date stones and obtained microporous activated carbon with pores diameters centered at ∼1 nm, which were smaller than that obtained through ZnCl2 activation. Some researchers proved that the reactions between amorphous carbon and iron oxide (Fe2O3 and Fe3O4) formed from FeCl3 increase the pore volume and create new pores at high temperature (>600 °C).21,23 In Table 5, the pore volume (Vtot) of OAC was 0.69 cm3 g−1, which is larger than that of the cotton textile waste-based activated carbon (0.62 cm3 g−1) prepared via H3PO4 activation at 600 °C by Boudrahem,9 demonstrating that FeCl3 showed a comparable pore-forming effect on cotton textile waste as H3PO4. In addition, the average pore size (Dp) of OAC was 2.89 nm. It was worth mentioning that the specific surface area of OAC was higher than that of the related materials prepared by other researchers, as listed in Table 6.
| Sample | SBET (m2 g−1) | Smic (m2 g−1) | Smic/SBET (%) | Vtot (cm3 g−1) | Dp (nm) |
|---|---|---|---|---|---|
| OAC | 837.39 | 423.55 | 50.58 | 0.69 | 2.89 |
| Precursor | Activating agent | Mass ratio | Activation time (h) | Activation temperature (°C) | Surface area (m2 g−1) | Reference |
|---|---|---|---|---|---|---|
| Cotton textile waste | FeCl3 | 1.62![[thin space (1/6-em)]](https://www.rsc.org/images/entities/char_2009.gif) : :![[thin space (1/6-em)]](https://www.rsc.org/images/entities/char_2009.gif) 1 1 |
1 | 700 | 837.39 | This study |
| Carbonized coconut shells | FeCl3 | 2![[thin space (1/6-em)]](https://www.rsc.org/images/entities/char_2009.gif) : :![[thin space (1/6-em)]](https://www.rsc.org/images/entities/char_2009.gif) 1 1 |
1.5 | 700 | 337 | 12 |
| Date pits | FeCl3 | 1.5![[thin space (1/6-em)]](https://www.rsc.org/images/entities/char_2009.gif) : :![[thin space (1/6-em)]](https://www.rsc.org/images/entities/char_2009.gif) 1 1 |
1 | 700 | 780.06 | 46 |
| Textile cotton waste | ZnCl2 | — | 1 | 700 | 292 | 47 |
| Cotton woven waste | H3PO4 | — | 0.5 | 800 | 789 | 48 |
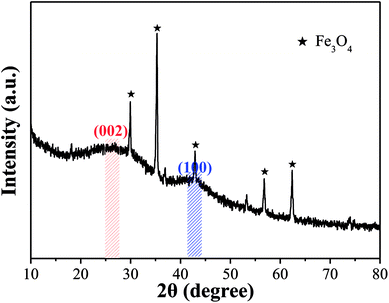
![[thin space (1/6-em)]](https://www.rsc.org/images/entities/char_2009.gif) θ) was 0.350, which is larger than that of graphite (d002 = 0.340), indicating that OAC had more randomly oriented graphitic carbon layers.8,49 In addition, the sharp peaks at 2θ = 29.93°, 35.29°, 42.93°, 56.81° and 62.39° correspond to the (220), (311), (400), (511) and (440) plane interlayer reflections of Fe3O4, respectively, which meant that Fe3O4 particles were successfully injected into the carbon matrix during the activation-pyrolysis process.50
θ) was 0.350, which is larger than that of graphite (d002 = 0.340), indicating that OAC had more randomly oriented graphitic carbon layers.8,49 In addition, the sharp peaks at 2θ = 29.93°, 35.29°, 42.93°, 56.81° and 62.39° correspond to the (220), (311), (400), (511) and (440) plane interlayer reflections of Fe3O4, respectively, which meant that Fe3O4 particles were successfully injected into the carbon matrix during the activation-pyrolysis process.50
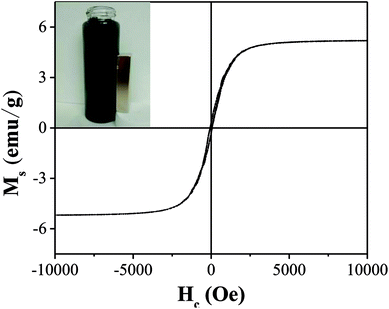
As illustrated in Fig. 5, the saturation magnetization (Ms) of OAC was higher than that of some related materials reported by others, which reached 5.2 emu g−1 and is beneficial for solid–liquid separation. Mohan10 found that the saturation magnetization of magnetic activated carbon derived from almond shells was 4.47 emu g−1 at 300 K. Moreover, as reported by Zhu,51 magnetic porous carbon exhibited a low saturation magnetization (0.76 emu g−1) at 300 K. As listed in Table 7, the remanence (Mr) and coercive force (Hc) values were 0.30 emu g−1 and 63.84 Oe, respectively, manifesting that OAC possessed super paramagnetic properties at 300 K as the value of Mr/Ms (0.06) was low.52
| Ms (emu g−1) | Mr (emu g−1) | Hc (Oe) | Mr/Ms |
|---|---|---|---|
| 5.20 | 0.30 | 63.84 | 0.06 |
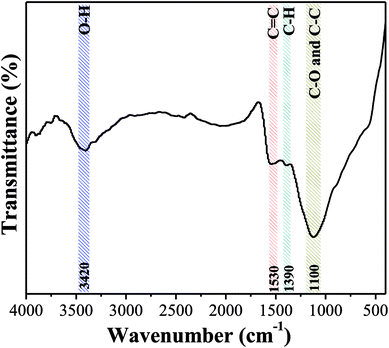
![[double bond, length as m-dash]](https://www.rsc.org/images/entities/char_e001.gif) C vibration in the aromatic ring and band at 1390 cm−1 is due to the C–H bond stretching vibration in aliphatic compounds. The results clearly demonstrated that the aromatization reaction probably occurred between functional groups on the surface of OAC due to the activation effect of FeCl3.54 Besides, the pHpzc of OAC was determined to be 2.75 ± 0.25, which is consistent with the FTIR results and further proved that OAC had acidic characteristics. The abundant hydrophilic acid functional groups on the surface of the carbon sample can provide more active sites, which is beneficial for the adsorption of heavy metal pollutants.55
C vibration in the aromatic ring and band at 1390 cm−1 is due to the C–H bond stretching vibration in aliphatic compounds. The results clearly demonstrated that the aromatization reaction probably occurred between functional groups on the surface of OAC due to the activation effect of FeCl3.54 Besides, the pHpzc of OAC was determined to be 2.75 ± 0.25, which is consistent with the FTIR results and further proved that OAC had acidic characteristics. The abundant hydrophilic acid functional groups on the surface of the carbon sample can provide more active sites, which is beneficial for the adsorption of heavy metal pollutants.55
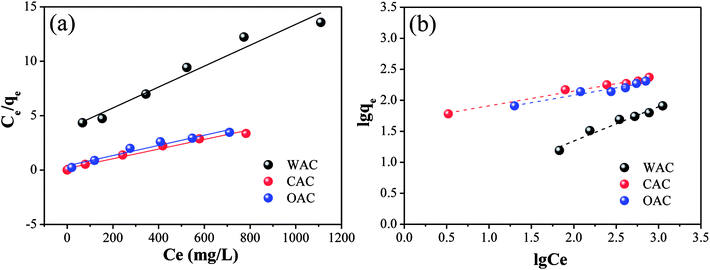 | ||
| Fig. 7 Linear fitting plots of Cr(VI) adsorption by OAC, WAC and CAC for the Langmuir isotherms (a) and Freundlich isotherms (b). | ||
| Adsorbent | T (K) | Langmuir model | Freundlich model | ||||
|---|---|---|---|---|---|---|---|
| qm (mg g−1) | KL (L mg−1) | R2 | KF (mg g−1) | n | R2 | ||
| OAC | 298 | 212.77 | 0.0118 | 0.96 | 40.6069 | 4.2265 | 0.95 |
| WAC | 298 | 104.17 | 0.0025 | 0.97 | 1.7061 | 1.7973 | 0.97 |
| CAC | 298 | 232.56 | 0.0196 | 0.98 | 47.2825 | 4.2230 | 0.98 |
The information of adsorption intensity and heterogeneity could be obtained from the value of 1/n and n.58 The 1/n of all the samples was less than 1, which decreased in the following order: CAC (0.2368) > OAC (0.2366) > WAC (0.5564), indicating a physisorption process and a degree of heterogeneity on the surface of the samples.12 Moreover, the values of n were in the range of 2–10 and 1/n became closer to zero, which indicated good adsorption as well as a more heterogeneous surface with CAC and OAC.59,60 Generally, KL>0 indicates that the adsorption process can occur spontaneously.61 As listed in Table 8, the Cr(VI) adsorption process could be triggered spontaneously for all the carbon materials. OAC and CAC showed more excellent adsorption performances than WAC for Cr(VI), and a lower dissociation coefficient and higher binding energy. The results showed that the qm of OAC (212.77 mg g−1) was close to that of CAC (232.56 mg g−1) and doubled after the addition of FeCl3 compared with that of WAC (104.17 mg g−1). Specifically, OAC can be recycled due to its magnetic properties and its cost is expected to be less than that of CAC.
3.3 Activation-pyrolysis mechanism
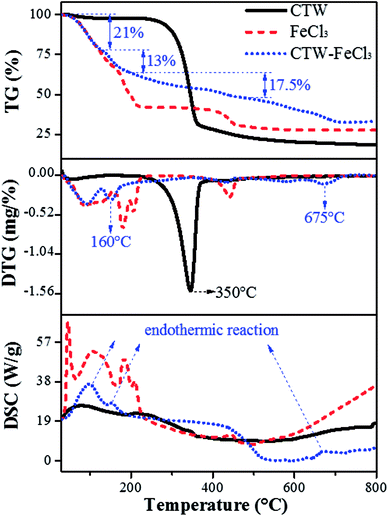
Fig. 8 shows the whole process of TG-DTG-DSC for CTW, FeCl3 and CTW–FeCl3 in the range of 0–800 °C. The weight loss process of CTW consisted of three stages. In the initial stage (∼100 °C) of the pyrolysis process, a minor weight loss (∼3%) occurred along with the endothermic reaction derived from the removal of moisture in CTW. Decomposition of cellulose accompanied by volatile substance release mainly proceeded in the range of 250–400 °C. Then, the maximum weight loss (∼68%) of CTW arose at 350 °C, which is consistent with the results of Shimada.62 Further weight loss emerged after 400 °C, the exothermic process reflected the formation of solid phase carbide.63For FeCl3·6H2O, except for the evaporation of crystallization water from 0 °C to 155 °C, there were two major weight loss steps (∼17% and ∼9.5%) occurring at 155–230 °C and a weight loss (∼11%) located in the range of 400–460 °C for the FeCl3. According to the DSC spectrum of FeCl3, the process in the range of 155–460 °C involved an endothermic reaction. Thus, it was speculated that the decomposition, dehydrochlorination and generation of iron compounds occurred in this stage. At a lower temperature (155–230 °C), FeCl3·6H2O was hydrolyzed to amorphous iron species such as FeOCl·H2O and FeOOH, and then FeOOH was further converted to Fe2O3 at 400–460 °C. This reaction can be written as follows (eqn (11) and (12)):23
| FeCl3·6H2O → FeOCl·H2O → FeOOH (155–230 °C) | (11) |
| FeOOH → Fe2O3 (400–460 °C) | (12) |
For CTW–FeCl3, the evaporation of crystallization water in the activating agent and water in the precursor occurred in the range of 0–130 °C. From 130 °C to 200 °C, an obvious weight loss (∼13%) in CTW–FeCl3 occurred accompanied by an endothermic reaction occurred at around 160 °C, which was lower than the weight loss temperature of CTW (350 °C) due to carbonization reaction of the sample. Rufford23 reported that the maximum weight loss point of waste coffee grounds impregnated with FeCl3 moved towards to a lower temperature compared to the sample prepared from precursors without activator. Thus, it was speculated that the addition of FeCl3 might be able to lower the pyrolytic carbonization temperature of CTW.
The stage of 200–500 °C was mainly accompanied by an exothermic process. A stable weight loss (∼17.5%) was observed in this stage, which was similar to the TG-DTG results for FeCl3 and associated with the activation-pyrolysis of CTW as well as the transformation of iron species. In this stage, FeCl3 was involved in the activation-pyrolysis process and participated in the transformation of iron species, simultaneously. There was an apparent weight loss along with endothermic reaction from 500 °C to 720 °C for CTW–FeCl3, which may be derived from the catalytic gasification of Fe2O3 loaded on the sample surface or trapped in the sample.45 The Fe2O3 could act as catalyst to gasify adjacent carbon material into methane, then, pores widened and new micropores were created.64,65 In the reactions above, the formation process of Fe3O4 and Fe can be described by eqn (13–15):
| 3Fe2O3 + C → 2Fe3O4 + CO | (13) |
| 2Fe2O3 + 3C → 4Fe + 3CO2 | (14) |
| Fe3O4 + 4C → 3Fe + 4CO | (15) |
At around 800 °C, the weight of CTW, FeCl3 and CTW–FeCl3 tended to be stable. The residual weight around this temperature followed the regularity of CTW < CTW–FeCl3, indicating that the production of volatiles was inhibited and the yield of sample increased under the impact of FeCl3, which was consistent with the results of Zazo.41
4. Conclusion
The response surface methodology based on the Box–Behnken design method optimized the preparation parameters effectively and the optimum preparation conditions were as follows: the mass ratio of FeCl3/CTW of 1.62![[thin space (1/6-em)]](https://www.rsc.org/images/entities/char_2009.gif) :
:![[thin space (1/6-em)]](https://www.rsc.org/images/entities/char_2009.gif) 1, activation time of 1 h and activation temperature of 700 °C. The results of the physicochemical characterization showed that OAC exhibited a structure composed of micropores (50.58%) and its specific surface area could reach 837.39 m2 g−1. Simultaneously, Fe3O4 was successfully loaded on the OAC surface and the saturation magnetization (Ms) of OAC was 5.2 emu g−1, which is sufficient for solid–liquid separation. Additionally, abundant hydrophilic acid functional groups were found on the surface of OAC and this sample achieved good adsorption performance toward Cr(VI) (qm = 212.77 mg g−1). Besides, the results from TG-DTG-DSC revealed that FeCl3 could change the pyrolysis process of cotton textile waste, lower the pyrolytic carbonization temperature and inhibit the production of volatiles. Meanwhile, Fe2O3 and Fe3O4 derived from FeCl3 could promote the formation of pores on the surface of the produced activated carbon.
1, activation time of 1 h and activation temperature of 700 °C. The results of the physicochemical characterization showed that OAC exhibited a structure composed of micropores (50.58%) and its specific surface area could reach 837.39 m2 g−1. Simultaneously, Fe3O4 was successfully loaded on the OAC surface and the saturation magnetization (Ms) of OAC was 5.2 emu g−1, which is sufficient for solid–liquid separation. Additionally, abundant hydrophilic acid functional groups were found on the surface of OAC and this sample achieved good adsorption performance toward Cr(VI) (qm = 212.77 mg g−1). Besides, the results from TG-DTG-DSC revealed that FeCl3 could change the pyrolysis process of cotton textile waste, lower the pyrolytic carbonization temperature and inhibit the production of volatiles. Meanwhile, Fe2O3 and Fe3O4 derived from FeCl3 could promote the formation of pores on the surface of the produced activated carbon.
Conflicts of interest
There are no conflicts to declare.Acknowledgements
This work was financially supported by National Natural Science Foundation of China (21707090), China Postdoctoral Science Foundation (2017M611590) and Shanghai Natural Science Foundation (14ZR1428900).References
- M. A. Nahil and P. T. Williams, J. Anal. Appl. Pyrolysis, 2010, 89, 51–59 CrossRef CAS.
- National and Reform Commission, Recyclable Resources and Circular Economy, 2014, vol. 7, pp. 2–6 Search PubMed.
- B. Zamani, Carbon footprint and energy use of textile recycling techniques, Chalmers University of Technology, 2011 Search PubMed.
- Y. J. Wang, Waste Biomass Valorization, 2010, 1, 135–143 CrossRef.
- S. H. Wang, M. X. Wei, Q. L. Xu and H. S. Jia, Fibers Polym., 2016, 17, 212–219 CrossRef CAS.
- F. Yang, Y. Li, Q. Zhang, X. F. Sun, H. X. Fan, N. Xu and G. Li, Carbohydr. Polym., 2015, 131, 9–14 CrossRef CAS PubMed.
- X. H. Duan, C. Srinivasakannan, X. Wang, F. Wang and X. Y. Liu, J. Taiwan Inst. Chem. Eng., 2017, 70, 374–381 CrossRef CAS.
- K. Chiu and D. H. L. Ng, Biomass Bioenergy, 2012, 46, 102–110 CrossRef CAS.
- N. Boudrahem, S. Delpeux-Ouldriane, L. Khenniche, F. Boudrahem, F. Aissani-Benissad and M. Gineys, Process Saf. Environ. Prot., 2017, 111, 544–559 CrossRef CAS.
- D. Mohan, A. Sarswat, V. K. Singh, M. Alexandre-Franco and C. U. Pittman, Chem. Eng. J., 2011, 172, 1111–1125 CrossRef CAS.
- N. Yang, S. M. Zhu, D. Zhang and S. Xu, Mater. Lett., 2008, 62, 645–647 CrossRef CAS.
- A. L. Cazetta, O. Pezoti, K. C. Bedin, T. L. Silva, A. Paesano Junior, T. Asefa and V. C. Almeida, ACS Sustainable Chem. Eng., 2016, 4, 1058–1068 CrossRef CAS.
- E. Altıntıg, H. Altundag, M. Tuzen and A. Sarı, Chem. Eng. Res. Des., 2017, 122, 151–163 CrossRef.
- Ş. S. Bayazit and Ö. Kerkez, Chem. Eng. Res. Des., 2014, 92, 2725–2733 CrossRef.
- Q. L. Xu, Study on preparation and adsorption kinetics for dye waste water of porous carbon matericals from waste cotton fabrics, Taiyuan University Of Technology, 2012 Search PubMed.
- Q. R. Zhu, Study on the effect and mechanism of catalyst catalyzed and carbonized waste cotton fabrics, Taiyuan University of Technology, 2012 Search PubMed.
- S. Nethaji, A. Sivasamy and A. B. Mandal, Bioresour. Technol., 2013, 134, 94–100 CrossRef CAS PubMed.
- B. Kakavandi, A. Takdastan, N. Jaafarzadeh, M. Azizi, A. Mirzaei and A. Azari, J. Photochem. Photobiol., A, 2016, 314, 178–188 CrossRef CAS.
- B. Kakavandi, A. Esrafili, A. Mohseni-Bandpi, A. Jonidi Jafari and R. Rezaei Kalantary, Water Sci. Technol., 2014, 69, 147 CrossRef CAS PubMed.
- S. L. Zhang, L. C. Tao, M. Jiang, G. J. Gou and Z. W. Zhou, Mater. Lett., 2015, 157, 281–284 CrossRef CAS.
- X. D. Zhu, F. Qian, Y. C. Liu, D. Matera, G. Wu, S. Zhang and J. M. Chen, Carbon, 2016, 99, 338–347 CrossRef CAS.
- L. C. A. Oliveira, E. Pereira, I. R. Guimaraes, A. Vallone, M. Pereira, J. P. Mesquita and K. Sapag, J. Hazard. Mater., 2009, 165, 87–94 CrossRef CAS PubMed.
- T. E. Rufford, D. Hulicova-Jurcakova, Z. Zhu and G. Q. Lu, J. Mater. Res., 2010, 25, 1451–1459 CrossRef CAS.
- Z. Liu, F. Zhang and R. Sasai, Chem. Eng. J., 2010, 160, 57–62 CrossRef CAS.
- M. J. Ahmed and S. K. Theydan, Powder Technol., 2012, 229, 237–245 CrossRef CAS.
- X. H. Li, F. X. Yang, P. Q. Li, X. P. Yang, J. L. He, H. Z. Wang and P. H. Lv, J. Air Waste Manage. Assoc., 2015, 65, 1297–1305 CrossRef CAS PubMed.
- J. L. Wang and W. Wan, Int. J. Hydrogen Energy, 2009, 34, 235–244 CrossRef CAS.
- M. Irani, L. R. Rad, H. Pourahmad and I. Haririan, Microporous Mesoporous Mater., 2015, 206, 1–7 CrossRef CAS.
- M. Danish, W. A. Khanday, R. Hashim, N. S. B. Sulaiman, M. N. Akhtar and M. Nizami, Ecotoxicol. Environ. Saf., 2017, 139, 280–290 CrossRef CAS PubMed.
- S. Ray, S. J. Reaume and J. A. Lalman, Int. J. Hydrogen Energy, 2010, 35, 5332–5342 CrossRef CAS.
- F. A. De Santana, J. T. P. Barbosa, G. D. Matos, M. G. A. Korn and S. L. C. Ferreira, Microchem. J., 2013, 110, 198–201 CrossRef CAS.
- B. Khemakhem, I. Fendri, I. Dahech, K. Belghuith, R. Kammoun and H. Mejdoub, Ind. Crops Prod., 2013, 43, 334–339 CrossRef CAS.
- N. S. O. P. China, Test methods of wooden activated carbon-Determination of iodine number. In GB/T 12496.8-2015 Search PubMed.
- C. Moreno-Castilla, M. V. López-Ramón and F. Carrasco-Marin, Carbon, 2000, 14, 1995–2001 CrossRef.
- M. Evans, Optimization of Manufacturing Processes: A Response Surface Approach, Carlton House Terrace, 2003 Search PubMed.
- A. Kumar, B. Prasad and I. Mishra, Chem. Eng. Technol., 2010, 30, 932–937 CrossRef.
- N. S. O. P. China, Water quality-Determination of chromium(VI)-1,5 Diphenylcarbohydrazide spectrophotometric method. In GB/T 7467-1987 Search PubMed.
- A. Kundu, G. Redzwan, J. N. Sahu, S. Mukherjee and B. S. Gupta, BioResources, 2014, 1, 1498–1518 Search PubMed.
- M. Loredo-Cancino, E. Soto-Regalado, F. J. Cerino-Córdova, R. B. García-Reyes, A. M. García-León and M. T. Garza-González, J. Environ. Manage., 2013, 125, 117–125 CrossRef CAS PubMed.
- J. Bedia, V. M. Monsalvo, J. J. Rodriguez and A. F. Mohedano, Chem. Eng. J., 2017, 318, 224–230 CrossRef CAS.
- J. A. Zazo, J. Bedia, C. M. Fierro, G. Pliego, J. A. Casas and J. J. Rodriguez, Catal. Today, 2012, 187, 115–121 CrossRef CAS.
- K. F. Fu, Q. Y. Yue, B. Y. Gao, Y. Y. Sun, Y. Wang, Q. Li, P. Zhao and S. H. Chen, J. Taiwan Inst. Chem. Eng., 2014, 45, 3007–3015 CrossRef CAS.
- H. Laksaci, A. Khelifi, M. Trari and A. Addoun, J. Cleaner Prod., 2017, 147, 254–262 CrossRef CAS.
- S. K. R. Kuppireddy, K. Rashid, A. Al Shoaibi and C. Srinivasakannan, Chem. Eng. Commun., 2014, 201, 1021–1040 CrossRef CAS.
- Y. Su, Y. Cheng and Y. Shih, J. Environ. Eng., 2013, 129, 361–366 CAS.
- S. K. Theydan and M. J. Ahmed, J. Anal. Appl. Pyrolysis, 2012, 97, 116–122 CrossRef CAS.
- B. Wanassi, I. B. Hariz, C. M. Ghimbeu, C. Vaulot, M. B. Hassen and M. Jeguirim, Environ. Sci. Pollut. Res., 2017, 24, 10041–10055 CrossRef CAS PubMed.
- J. Y. Zheng, Q. L. Zhao and Z. F. Ye, Appl. Surf. Sci., 2014, 299, 86–91 CrossRef CAS.
- T. H. Wang, S. X. Tan and C. H. Liang, Carbon, 2009, 47, 1880–1883 CrossRef CAS.
- W. F. Chen, W. Wang, X. Zhang and J. Zhang, J. Environ. Eng., 2016, 142, 04016068 CrossRef.
- X. D. Zhu, Y. C. Liu, F. Qian, C. Zhou, S. C. Zhang and J. M. Chen, Bioresour. Technol., 2014, 154, 209–214 CrossRef CAS PubMed.
- V. Ranjithkumar, S. Sangeetha and S. Vairam, J. Hazard. Mater., 2014, 273, 127–135 CrossRef CAS PubMed.
- S. M. Yakout and G. Sharaf El-Deen, Arabian J. Chem., 2016, 9, S1155–S1162 CrossRef CAS.
- A. C. Lua and T. Yang, J. Colloid Interface Sci., 2004, 274, 594–601 CrossRef CAS PubMed.
- J. J. Liang, M. Chen, S. L. Jiang and D. D. Ma, Chin. J. Environ. Eng., 2016, 02, 723–728 Search PubMed.
- W. F. Liu, J. Zhang, C. L. Zhang, Y. F. Wang and Y. Li, Chem. Eng. J., 2010, 162, 677–684 CrossRef CAS.
- W. F. Chen, L. Pan, L. F. Chen, Z. Yu, Q. Wang and C. C. Yan, Appl. Surf. Sci., 2014, 309, 38–45 CrossRef CAS.
- K. Y. Foo and B. H. Hameed, Chem. Eng. J., 2010, 156, 2–10 CrossRef CAS.
- B. H. Hameed, A. L. Ahmad and K. N. A. Latiff, Dyes Pigm., 2007, 75, 143–149 CrossRef CAS.
- E. Erdem, N. Karapinar and R. Donat, J. Colloid Interface Sci., 2004, 280, 309–314 CrossRef CAS PubMed.
- S. S. Hao, J. L. Zhu, H. Huang, W. H. Wu and H. Chen, Chin. J. Environ. Eng., 2012, 08, 2693–2697 Search PubMed.
- N. Shimada, H. Kawamoto and S. Saka, J. Anal. Appl. Pyrolysis, 2008, 81, 80–87 CrossRef CAS.
- T. E. Benavidez, R. Martinezduarte and C. D. Garcia, Anal. Methods, 2016, 8, 4163–4176 RSC.
- Z. A. Zainal, R. Ali, C. H. Lean and K. N. Seetharamu, Energy Convers. Manage., 2001, 12, 1499–1515 CrossRef.
- J. P. Boudou, D. Bégin, E. Alain, G. Furdin, J. F. Marêché and A. Albiniak, Fuel, 1998, 77, 601–606 CrossRef CAS.
| This journal is © The Royal Society of Chemistry 2018 |

