 Open Access Article
High-throughput lipidomics reveal mirabilite regulating lipid metabolism as anticancer therapeutics†
Hong-lian Zhanga,
Ai-hua Zhanga,
Xiao-hang Zhoua,
Hui Suna,
Xiang-qian Wanga,
Liu Liangb and
Xi-jun Wang *abc
*abc
aNational Chinmedomics Research Center, Sino-America Chinmedomics Technology Collaboration Center, National TCM Key Laboratory of Serum Pharmacochemistry, Laboratory of Metabolomics, Department of Pharmaceutical Analysis, Heilongjiang University of Chinese Medicine, Heping Road 24, Harbin, China. E-mail: xijunwangls@126.com; Fax: +86-451-82110818; Tel: +86-451-82110818
bState Key Laboratory of Quality Research in Chinese Medicine, Macau University of Science and Technology, Avenida Wai Long, Taipa, Macau
cNational Engineering Laboratory for the Development of Southwestern Endangered Medicinal Materials, Guangxi Botanical Garden of Medicinal Plant, Nanning, Guangxi, China
First published on 18th October 2018
Abstract
Altered lipid metabolism is an emerging hallmark of cancers. Mirabilite has a therapeutic effect on colorectal cancer (CRC); however, its metabolic mechanism remains unclear. This study aims to explore the potential therapeutic targets of mirabilite protection against colorectal cancer in APCmin/+ mice model. Oral administration of mirabilite was started from the ninth month, while the same dosage of distilled water was given to both the control group and the model group. Based on lipidomics, we collected serum samples of all mice at the 20th week and used a non-targeted method to identify the lipid biomarkers of CRC. Compared with C57BL/6J mice, the metabolic profile of CRC model mice was significantly disturbed, and we identified that 25 lipid-related biomarkers, including linoleic acid, 2-hydroxybutyric acid, 6-deoxocastasterone, hypoxanthine, PC(16:1), PC(18:4), and retinyl acetate, were associated with CRC. According to the abovementioned results, there were six lipid molecules with significant differences that can be used as new targets for handling of CRC through six metabolic pathways, namely, linoleic acid metabolism, retinol metabolism, propanoate metabolism, arachidonic acid metabolism, biosynthesis of unsaturated fatty acids and purine metabolism. Compared with the model group, the metabolic profiles of these disorders tend to recover after treatment. These results indicated that the lipid molecules associated with CRC were regulated by mirabilite. In addition, we identified seven key lipid molecules, of which four had statistical significance. After administration of mirabilite, all disordered metabolic pathways showed different degrees of regulation. In conclusion, high-throughput lipidomics approach revealed mirabilite regulating the altered lipid metabolism as anticancer therapeutics.
1 Introduction
Colorectal cancer (CRC), one of the most widespread malignant tumors in the world, is the third most commonly diagnosed cancer among people in the US and has increased in morbidity and mortality year by year.1 CRC usually originates from enteritis, such as inflammatory bowel disease and Crohn's disease,2 and results in cancer in the early to middle and late stages of adenoma. Age, gender, daily lifestyles and diet habits also contribute to the development of cancer.3 At present, the concealment of the disease course is still a difficult problem for contemporary medical professionals. It is usually discovered in an advanced stage, and the 5 year survival rate has been sharply declined.4 In clinical practice, serum tumor markers, imaging examinations, and colonoscopy are mainly used to follow-up and check postoperative recurrence of CRC.5,6 Moreover, new therapies such as anti-EGFR antibody treatment and bevacizumab and imaging techniques are used to increase the detection rate of metastatic lesions, which can influence the survival of patients with long-term lesions.7,8 However, the sensitivity and specificity of tumor biomarker detection and imaging for screening of recurrent tumors are not ideal, while colonoscopy causes some trauma and cannot be repeatedly used at high frequencies.Lipids, one of the important nutrients, have many subspecies with physiological functions, such as energy storage,9 biofilm skeleton formation,10 signal transmission,11 participation in signal recognition, and immunity.12 The common feature of cancer progression and metastasis is metabolic reprogramming, such as lipid remodeling that maintains the proliferation of cancer cells.13 Numerous studies have shown that abnormalities in lipid metabolism are associated with the occurrence, development, invasion and metastasis of cancer.14,15
Traditional Chinese medicine (TCM) has the functions of preventing, treating, diagnosing diseases as well as rehabilitation and improving healthcare. Modern pharmacology studies showed that many types of TCM have the potential function of resisting malignant diseases, and some TCM products, such as paclitaxel, were proved to have anti-tumor effects.16 Mirabilite, one of purging drugs, has effects on relieving constipation by purgation; moistening dryness and softening; clearing fire and detumescence. It is reported that mirabilite has the effect on gastrointestinal diseases such as acute peritonitis, pancreatitis and abdominal pain.17 However, there is no report for anticancer effect of mirabilite.
Metabolomics is a strong tool to explore metabolite and unlock the biological mysteries by detecting small molecule metabolites with relative molecular weight less than 1000,18 which provide the investigation of the physiological or pathophysiological intermediate or end-point metabolites under different processes. Based on metabolomics, the metabolic profiles given by non-target metabolic analysis platforms can improve our understanding of human disease status.19 Lipidomics, a part of metabolomics sciences, provide sensitive and accurate analysis of many lipid molecules. In the previous study, we have used the high-throughput lipidomics method to characterize the key lipid molecules as potential therapeutic targets for Alzheimer's disease.20 UPLC-Q-TOF-MS is considered as one of the powerful tools for representing complex biological samples.
In the current study, we used a sophisticated UPLC-Q-TOF-MS system coupled with multivariate data analysis as well as integrated network analysis to explore the potential lipids in the serum samples of APCmin/+ mice. Based on the metabolomics, the system clearly supplied the disturbed serum profiles under the condition of CRC and the treatment of mirabilite for 10 weeks, which could deeply explore serum biomarkers called back by mirabilite and elaborate the mechanism of mirabilite acting on APCmin/+ mice.
2 Experiment
2.1 Chemical reagents
Mirabilite was obtained from TongRentang Pharmacy (Harbin, China). Both methanol and acetonitrile (UHPLC grade) were bought from Thermo Fisher Scientific (America). Ultrapure water was self-produced (Millipore, Bedford, MA, USA). Formic acid was purchased from Aladdin Reagent Co. Ltd (Shanghai, China). Leucine enkephalin was purchased from St. Louis, USA. Other reagents were of analytical grade.2.2 Animals
The mice were purchased from Nanjing biomedical research institute of Nanjing University (No. 12, Xuefu Road, High-tech Industrial Development Zone, Nanjing, China). The mice acquired were C57BL/6J mice and APCmin/+-C57BL/6J (APCmin/+) mice. The animal certificate number of APCmin/+ was N000132. The seven-week-old male mice were transported by air to the laboratory under controlled light conditions to administer food and water freely. Then, we allowed the mice to grow adaptively for two weeks in specific pathogen-free (SPE) conditions. The temperature maintained was 18–20 °C and relative humidity was 50–60%. The mice were free to eat and drink in the housing conditions. Next, for the control group, we chose C57BL/6J mice and for the model group and mirabilite-treated group, we randomly used APCmin/+ mice. Each group had five mice (weighting 20 ± 2 g).The mice in the mirabilite group were continuously treated at the dose of 0.1 mL/10 g once per day orally for 10 weeks after the mice became nine weeks old. Distilled water was given to the mice both in the control group and model group at the same dose per day. The rest of the article will name each group as follows: the control group, the model group and mirabilite-treated groups.
Additionally, we bought ten male ICR mice from safety evaluation center in Heilongjiang university of Chinese medicine and then, we randomly divided the mice into two groups. Five mice were placed in the normal-control group and the other five mice were placed in the normal-mirabilite treated group with the same dose of mirabilite administered to the mirabilite-treated group every day, and were fed in the same condition of APCmin/+ mice for 7 days. The experimental procedures were approved by the Animal Care and Ethics Committee at Heilongjiang University of Chinese Medicine and all experiments were performed in accordance to the declaration of Helsinki.
2.3 Sample preparation
After administration of mirabilite for 10 weeks, all 15 mice were fasted for 12 hours and then sacrificed. Blood samples were collected by picking the eyeball. The serum samples were centrifuged at 4000 rpm for 15 min at 4 °C. The supernatant was instantly stored at −80 °C. The serum samples were thawed in an ice water bath ahead of UPLC-MS analysis. We absorbed 50 μL serum and added 200 μL methanol in the 1.5 mL Eppendorf microcentrifuge tube to remove macromolecular proteins. Then, we centrifuged the mixture of thawed serum and methanol at 13![[thin space (1/6-em)]](https://www.rsc.org/images/entities/char_2009.gif) 000 rpm for 15 minutes at 4 °C. The supernatant was transferred to the HPLC vial and kept under cold storage at 4 °C.
000 rpm for 15 minutes at 4 °C. The supernatant was transferred to the HPLC vial and kept under cold storage at 4 °C.
2.4 The preparation of quality control (QC) sample
In order to check the stability and reproducibility of the instrument, we prepared the mixed serum sample of all the serum samples as a QC sample, in accordance with the same procedure. The QC sample provided an interval test for the entire sample sequence. We chose to set up one QC per 5 injections.2.5 Instruments and conditions
An UPLC system was used for the objective analysis of serum samples depending on MassLynx™ 4.1. The chromatography column was C18 Acquity UPLC HSS T3 Column (100 mm × 2.1, 1.8 μm). The column temperature was 40 °C. The gradient elution conditions were set as follows: 0–1.5 min, 2 to 16% B; 1.5–2.0 min, 16% to 20% B; 2.0–4.0 min, 20% to 60% B; 4.0–4.5 min, 60 to 65% B; 4.5–8.0 min, 65 to 70% B; 8.0–10.0 min, 70 to 100% B; 10–12 min, 100% B; 12–12.5 min, 100 to 2% B; held at 2% B for 2 min to keep column's equilibration and a flow rate of 0.300 mL min−1. The injection volume of serum was 2 μL. A was 0.1% formic acid in water and B was 0.1% formic acid in acetonitrile (v/v). After injection was completed each time, a needle washing cycle was performed to make sure that the residue was discarded.Both Waters Acquity TM UPLC liquid chromatography-Waters Synapt TM High Definition MS (HDMS/MS) System and MassLynx V4.1 workstation were chosen to record the chromatogram. The detailed settings were as follows. Detection was proceeded under ESI+ and ESI−, relatively. The capillary voltage was 3.0 kV, the cone voltage was 30 V, and the desolation temperature was 350 °C. The rates of desolation flow and cone gas were 600 L h−1 and 50 L h−1, respectively. Source temperature was at 110 °C. Scan range was between m/z 50 and 1500. To ensure precise and stable scanning, a lock-mass of leucine enkephalin had flow rate of 5 μL min−1 (ESI+: [M + H]+ = 556.2771 and ESI−: [M − H]− = 554.2615).
2.6 Data processing
As shown in the graphic abstract (GA), we took all the primary UPLC-MS data into the Progenesis QI 1.0 software for preconditioning (Fig. 1). The stable and intellective procedure was competent enough to process thousands of data files simultaneously. This procedure contained alignment, normalization, and peak picking. Multivariate analysis was completed by EZinfo 2.0 software to generate the multidimensional matrix, such as principal component analysis (PCA) and orthogonal partial least squares discriminant analysis (OPLS-DA). Combined with t test analysis, we gained the potential information of differential compounds. The MassFragment™ program manager (Waters Corporation, Milford, MA, USA) was used to get cleavage information. Then the identification of the ions references the dataset resource such as HMDB (Human Metabolome Database), Chem Spider, KEGG (http://www.kegg.jp), and Omicbean.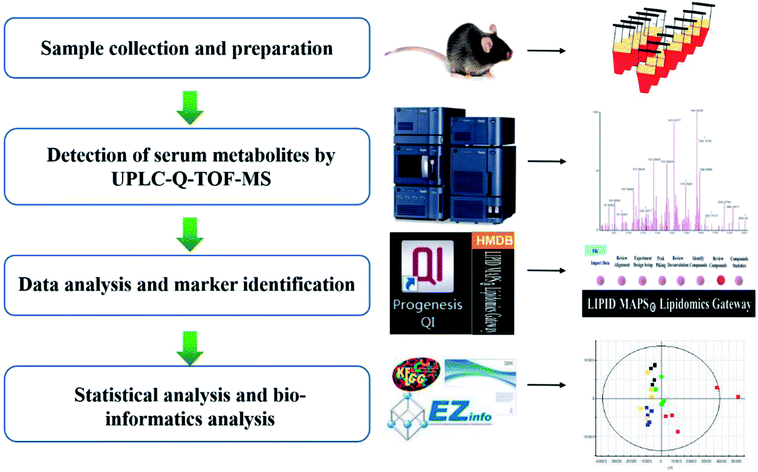 | ||
| Fig. 1 Data processing workflow of high-throughput lipidomics revealing mirabilite regulating lipid metabolism. | ||
2.7 Histopathological analysis
We rinsed the intestines with saline and put fresh intestinal tissue in formalin and kept for 24 h. Subsequently, we viewed the tissue histology after operations such as embedding, slicing, and H&E staining. Then, we used Image pro-plus to analyze the intensity.3 Results
3.1 Preventive effect of mirabilite on colorectal cancer
Histopathological examination showed that the mice had well-organized intestinal mucosal structures and intact cells in the control group by the H&E stained method (Fig. 2A). However, the bowel gland cells were crowded with the disorganized cellular structure and the partial area had typical hyperplasia, thus causing cancerous change in the model group (Fig. 2B). In contrast, the intestinal tissue of mice showed regional correction and recovery in the mirabilite-treated group (Fig. 2C). | ||
| Fig. 2 The histopathological test of H&E stained intestinal segment in the CON (A), MOD (B), and Mirabilite-treated group (C). | ||
3.2 Global analysis of the altered lipid profile of the APCmin/+ model
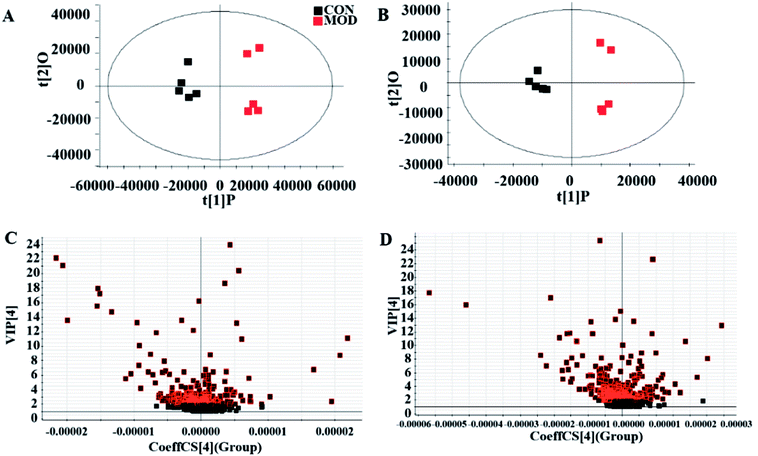
We collected metabolic profiles of serum sample in two groups by full-scan analysis in both ESI+ and ESI− (Fig. 3). Then, we imported the original data column into Progenesis QI, which completed the peak selection and identification. The 2D ion intensity map showed about 9537 ion peaks in ESI+ and 10![[thin space (1/6-em)]](https://www.rsc.org/images/entities/char_2009.gif) 863 ion peaks in ESI−. Based on the HMDB, 2364 ions in ESI+ and 2369 ions in ESI− were matched. Finally, “.usp” files were received by the statistics process. The score plot of PCA responded to the differences between control and model group (Fig. 4). In the ESI+, we could see that the data were clearly separated between the model and control groups, which suggested that the APC gene was successfully knocked out and the symptoms of CRC were confirmed. The OPLS-DA score plot is shown in Fig. 5(A and B) and the VIP plot is shown in Fig. 5(C and D). The VIP plot made great contributions on dataset classification by exploring the different variables.
863 ion peaks in ESI−. Based on the HMDB, 2364 ions in ESI+ and 2369 ions in ESI− were matched. Finally, “.usp” files were received by the statistics process. The score plot of PCA responded to the differences between control and model group (Fig. 4). In the ESI+, we could see that the data were clearly separated between the model and control groups, which suggested that the APC gene was successfully knocked out and the symptoms of CRC were confirmed. The OPLS-DA score plot is shown in Fig. 5(A and B) and the VIP plot is shown in Fig. 5(C and D). The VIP plot made great contributions on dataset classification by exploring the different variables.
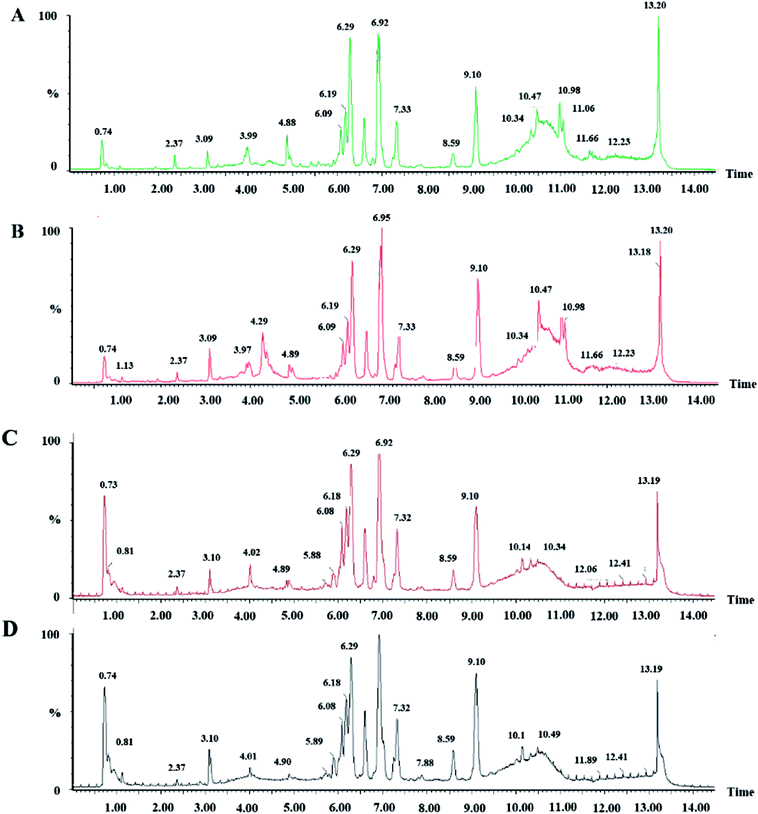 | ||
| Fig. 3 Serum BPI chromatograms of CON and MOD in positive ion mode (A and B) and negative ion mode (C and D). | ||
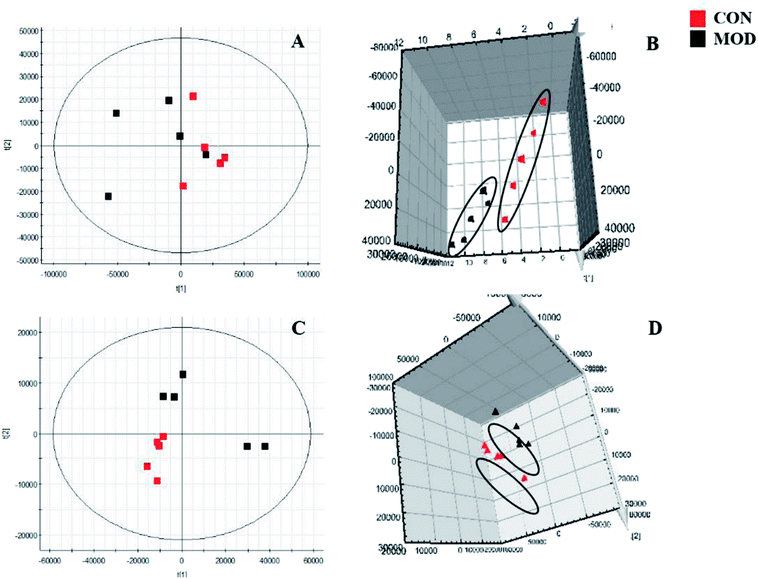 | ||
| Fig. 4 Score plot of PCA in serum metabolism profile of control and model groups. ((A and B) 2D and 3D positive ion mode in PCA analysis; (C and D) 2D and 3D negative ion mode in PCA analysis). | ||
3.3 Identification of potential lipid biomarkers of APCmin/+ model
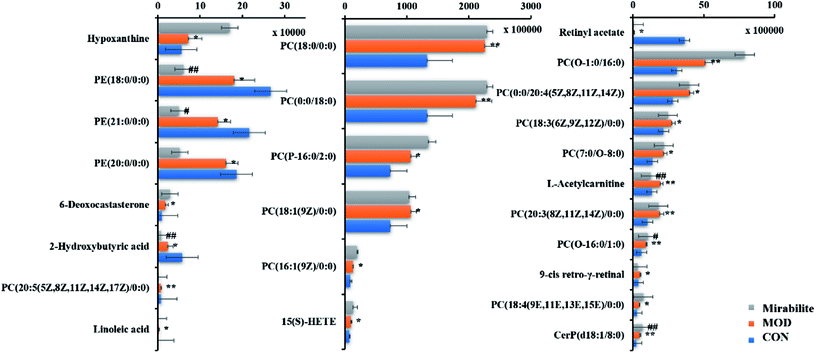
The corresponding VIP plots visually exhibited significant ion differences between the control and model groups. In addition, VIP > 1 and p < 0.05 were selected as the next analysis target in the current study. Sequentially, the biomarkers were matched by the detailed fragmentation information with Mass Fragment™ application manager based on accurate MS and MS/MS data. Then, through a variety of database searches, such as Lipidomics Gateway, HMDB, and KEGG, the detailed information of compound identification was obtained and listed in the attached table (Table S1†). Finally, we obtained 25 possible lipid biomarkers, namely, acetyl-L-carnitine, linoleic acid, 2-hydroxybutyric acid, 15(S)-HETE, 6-deoxocastasterone, hypoxanthine, retinyl acetate, 9-cis-retro-γ-retinal, PC(18:3), PC(16:1), PC(18:4), PE(18:0/0:0), PC(7:0/O-8:0), PC(P-16:0/2:0), PC(O-16:0/1:0), PC(O-1:0/16:0), PE(21:0/0:0), CerP(d18:1/8:0), PC(20:3), PC(18:0/0:0), PC(20:5/0:0), PE(20:0/0:0), PC(0:0/20:4), PC(18:1), and PC(0:0/18:0). Additionally, a clustering heat map showed the significant changes in serum metabolites between the control mice and APCmin/+ mice (Fig. 6). The bar graph for relative intensity of biomarkers is shown in the Fig. 7.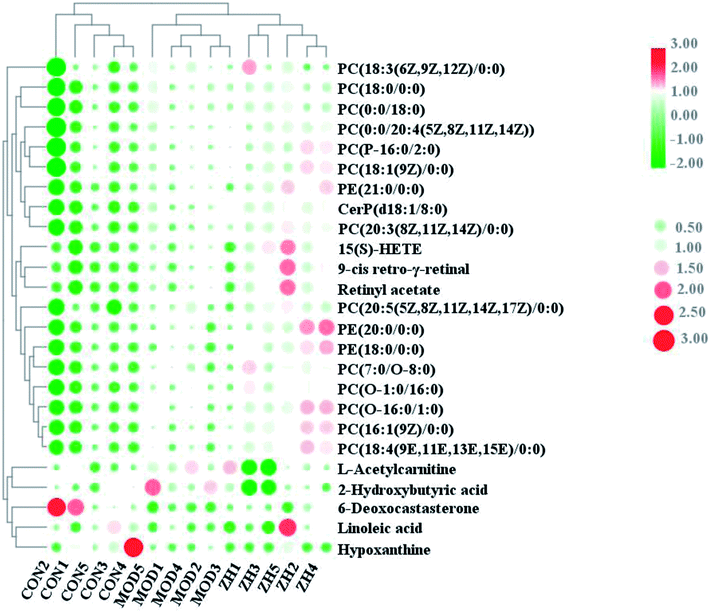 | ||
| Fig. 6 Heat map showed relationship of lipid compounds in serum samples from control, model and mirabilite-treated groups. | ||
3.4 The perturbed lipid metabolic pathways
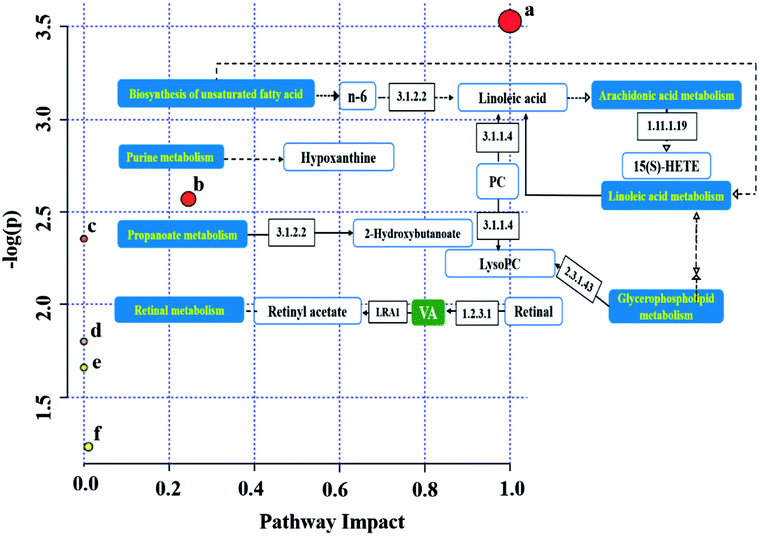
We obtained six metabolic pathways related to CRC from the MetaboAnalyst 4.0 website. The metabolic pathways were linoleic acid metabolism, retinol metabolism, propanoate metabolism, arachidonic acid metabolism, biosynthesis of unsaturated fatty acids, and purine metabolism, as shown in Fig. 7, and the one within impact value >0.1 was considered as the important pathways was greater than 0.1 as the focus of our analysis (Table S2†). We drew related metabolic pathways of CRC according to the information of potential biomarkers and KEGG (Fig. 8).3.5 The metabolic profile analysis of mirabilite efficacy
We used supervised variable analysis to obtain PLS-DA scores for control, model, and mirabilite-treatment groups to characterize the pharmacodynamic effects of mirabilite. As shown in Fig. 9, the control group and the model group were clearly separated. In the negative ion mode, the mirabilite-treated group was between the control group and the model group, and it was closer to the control group, which indicated that mirabilite had a certain regulatory effect on the APCmin/+ mice. However, the results were not very clear in the positive ion mode. | ||
| Fig. 9 The PLS-DA score plot of control, model and mirabilite-treated groups in serum metabolism profile ((A) positive ion mode, (B) negative ion mode). | ||
3.6 Discovering key lipid molecules from the mirabilite against CRC
From the above results, we can conclude that mirabilite had a certain influence on transgenic mice. Furthermore, we needed to determine the key biomarkers. The relative peak intensities of biomarkers in control, model and mirabilite-treated groups were listed in the measurement table given by Progenesis QI. We could see that eleven biomarkers were regulated by mirabilite, namely, retina acetate, linoleic acid, 2-hydroxybutyric acid, 15(S)-HETE, 6-deoxocastasterone, hypoxanthine, L-acetylcarnitine, PC(16:1(9Z)/0:0), PC(18:4(9E,11E,13E,15E)/0:0), PE(18:0/0:0), and PE(21:0/0:0). In addition, 2-hydroxybutyric acid, L-acetylcarnitine, retinyl acetate, PE(18:0/0:0), PE(21:0/0:0) and PC(16:1(9Z)/0:0) showed significant differences between model and mirabilite-treated groups, which suggested that retinol metabolism, propanoate metabolism and glycerophospholipid metabolism were mainly regulated by mirabilite according to KEGG.3.7 The influence of mirabilite in the normal mice
Although mirabilite had a positive effect on the APCmin/+ mice, we need to be sure whether mirabilite influence in the normal mice and the identified biomarkers were specific targets of mirabilite under the condition of disease. Therefore, we designed the experiment to confirm the efficacy of biomarkers for illustrating the mechanism of mirabilite. The distinct biomarkers included 15(S)-HETE, L-acetylcarnitine, PE(18:0/0:0), and PE(21:0/0:0), which corresponded with biomarkers of APCmin/+ mice. These results suggested that glycerophospholipid metabolism and arachidonic acid metabolism in the normal mice were affected by mirabilite. In contrast, the lipid biomarkers such as linoleic acid, 2-hydroxybutyric acid, 6-deoxocastasterone, hypoxanthine, PC(16:1(9Z)/0:0), PC(18:4(9E,11E,13E, 15E)/0:0), and retinyl acetate were not viewed in the normal-mirabilite treated group. This indicated that these biomarkers were specific biomarkers for efficacy of mirabilite under disease state.4 Discussion
In this research, 25 lipid-related biomarkers associated with CRC were identified, which were closely related to the pathogenesis of CRC. The metabolic pathways associated with the serum of APCmin/+ were disturbed. Compared with the model group, the metabolic profiles of these disorders tend to recover, which was consistent with the control group, indicating that mirabilite inhibited the development of CRC. Moreover, we identified six key lipid molecules, of which four had statistical significance.Vitamin A (VA), also named retinol, is involved in a variety of physiological and biochemical processes. VA can be obtained from the diet and the dietary retinol ester is converted into retinol in the small intestine or intestinal mucosa, and then esterified to form retinoic acid in the intestinal cells. The original vitamin A is a carotenoid absorbed by mucosal cells, which first transforms into retinal aldehyde in vivo and then transforms into retinol21 and enters the blood circulation through lymphatic vessels and stores in the liver.22 Vitamin A is essential for mucosal immunity23 and cell differentiation. It is reported that the content of vitamin A is related to the changes in the ecological function of the colon recess, which is closely related to the development of colitis and CRC.24 APCmin/+ mice strain was established based on mutation of adenomatosis polyposis coli (APC) gene in C57BL/6J mice, which has truncation at the 850th codon of APC.25 Therefore, the absence of the β-catenin binding domain did not induce the degradation of β-catenin and hence, excess β-catenin transported into the nucleus to promote the tumorigenesis.26 According to the retinol metabolism on the KEGG website, retinyl acetate can be converted to VA by diacylglycerol O-acyltransferase, and phosphatidylcholine-retinol O-acyltransferase and 9-cis-retinal was the downstream metabolite of VA. It is known that β-catenin promoted immune tolerance by inducing VA metabolism via the β-catenin/T-cell factor pathway in dendritic cells,27,28 which indicated that VA metabolism was important to the CRC. In the current study, the retinyl acetate and 9-cis retro-γ-retinal were significantly different in the control and model groups, and both of them were called back after the administration of mirabilite. These results illustrated that oral mirabilite may improve immune function in APCmin/+ mice.
Based on the abovementioned results, we can summarize that LysoPC compounds disordered in the model group, and most of the LysoPC compounds had been returned to normal levels by the treatment of mirabilite. These metabolites belonged to glycerophospholipid metabolism, which has strong hemolytic effects. Lipid metabolism involved the regulation of many cellular processes such as cell growth, proliferation, differentiation, inflammation, chemotherapeutic response and drug resistance.29–36 Moreover, lipid metabolism was regulated by multiple signaling pathways and produced a variety of bioactive lipid molecules associated with the activation or regulation of different signaling pathways, such as fatty acids, phosphatidic acid, lysophosphatidic acid, ceramides, sphingosine and cholesterol.37,38 It is known that lipid metabolism is merely related to CRC.39 It has been shown that more LDs exist in the CRC cells than the normal counterpart,40 which would be the target of CRC.41
Abnormal expression of lipid metabolism in mice of the model group suggested that the energy metabolism was disordered and tumor proliferation was accelerated.42 This also reflects the state of the mucosal barrier and the intestinal permeability.43 After administration of mirabilite, some of the lipid metabolites reverted, such as PC(16:1(9Z)/0:0), PC(18:4(9E,11E,13E,15E)/0:0), PE(18:0/0:0), and PE(21:0/0:0). These results indicated that the CRC progression of the treated mice was inhibited. Propanoate metabolism was found to be another pathway regulated by mirabilite in this study. Propionic acid, one of short-chain fatty acids (SCFA), can be absorbed to decrease the risk of cardiovascular disease.44 Intestinal short-chain fatty acids are involved in the energy supply of intestinal epithelial cells and can affect the pH and electrolyte balance in the intestinal lumen, the permeability of the intestinal mucosal barrier as well as the regulation of intestinal motility, anti-inflammatory and anti-tumor effects etc.45 Global metabolomics opens up new avenues for biomarker discovery. Lipidomics profiling can provide an innovative tool for better understanding the disease mechanisms and can also be used to discover the lipid molecules as potential therapeutic targets for disease.46–57
5 Conclusions
In the current study, we used a high-throughput UPLC-Q-TOF-MS technology to find potential lipid biomarkers in APCmin/+ mice based on the lipidomics. Ultimately, we obtained 25 potential biomarkers. In addition, we found six perturbed pathways of CRC, namely, linoleic acid metabolism, retinol metabolism, propanoate metabolism, arachidonic acid metabolism, biosynthesis of unsaturated fatty acids, and purine metabolism, which also reflected different degrees of callback after oral administration. In addition, six lipids molecules might be potential targets for mirabilite's treatment of CRC. This study revealed that mirabilite could achieve anticancer effects by regulating changes in lipid metabolism.Conflicts of interest
There are no conflicts to declare.Acknowledgements
This study was supported by grants from the Key Program of Natural Science Foundation of State (Grant No. 81830110, 81430093, 81373930, 81673586, 81302905, 81503386), National Key Subject of Drug Innovation (Grant No. 2015ZX09101043-005, 2015ZX09101043-011), TCM State Administration Subject of Public Welfare of (Grant No. 2015468004), University Nursing Program for Young Scholars with Creative Talents in Heilongjiang Province (UNPYSCT-2015118), Young Talent Lift Engineering Project of China Association of Traditional Chinese Medicine (QNRC2-B06).References
- R. L. Siegel, K. D. Miller and S. A. Fedewa, et al., Colorectal cancer statistics, 2017, Ca-Cancer J. Clin., 2017, 67(3), 104–117 CrossRef PubMed.
- A. Zhang, H. Sun, G. Yan, P. Wang, Y. Han and X. Wang, Metabolomics in diagnosis and biomarker discovery of colorectal cancer, Cancer Lett., 2014, 345(1), 17–20 CrossRef CAS PubMed.
- G. Grosso, A. Biondi, F. Galvano, A. Mistretta, S. Marventano, S. Buscemi, F. Drago and F. Basile, Factors associated with colorectal cancer in the context of the Mediterranean diet: a case-control study, Nutr. Cancer, 2014, 66(4), 558–565 CrossRef CAS PubMed.
- T. Liu, X. Zhang, S. Gao, F. Jing, Y. Yang, L. Du and G. Zheng, Exosomal long noncoding RNA CRNDE-h as a novel serum-based biomarker for diagnosis and prognosis of colorectal cancer, Oncotarget, 2016, 7(51), 85551–85563 Search PubMed.
- F. Brannstrom and U. Gunnarsson, Risk factors for local recurrence after emergency resection for colon cacer: scecario in Sweden, Dig. Surg., 2016, 33(6), 503–508 CrossRef PubMed.
- L. A. Duineveld and K. M. van Asselt, et al., Symptomatic and asymptomatic colon cancer recurrence: a multi-center cohort study, Ann. Fam. Med., 2016, 14(3), 215–220 CrossRef PubMed.
- L. B. Saltz, S. Clarke and E. Diaz-Rubio, et al., Bevacizumab in combination with oxaliplatinbased chemotherapy as first-line therapy in metastatic colorectal cancer: a randomized phase III study, J. Clin. Oncol., 2008, 26, 2013–2019 CrossRef CAS PubMed.
- N. Knijn, J. Tol and C. J. Punt, Current issues in the targeted therapy of advanced colorectal cancer, Discov. Med., 2010, 9, 328–336 Search PubMed.
- S. P. Wang, H. Yang and J. W. Wu, et al., Metabolism as a tool for understanding human brain evolution: Lipid energy metabolism as an example, J. Hum. Evol., 2014, 77, 41–49 CrossRef PubMed.
- M. Espinosa-Urgel and S. Marqués, New insights in the early extracellular events in hydrocarbon and lipid biodegradation, Environ. Microbiol., 2017, 19(1), 15 CrossRef PubMed.
- Y. Zhou, P. Prakash and H. Liang, et al., Lipid-Sorting Specificity Encoded in K-Ras Membrane Anchor Regulates Signal Output, Cell, 2017, 168(1–2), 239 CrossRef CAS PubMed.
- K. S. Bonham, M. H. Orzalli and K. Hayashi, et al., A promiscuous lipid-binding protein diversifies the subcellular sites of Toll-like Receptor signal transduction, Cell, 2014, 156(4), 705–716 CrossRef CAS PubMed.
- N. N. Pavlova and B. T. Craig, The emerging hallmarks of cancer metabolism, Cell Metab., 2016, 23(1), 27–47 CrossRef CAS PubMed.
- A. Zhang, S. Qiu, H. Sun, T. Zhang, Y. Guan, Y. Han, G. Yan and X. Wang, Scoparone affects lipid metabolism in primary hepatocytes using lipidomics, Sci. Rep., 2016, 6, 28031 CrossRef CAS PubMed.
- C. Liu, W.-j. Zong, A.-h. Zhang, H.-m. Zhang, Y.-h. Luan, H. Sun, H.-x. Cao and X.-j. Wang, Lipidomic characterisation discovery for coronary heart disease diagnosis based on high-throughput ultra-performance liquid chromatography and mass spectrometry, RSC Adv., 2018, 8, 647–654 RSC.
- N. V. Jordan, A. Bardia and B. S. Wittner, et al., HER2 expression identifies dynamic functional states within circulating breast cancer cells, Nature, 2016, 537(7618), 102 CrossRef CAS PubMed.
- X. Lu, W. Xiao, X. Kang, J. Yu and Z. Fan, The effect of Chinese herbal medicine on non-biliogenic severe acute pancreatitis: a systematic review and meta-analysis, J. Ethnopharmacol., 2014, 155(1), 21–29 CrossRef PubMed.
- A. Zhang, H. Fang and Y. Wang, et al., Discovery and verification of the potential targets from bioactive molecules by network pharmacology-based target prediction combined with high-throughput metabolomics, RSC Adv., 2017, 7, 51069–51078 RSC.
- A. H. Zhang, J. B. Yu and H. Sun, et al., Identifying quality-markers from Shengmai San protects against transgenic mouse model of Alzheimer's disease using chinmedomics approach, Phytomedicine, 2018, 45, 84–92 CrossRef CAS PubMed.
- H. L. Gao, A. H. Zhang and J. B. Yu, et al., High-throughput lipidomics characterize key lipid molecules as potential therapeutic targets of Kaixinsan protects against Alzheimer's disease in APP/PS1 transgenic mice, J. Chromatogr. B: Anal. Technol. Biomed. Life Sci., 2018, 1092, 286–295 CrossRef CAS PubMed.
- M. E. Gottesman, L. Quadro and W. S. Blaner, Studies of vitamin A metabolism in mouse model systems, Bioessays, 2010, 23(5), 409–419 CrossRef PubMed.
- P. Czarnewski, S. Das and S. M. Parigi, et al., Retinoic Acid and Its Role in Modulating Intestinal Innate Immunity, Nutrients, 2017, 9(1), 68 CrossRef PubMed.
- M. R. Bono, G. Tejon and F. Floressantibañez, et al., Retinoic Acid as a Modulator of T Cell Immunity, Nutrients, 2016, 8(6), 349 CrossRef PubMed.
- E. Doldo, G. Costanza and S. Agostinelli, et al., Vitamin A, Cancer Treatment and Prevention: The New Role of Cellular Retinol Binding Proteins, BioMed Res. Int., 2015, 2015(4), 509–514 Search PubMed.
- A. M. Lefebvre, I. Chen and P. Desreumaux, et al., Activation of the peroxisome proliferator-activated receptor promotes the development of colon tumors in C57BL/6J-APCMin/+ mice, Nat. Med., 1998, 4(9), 1053–1057 CrossRef CAS PubMed.
- P. J. Morin, K. W. Kinzler and A. B. Sparks, β-Catenin Mutations: Insights into the APC Pathway and the Power of Genetics, Cancer Res., 2016, 76(19), 5587–5589 CrossRef CAS PubMed.
- Y. Hong, I. Manoharan and A. Suryawanshi, et al., β-catenin promotes regulatory T-cell responses in tumors by inducing vitamin A metabolism in dendritic cells, Cancer Res., 2015, 75(4), 656–665 CrossRef CAS PubMed.
- S. Amol and M. Santhakumar, Tumors induce immune tolerance through activation of β-catenin/TCF4 signaling in dendritic cells: A novel therapeutic target for cancer immunotherapy, OncoImmunology, 2015, 4(12), e1052932 CrossRef PubMed.
- J. Qian, Y. Chen and T. Meng, et al., Molecular regulation of apoptotic machinery and lipid metabolism by mTORC1/mTORC2 dual inhibitors in preclinical models of HER2+/PIK3CAmut breast cancer, Oncotarget, 2016, 7(41), 67071–67086 CrossRef PubMed.
- S. Qiu, A. Zhang and T. Zhang, et al., Dissect new mechanistic insights for geniposide efficacy on the hepatoprotection using multiomics approach, Oncotarget, 2017, 8(65), 108760–108770 Search PubMed.
- H. Chu, A. Zhang and Y. Han, et al., Metabolomics approach to explore the effects of Kai-Xin-San on Alzheimer's disease using UPLC/ESI-Q-TOF mass spectrometry, J. Chromatogr. B: Anal. Technol. Biomed. Life Sci., 2016, 1015–1016, 50–61 CrossRef CAS PubMed.
- X. Li, A. Zhang and H. Sun, et al., Metabolic characterization and pathway analysis of berberine protects against prostate cancer, Oncotarget, 2017, 8, 65022–65041 Search PubMed.
- A. Zhang, H. Sun and X. Wang, Emerging role and recent applications of metabolomics biomarkers in obesity disease research, RSC Adv., 2017, 7(25), 14966–14973 RSC.
- Q. Zhao, A. Zhang and W. Zong, et al., Exploring potential biomarkers and determining the metabolic mechanism of type 2 diabetes mellitus using liquid chromatography coupled to high-resolution mass spectrometry, RSC Adv., 2017, 7(70), 44186–44198 RSC.
- J. Yu, L. Kong and A. Zhang, et al., High-Throughput Metabolomics for Discovering Potential Metabolite Biomarkers and Metabolic Mechanism from the APPswe/PS1dE9 Transgenic Model of Alzheimer's Disease, J. Proteome Res., 2017, 16(9), 3219–3228 CrossRef CAS PubMed.
- J. Ren, A. Zhang and L. Kong, et al., Advances in Mass Spectrometry-based Metabolomics for Investigation of Metabolites, RSC Adv., 2018, 8, 22335 RSC.
- C. Huang and C. Freter, Lipid metabolism, apoptosis and cancer therapy, Int. J. Mol. Sci., 2015, 16(1), 924–949 CrossRef CAS PubMed.
- R. Zechner, R. Zimmermann and T. O. Eichmann, et al., FAT SIGNALS-lipases and lipolysis in lipid metabolism and signaling, Cell Metab., 2007, 5(6), 279–291 Search PubMed.
- A. K. Cotte, V. Aires and M. Fredon, et al., Lysophosphatidylcholine acyltransferase 2-mediated lipid droplet production supports colorectal cancer chemoresistance, Nat. Commun., 2018, 9(1), 322 CrossRef PubMed.
- L. Tirinato, C. Liberale and S. D. Franco, et al., Lipid Droplets: A New Player in Colorectal Cancer Stem Cells Unveiled by Spectroscopic Imaging, Stem Cells, 2015, 33(1), 35–44 CrossRef CAS PubMed.
- Y. Sun, W. He and M. Luo, et al., SREBP1 regulates tumorigenesis and prognosis of pancreatic cancer through targeting lipid metabolism, Tumor Biol., 2015, 36(6), 4133–4141 CrossRef CAS PubMed.
- G. Yan, L. Li and B. Zhu, et al., Lipidome in colorectal cancer, Oncotarget, 2016, 7(22), 33429–33439 CrossRef PubMed.
- A. Zhang, Q. Liu and H. Zhao, et al., Phenotypic characterization of nanshi oral liquid alters metabolic signatures during disease prevention, Sci. Rep., 2016, 6, 19333 CrossRef CAS PubMed.
- M. S. Bousquet, J. J. Ma and R. Ratnayake, et al., Multidimensional Screening Platform for Simultaneously Targeting Oncogenic KRAS and Hypoxia-Inducible Factors Pathways in Colorectal Cancer, ACS Chem. Biol., 2016, 11(5), 1322–1331 CrossRef CAS PubMed.
- A. Koh, F. D. Vadder and P. Kovatcheva-Datchary, et al., From Dietary Fiber to Host Physiology: Short-Chain Fatty Acids as Key Bacterial Metabolites, Cell, 2016, 6(165), 1332–1345 CrossRef PubMed.
- J. Yu, L. Kong and A. Zhang, et al., High-Throughput Metabolomics for Discovering Potential Metabolite Biomarkers and Metabolic Mechanism from the APPswe/PS1dE9 Transgenic Model of Alzheimer's Disease, J. Proteome Res., 2017, 16(9), 3219–3228 CrossRef CAS PubMed.
- A. Zhang, H. Sun and G. Yan, et al., Mass spectrometry-based metabolomics: applications to biomarker and metabolic pathway research, Biomed. Chromatogr., 2016, 30(1), 7–12 CrossRef PubMed.
- A. Zhang, H. Sun and Z. Wang, et al., Metabolomics: towards understanding traditional Chinese medicine, Planta Med., 2010, 76(17), 2026–2035 CrossRef CAS PubMed.
- A. Zhang, H. Sun and X. Wang, Mass spectrometry-driven drug discovery for development of herbal medicine, Mass Spectrom. Rev., 2018, 37(3), 307–320 CrossRef CAS PubMed.
- H. Sun, A. Zhang and X. Wang, Potential role of metabolomic approaches for Chinese medicine syndromes and herbal medicine, Phytother. Res., 2012, 26(10), 1466–1471 CAS.
- A. Zhang, H. Sun and G. Yan, et al., Metabolomics for Biomarker Discovery: Moving to the Clinic, BioMed Res. Int., 2015, 2015, 354671 Search PubMed.
- H. Sun, A. Zhang and G. Yan, et al., Metabolomic analysis of key regulatory metabolites in hepatitis C virus-infected tree shrews, Mol. Cell. Proteomics, 2013, 12(3), 710–719 CrossRef CAS PubMed.
- X. Wang, H. Sun and A. Zhang, et al., Potential role of metabolomics apporoaches in the area of traditional Chinese medicine: as pillars of the bridge between Chinese and Western medicine, J. Pharm. Biomed. Anal., 2011, 55(5), 859–868 CrossRef CAS PubMed.
- X. Y. Liu, A. H. Zhang and H. Fang, et al., Serum metabolomics strategy for understanding the therapeutic effects of Yin-Chen-Hao-Tang against Yanghuang syndrome, RSC Adv., 2018, 8(14), 7403–7413 RSC.
- X. Wang, A. Zhang and Y. Han, et al., Urine metabolomics analysis for biomarker discovery and detection of jaundice syndrome in patients with liver disease, Mol. Cell. Proteomics, 2012, 11(8), 370–380 CrossRef PubMed.
- Y. Nan, X. Zhou and Q. Liu, et al., Serum metabolomics strategy for understanding pharmacological effects of ShenQi pill acting on kidney yang deficiency syndrome, J. Chromatogr. B: Anal. Technol. Biomed. Life Sci., 2016, 1026, 217–226 CrossRef CAS PubMed.
- X. Wang, A. Zhang and H. Sun, et al., Discovery and development of innovative drug from traditional medicine by integrated chinmedomics strategies in the post-genomic era, TrAC, Trends Anal. Chem., 2016, 76, 86–94 CrossRef CAS.
Footnote |
| † Electronic supplementary information (ESI) available. See DOI: 10.1039/c8ra06190d |
| This journal is © The Royal Society of Chemistry 2018 |

