 Open Access Article
Creative Commons Attribution 3.0 Unported Licence
Thermal transport characterization of carbon and silicon doped stanene nanoribbon: an equilibrium molecular dynamics study
Ishtiaque Ahmed Navid and
Samia Subrina *
*
Department of Electrical and Electronic Engineering, Bangladesh University of Engineering and Technology, Dhaka, 1205, Bangladesh. E-mail: samiasubrina@eee.buet.ac.bd; ssubr002@ucr.edu; Fax: +88-02-9668054; Tel: +880-19-3795-9083 Tel: +88-02-9668054
First published on 12th September 2018
Abstract
Equilibrium molecular dynamics simulation has been carried out for the thermal transport characterization of nanometer sized carbon and silicon doped stanene nanoribbon (STNR). The thermal conduction properties of doped stanene nanostructures are yet to be explored and hence in this study, we have investigated the impact of carbon and silicon doping concentrations as well as doping patterns namely single doping, double doping and edge doping on the thermal conductivity of nanometer sized zigzag STNR. The room temperature thermal conductivities of 15 nm × 4 nm doped zigzag STNR at 2% carbon and silicon doping concentration are computed to be 9.31 ± 0.33 W m−1 K−1 and 7.57 ± 0.48 W m−1 K−1, respectively whereas the thermal conductivity for the pristine STNR of the same dimension is calculated as 1.204 ± 0.21 W m−1 K−1. We find that the thermal conductivity of both carbon and silicon doped STNR increases with the increasing doping concentration for both carbon and silicon doping. The magnitude of increase in STNR thermal conductivity due to carbon doping has been found to be greater than that of silicon doping. Different doping patterns manifest different degrees of change in doped STNR thermal conductivity. Double doping pattern for both carbon and silicon doping induces the largest extent of enhancement in doped STNR thermal conductivity followed by single doping pattern and edge doping pattern respectively. The temperature and width dependence of doped STNR thermal conductivity has also been studied. For a particular doping concentration, the thermal conductivity of both carbon and silicon doped STNR shows a monotonic decaying trend at elevated temperatures while an opposite pattern is observed for width variation i.e. thermal conductivity increases with the increase in ribbon width. Such comprehensive study on doped stanene would encourage further investigation on the proper optimization of thermal transport characteristics of stanene nanostructures and provide deep insight in realizing the potential application of doped STNR in thermoelectric as well as thermal management of stanene based nanoelectronic devices.
1. Introduction
The synthesis as well as characterization of graphene, due to its intriguing electronic,1 thermal2 and mechanical3 properties, has instigated enormous research interest into two dimensional (2D) nanomaterials.4–8 Recently, the synthesis of the 2D structures of heavier group-IV elements namely silicene, germanene and stanene9,10 have incited attention due to their graphene like honeycomb structure. Stanene is a 2D buckled hexagonal allotrope of tin (Sn)11 with enhanced thermoelectricity12 and quantum anomalous Hall effect.13 It has promising potential as a topological insulator14 and a topological superconductor15 as well as a quantum Hall insulator.16,17 Furthermore, spin orbiting coupling (SOC) induces a bulk bandgap of ∼0.1 eV for free-standing stanene while it shows zero bandgap without spin orbiting coupling.11 It has gapless edge states with band dispersion in the bulk gap as well as helical edge states with the spin-momentum locked which can be used for dissipationless conduction.11,18 Moreover, there are reports of very low thermal conductivity17,19 and high carrier mobility20 of pristine stanene which make stanene a promising candidate for next generation thermoelectric applications. Significant improvement in the thermoelectric figure of merit (zT) can be achieved in a system with simultaneously good electrical and low phonon transport. This fact urges the investigation of electrical as well as thermal transport characteristics of stanene nanostructures and explores the prospect of stanene in thermoelectric applications.Chemical doping of materials with foreign atoms is an effective way to alter material properties. Wei et al. synthesized nitrogen doped graphene using chemical vapor deposition and observed that it shows n-type behavior with decreased mobility hence decreased conductivity but enhanced on/off ratio.21 Panchakarla et al. also synthesized bilayer structures of boron and nitrogen doped graphene which resulted in p-type and n-type doping respectively and reported that both types of doping caused increase in electrical conductivity in the bilayer structure.22 On the other hand, quantum anomalous hall effect and tunable topological states have been reported by Zhang et al. in 3d transitional metals doped silicene.23 Garg et al. performed density functional theory calculations and reported band gap opening in stanene with doped boron-nitride24 whereas Shaidu et al. observed superconductivity in lithium and calcium doped stanene.25 The doping characteristics of 31 different adatoms on monolayer stanene have also been investigated by Naqvi et al.26 On the other hand, thermal transport characterization of doped stanene is yet to be explored. However, the thermal transport in doped graphene with nitrogen27 and hydrogen28 has been studied. The tunable thermal conductivity of silicene by isotopic doping29 and germanium doping30 has also been reported. The stanene analogues of 2D hexagonal group-IV elements carbon and silicon i.e. graphene and silicene of nanometer size are reported to have much higher thermal conductivities31,32 compared to that of stanene nanostructure.33 The calculated thermal conductivity of 10 nm × 3 nm sized pristine stanene nanoribbon (STNR) is 0.95 W m−1 K−1.33 These suggest that a detail investigation on the thermal transport characteristics of doped stanene nanostructures is significant for the proper understanding of possible industrial applications of stanene nanostructures.
In this study, we perform equilibrium molecular dynamics (EMD) simulation for the calculation of the thermal conductivity of carbon and silicon doped zigzag STNR. We investigate how the carbon and silicon doping concentrations influence the STNR thermal conductivity along with the calculation of heat current autocorrelation function (HCACF) and phonon density of states (PDOS). We also carry out a comparative study on thermal transport variation in STNR due to carbon and silicon doping. Subsequently, the effect of various types of doping patterns namely single doping, double doping, and edge doping on the thermal transport of STNR has been evaluated. Finally, the impact of varying temperature as well as nanoribbon width on the thermal conductivity of doped STNR has been examined at different carbon and silicon doping concentrations.
2. Simulation details
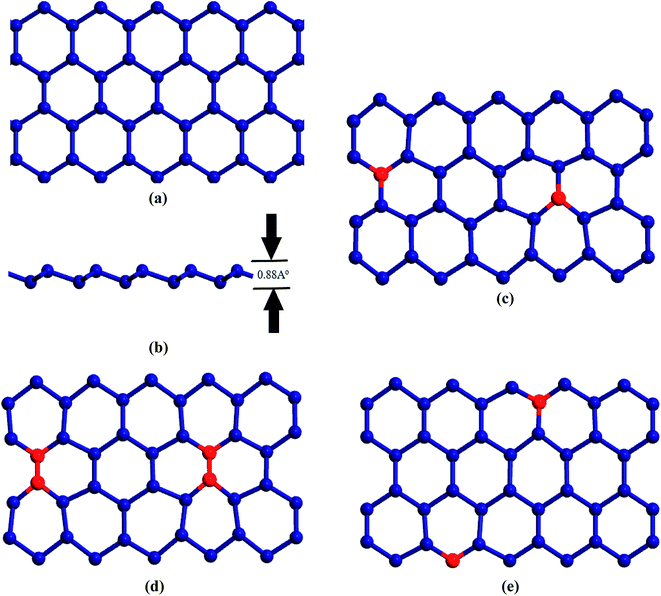
Fig. 1(a) and (b) are the schematic representations for the atomic structure of 15 nm × 4 nm sized pristine zigzag STNR considered in this study. Geometric optimization process was carried out involving energy minimization with steepest decent algorithm accompanied by equilibration and thermalization. The Sn–Sn bond length in the equilibrated STNR is 2.83 Å with the geometry optimized buckling height of 0.88 Å and lattice constant of 4.68 Å. These values are consistent with the reported literature values.24,26,34–36We have modeled three types of doping patterns in STNR with carbon and silicon atoms of different concentration as shown in Fig. 1(c)–(e) and investigated the impact of doping in thermal transport of STNR. The single doped structures result from the random substitution of a tin atom by the dopant atom, either carbon or silicon, as represented in Fig. 1(c). Fig. 1(d) depicts the double doped structure which is generated by replacing a pair of bonding tin atoms by a pair of bonding dopant atoms. Edge doping is considered as a particular form of single doping which involves the substitution of a tin atom by the dopant atom only on the edge of the nanoribbon structure as shown in Fig. 1(e).
EMD simulations using LAMMPS (Large-scale Atomic/Molecular Massively Parallel Simulator)37 has been carried out in order to compute the thermal conductivity of carbon and silicon doped STNR. The Sn–Sn bond interaction in stanene has been modeled using the optimized Tersoff type bond order potential parameters proposed by Cherukara et al.19 On the other hand, for describing the C–C and Si–Si atomic interaction, optimized Tersoff and Brenner empirical potential38 and Stillinger–Weber (SW) potential39 parameters have been used, respectively. Furthermore, the Sn–C and Sn–Si bonding interactions are described by employing standard 12-6 Lennard-Jones (LJ) potential V(r) as following:
 | (1) |
We applied periodic boundary condition along zigzag direction in our EMD simulation. The system energy was minimized using steepest descent algorithm and velocity-Verlet integrator was employed for the numerical integration of the equations of atomic motions with a time step of 0.5 fs. The system equilibration as well as thermalization was performed applying Nose–Hoover thermostat for 1.6 × 10⁵ time steps followed by NVE ensemble for 2 × 10⁵ time steps. Linear response theorem41 is applied for calculating thermal conductivity in EMD. In this case, the heat current vectors along with their correlations are computed throughout the simulation. Thermal conductivity is related to the ensemble average of HCACF by the well-known Green–Kubo formulation:
 | (2) |
 | (3) |
We recorded the heat current data in every 5 steps in order to obtain the HCACFs. Subsequently, 10 of the obtained HCACFs were averaged for computing the heat current autocorrelation values. The thermal conductivity values were calculated applying eqn (2). Finally, the converged value of average thermal conductivity is taken as the average of 5 independent microcanonical ensembles each with a different initial velocity.
Fix Phonon command45 of LAMMPS has been employed for evaluating the phonon density of states (PDOS). It involves the direct calculation of the dynamical matrices from MD simulation based on fluctuation dissipation theory. Once the dynamical matrices were obtained, PDOS was calculated using an auxiliary post-processing code called ‘phana’. In this study, a tricubic46 interpolation method with uniform q (wave vector) points was taken under consideration for the calculation of PDOS.
3. Results and discussion
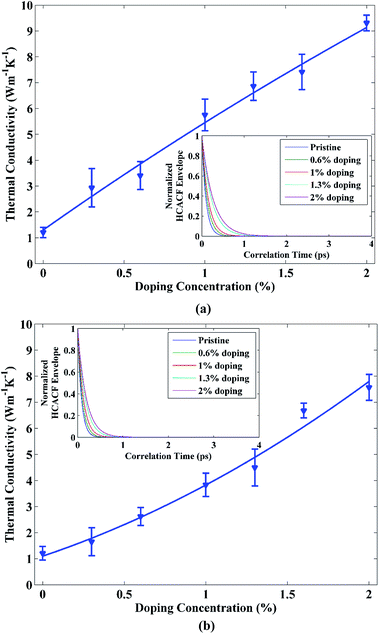
Our estimated thermal conductivity for 15 nm × 4 nm pristine STNR at room temperature is 1.204 ± 0.21 W m−1 K−1. Khan et al.33 reported the room temperature thermal conductivity for 10 nm × 3 nm sized zigzag STNR to be 0.95 ± 0.024 W m−1 K−1 by using EMD which is in good agreement with our result. Moreover, Cherukara et al.19 estimated the thermal conductivity value of 2.8 ± 0.2 W m−1 K−1 at 300 K for 80 nm × 80 nm zigzag stanene sheet and they predicted the lowering of this thermal conductivity value with nanostructuring. This also conforms well to our obtained result. On the other hand, using first principle calculations, Nissimagoudar et al.47 computed the room temperature thermal conductivity of zigzag stanene sheet to be 10.83 W m−1 K−1 and Peng et al.17 reported the room temperature stanene thermal conductivity to be 11.6 W m−1 K−1. The authors also expected further reduction in the thermal conductivity values with decreasing dimensionality and this is in accordance with our result as well. However, STNR doped with carbon and silicon exhibits thermal conductivity variation as shown in Fig. 2(a) and (b), respectively. For both the doping materials, the thermal conductivity of the STNR increases with the increase of doping concentration. The calculated room temperature thermal conductivities of doped STNR at 2% doping concentration of carbon and silicon are 9.31 ± 0.33 W m−1 K−1 and 7.57 ± 0.48 W m−1 K−1, respectively.As STNR is doped with impurity, most of the high frequency phonons are localized due to the impurity centers.48 Therefore, the contribution of heat conduction from high frequency phonons is largely suppressed. As a result, the low frequency phonons with longer wavelengths play the dominant role in heat transport under these circumstances. Now, due to the low Debye temperature of pure stanene, there is an elevated scattering rate of high frequency phonons resulting in their low phonon group velocity and thus low thermal conductivity of pristine stanene.17 On the other hand, low frequency phonons in stanene have comparatively high group velocities and hence low scattering. Therefore, majority of thermal transport contribution in pristine stanene comes from these low frequency phonon modes.17 The impurity centers due to doping localize and suppress the high frequency phonons which have greater scattering rates. As a result, the weakly scattering low frequency phonon modes conducive to thermal conduction become more dominant. Hence, there is an overall improvement in the thermal conductivity of the carbon and silicon doped STNR. This fact is further illustrated by the HCACF profiles depicted in the insets of Fig. 2(a) and (b) for carbon and silicon doped structure, respectively. There is an enhanced localization hence suppression of high frequency phonons having greater scattering rates with increase in doping concentration. Consequently, the HCACF profiles decay at slower rates with the increasing doping concentration for both carbon and silicon doping. Slower decay rates of HCACF profile result in the calculation of higher thermal conductivity of doped STNR.
The thermal transport in the doped stanene can be further explained considering the phonon density of states (PDOS) for pristine stanene as well as its carbon and silicon counterparts graphene and silicene, respectively as shown in Fig. 3. The PDOS profiles of graphene and silicene both have large peaks at higher frequency regions (∼50 THz and ∼10 THz respectively) compared to that of stanene (∼2 THz). These peaks at high frequency regions for both graphene and silicene result in their much larger thermal conductivity values than that of stanene.49,50 Therefore, the incorporation of these comparatively high thermal conductivity materials into the low thermal conductivity nanostructure such as stanene would enhance the thermal transport property of the overall system.
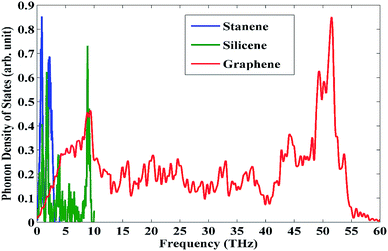 | ||
| Fig. 3 Phonon density of states for representative pristine stanene, silicene and graphene nanoribbons. | ||
As can be seen from Fig. 4, the thermal conductivity of carbon doped STNR is higher than the silicon doped nanostructure since the ratio of thermal conductivity for carbon and silicon doped STNR is greater than one at all concentrations. This can be attributed to the mass effect of these elements. The carbon doped STNR has smaller average atomic mass than that of silicon doped STNR. Smaller average atomic mass results in higher Debye temperature which corresponds to higher value of thermal conductivity.51 This can be further explained from the fact that high atomic masses lower the sound velocity in materials thereby reducing the thermal conductivity.52 As a result, doping stanene with the heavier atom i.e. silicon has less increase in thermal conductivity compared to doping with the lighter atom i.e. carbon.
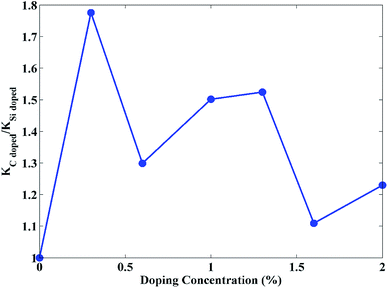 | ||
| Fig. 4 Ratio of thermal conductivity for carbon doped STNR (KC doped) and that of silicon doped STNR (KSi doped) as a function of doping concentration. | ||
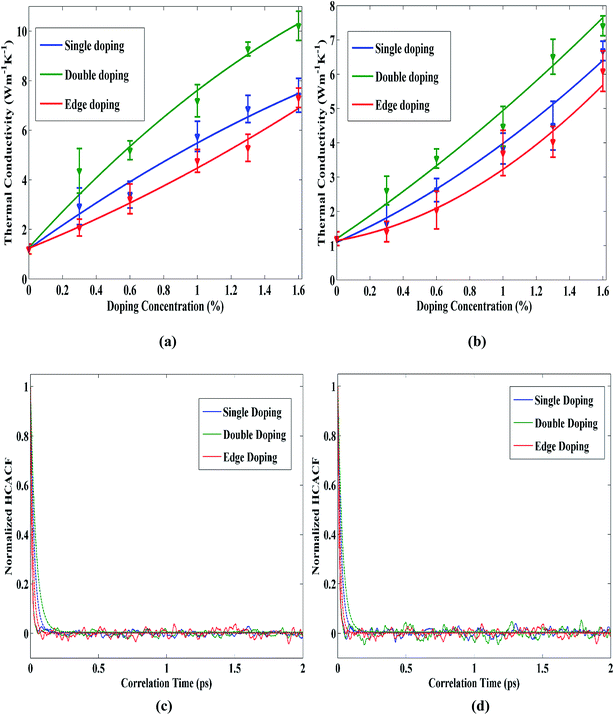
Next, we consider the impact of doping patterns on the thermal conductivity of STNR. Fig. 5(a) and (b) show the thermal conductivity variation of single, double and edge pattern doped STNR as a function of carbon and silicon doping concentration, respectively. The results suggest that the thermal conductivity of STNR increases with increased doping concentration for all three types of doping patterns. The thermal conductivity of double doped structure has higher value compared to other two patterns while of the remaining two patterns, single doping has greater thermal conductivity enhancement impact than edge doping.
In case of the double doping pattern, the doping centers act more like a molecule (i.e. C–C, Si–Si) doping center and the number of localized low frequency phonons is low.53 Hence, the delocalized low frequency phonons available for double doping pattern contribute to the large thermal conductivity enhancement.
For single doping pattern, the single doping centers cause degeneracy in the low frequency region around discrete single dope centers which results in localization of more low frequency phonon modes compared to double doping pattern.53 As a result, thermal conductivity enhancement due to low frequency modes in single doped structure is not so high as that of double doped STNR. Furthermore, since edge doping is a special case of single doping pattern, along with the enhanced localized low frequency phonon modes, edge dope centers additionally cause phonon edge scattering. This, in turn, limits its thermal conductivity enhancement impact in comparison with single and double doping patterns. For understanding this phenomenon further, Fig. 5(c) and (d) can be taken under consideration which depict the reasonable decay of HCACF profiles as well as their envelopes for single, double and edge doping patterns with carbon and silicon doping respectively. In both of these figures, it can be observed that the HCACF profile decays in the shortest time for edge doping pattern followed by single doping and double doping patterns respectively, thus substantiating the thermal conductivity variations found for these doping patterns.
Fig. 6(a) and (b) depict the total energy during the simulation time for several STNR doping patterns at 0.6% and 1% carbon and silicon doping concentration, respectively. In both cases, it can be observed that the energy variations of the doped STNRs are negligible. This, in turn, implies that the STNR structures of various doping patterns with carbon and silicon dopants are energetically well stable.
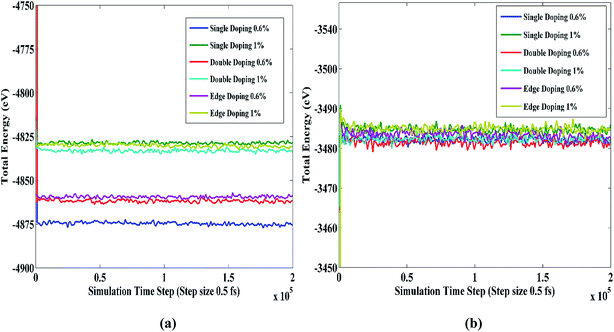 | ||
| Fig. 6 Total energy of different types of doped STNRs as a function of simulation time at room temperature for (a) carbon doping (b) silicon doping. | ||
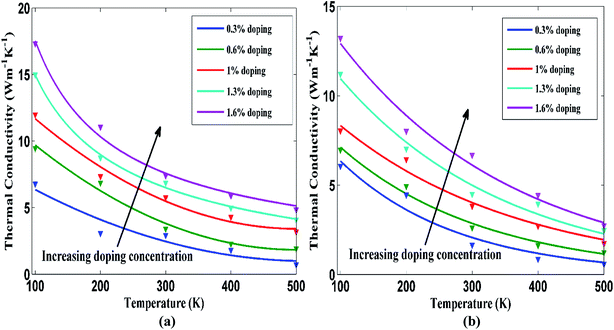
Next, the temperature dependence of thermal conductivity for doped STNR has also been investigated for different doping concentrations. Fig. 7(a) and (b) present the thermal conductivity of a 15 nm × 4 nm doped STNR with carbon and silicon atoms, respectively as a function of temperature for doping concentrations ranging from 0.3% to 1.6%. The thermal conductivity of STNR monotonically decays with increasing temperature for a specific doping concentration. This trend is in agreement with the studies of thermal conductivity for doped graphene by Goharshadi et al.27 This also conforms well to the results of Ye et al. where it is reported that the thermal conductivity of graphene nanoribbon (GNR) is reduced with increasing temperature due to significant decrease in relaxation time.54 Furthermore, Peng et al.,17 Cherukara et al.19 and Khan et al.33 also reported similar temperature dependence in thermal transport of pristine stanene nanostructures.
The thermal conductivity drooping characteristics with the increasing temperature at a particular doping concentration can be explained considering phonon–phonon anharmonic interaction or Umklapp scattering at an elevated temperature. At high temperature, Umklapp scattering becomes highly significant55 and the thermal conductivity is dominated by the highly energized thermally excited phonons. As a result, thermal conductivity decreases with the increase of temperature. It is observed that thermal conductivity maintains an inverse relation T−1 with temperature at the beginning but at much higher temperature values, this functional relation is no longer applicable. At sufficiently high temperatures, enhanced anharmonic interactions between the two acoustic phonon modes are accompanied by higher order scattering process56–58 which results in non-linear thermal resistivity. Similar decaying characteristics of thermal conductivity with the increased temperature are observed for other doping concentrations while the curves shift upward with the increasing doping concentration. This is in agreement with the earlier observation that for a specific temperature, the thermal conductivity of doped stanene increases with the increasing doping concentration.
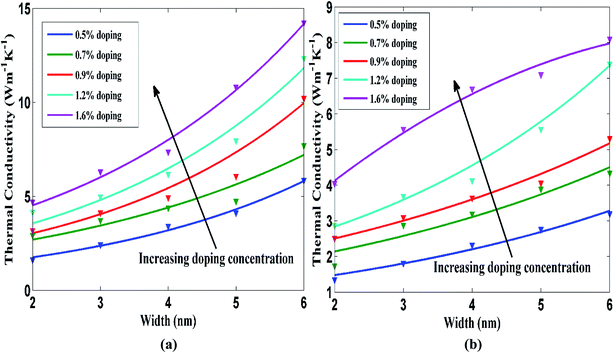
The width dependence of STNR for different carbon and silicon doping concentration has been studied as depicted in Fig. 8(a) and (b), respectively. The figures display the thermal conductivity change of STNR with respect to the nanoribbon width ranging from 2 nm to 6 nm for carbon and silicon doping concentrations of 0.5%, 0.7%, 0.9%, 1.2% and 1.6% while length of the ribbon is kept constant at 15 nm. The thermal conductivity increases with the increasing width for a specific doping concentration. This result is in line with the investigation on the width dependence of thermal conductivity by Khan et al.33 for pristine stanene, by Sevik et al.59 for pristine hexagonal boron nitride nanoribbon as well as by Cao60 and Yang et al.61 for graphene nanoribbon. Ye et al. also found a decreasing trend of GNR thermal conductivity with the reduction of width and attributed it to more intensified boundary scattering with smaller nanoribbon width.54 The set of curves in Fig. 8(a) and (b) drift upwards for increasing doping concentrations.
Two factors namely, edge localized phonon effect or boundary scattering effect and anharmonic phonon–phonon scattering effect need to be considered to provide the better insight of the width effect on STNR thermal conductivity since both the factors adversely affect the thermal conductivity. As the doped STNR width increases, the impact of boundary scattering is reduced resulting in the rise of thermal conductivity. Moreover, with the increase of the ribbon width, the probability of Umklapp scattering is heightened as the number of available phonons increases.
As these two processes contend with each other, the thermal transport characteristics are regulated by the more dominant one. For comparatively narrow STNRs which is the case of our study, the lowering of boundary scattering effect in wider ribbon is more dominant than the intensified Umklapp scattering effect and therefore thermal conductivity rises with the increase in ribbon width.62–65
4. Conclusions
We investigated the impact of carbon and silicon doping concentration as well as doping patterns namely single doping, double doping and edge doping on the thermal transport characteristics of STNR employing equilibrium molecular dynamics simulation in this study. Thermal conductivity of STNR follows an increasing trend with the increasing doping concentration, for both carbon and silicon dopants. This can be attributed to the localization of the high frequency phonon modes having greater scattering rates allowing the weakly scattering low frequency phonon modes to contribute to the thermal conductivity enhancement. Doped STNR with carbon atoms shows higher thermal conductivity than silicon doping owing to the mass difference of carbon and silicon i.e. carbon being lighter than silicon. Double doping pattern, among the considered three patterns, is found to be the most influential in the thermal transport improvement of STNR as this pattern causes the least amount of low frequency phonon modes localization. On the other hand, edge doping pattern yields the least amount of thermal conductivity variation. We also investigate the thermal conductivity as a function of temperature and width of the ribbon. Both carbon and silicon doped STNR shows a decaying thermal conductivity with the increasing system temperature at a particular doping concentration due to high frequency phonon–phonon scattering. Moreover, the doped nanoribbon thermal conductivity continues to increase with the increasing nanoribbon width since the boundary scattering in doped STNR decreases as the width increases and the Umklapp scattering process is least dominant for the range of nanoribbon width considered in this study. Our results would provide valuable insight in realizing the possible application of doped stanene nanostructures in thermoelectric and nanoelectronic devices.Conflicts of interest
There are no conflicts to declare.References
- K. S. Novoselov, A. K. Geim, S. V. Morozov, D. Jiang, M. I. Katsnelson, I. V. Grigorieva, S. V. Dubonos and A. A. Firsov, Two-dimensional gas of massless Dirac fermions in graphene, Nature, 2005, 438, 197–200 CrossRef PubMed.
- J. H. Seol, I. Jo, A. L. Moore, L. Lindsay, Z. H. Aitken, M. T. Pettes, X. Li, Z. Yao, R. Huang, D. Broido, N. Mingo, R. S. Ruoff and L. Shi, Two-dimensional phonon transport in supported graphene, Sci. 80, 2010, 328, 213–216 CrossRef PubMed.
- C. Lee, X. Wei, J. W. Kysar and J. Hone, Measurement of the Elastic Properties and Intrinsic Strength of Monolayer Graphene, Sci. 80, 2008, 321, 385–388 CrossRef PubMed.
- L.-C. Xu, R.-Z. Wang, M.-S. Miao, X.-L. Wei, Y.-P. Chen, H. Yan, W.-M. Lau, L.-M. Liu and Y.-M. Ma, Two dimensional Dirac carbon allotropes from graphene, Nanoscale, 2014, 6, 1113–1118 RSC.
- L. Song, L. Ci, H. Lu, P. B. Sorokin, C. Jin, J. Ni, A. G. Kvashnin, D. G. Kvashnin, J. Lou, B. I. Yakobson and P. M. Ajayan, Large scale growth and characterization of atomic hexagonal boron nitride layers, Nano Lett., 2010, 10, 3209–3215 CrossRef PubMed.
- Y. Huang, J. Guo, Y. Kang, Y. Ai and C. M. Li, Two dimensional atomically thin MoS2 nanosheets and their sensing applications, Nanoscale, 2015, 7, 19358–19376 RSC.
- A. H. Woomer, T. W. Farnsworth, J. Hu, R. A. Wells, C. L. Donley and S. C. Warren, Phosphorene: Synthesis, Scale-Up, and Quantitative Optical Spectroscopy, ACS Nano, 2015, 9, 8869–8884 CrossRef PubMed.
- A. J. Mannix, X. F. Zhou, B. Kiraly, J. D. Wood, D. Alducin, B. D. Myers, X. Liu, B. L. Fisher, U. Santiago, J. R. Guest, M. J. Yacaman, A. Ponce, A. R. Oganov, M. C. Hersam and N. P. Guisinger, Synthesis of borophenes: Anisotropic, two-dimensional boron polymorphs, Sci. 80, 2015, 350, 1513–1516 CrossRef PubMed.
- S. Ornes, News Feature: Beyond graphene, Proc. Natl. Acad. Sci. U. S. A., 2015, 112, 13128–13130 CrossRef PubMed.
- S. Balendhran, S. Walia, H. Nili, S. Sriram and M. Bhaskaran, Elemental analogues of graphene: Silicene, germanene, stanene, and phosphorene, Small, 2015, 11, 640–652 CrossRef PubMed.
- Y. Xu, B. Yan, H. J. Zhang, J. Wang, G. Xu, P. Tang, W. Duan and S. C. Zhang, Large-gap quantum spin hall insulators in tin films, Phys. Rev. Lett., 2013, 111, 1–5 Search PubMed.
- Y. Xu, Z. Gan and S. C. Zhang, Enhanced thermoelectric performance and anomalous seebeck effects in topological insulators, Phys. Rev. Lett., 2014, 112, 1–5 Search PubMed.
- S. C. Wu, G. Shan and B. Yan, Prediction of near-room-temperature quantum anomalous hall effect on honeycomb materials, Phys. Rev. Lett., 2014, 113, 1–5 Search PubMed.
- Y. D. Kuang, L. Lindsay, S. Q. Shi and G. P. Zheng, Tensile strains give rise to strong size effects for thermal conductivities of silicene, germanene and stanene, Nanoscale, 2016, 8, 3760–3767 RSC.
- M. J. Cherukara, K. G. Vishnu and A. Strachan, Role of nanostructure on reaction and transport in Ni/Al intermolecular reactive composites, Phys. Rev. B: Condens. Matter Mater. Phys., 2012, 86, 1–7 CrossRef.
- L. Zhao, G. Tan, S. Hao, J. He, V. P. Dravid, C. Uher and G. J. Snyder, Ultrahigh power factor and thermoelectric performance in hole- doped single-crystal SnSe, Sci. 80, 2016, 351, 141–144 CrossRef PubMed.
- B. Peng, H. Zhang, H. Shao, Y. Xu, X. Zhang and H. Zhu, Low lattice thermal conductivity of stanene, Sci. Rep., 2016, 6, 2–11 CrossRef PubMed.
- C. C. Liu, H. Jiang and Y. Yao, Low-energy effective Hamiltonian involving spin-orbit coupling in silicene and two-dimensional germanium and tin, Phys. Rev. B: Condens. Matter Mater. Phys., 2011, 84, 1–11 Search PubMed.
- M. J. Cherukara, B. Narayanan, A. Kinaci, K. Sasikumar, S. K. Gray, M. K. Y. Chan and S. K. R. S. Sankaranarayanan, Ab Initio-Based Bond Order Potential to Investigate Low Thermal Conductivity of Stanene Nanostructures, J. Phys. Chem. Lett., 2016, 7, 3752–3759 CrossRef PubMed.
- Y. Nakamura, T. Zhao, J. Xi, W. Shi, D. Wang and Z. Shuai, Intrinsic Charge Transport in Stanene: Roles of Bucklings and Electron–Phonon Couplings, Adv. Electron. Mater., 2017, 3, 1–9 Search PubMed.
- D. Wei, Y. Liu, Y. Wang, H. Zhang, L. Huang and G. Yu, Synthesis of n-doped graphene by chemical vapor deposition and its electrical properties, Nano Lett., 2009, 9, 1752–1758 CrossRef PubMed.
- L. S. Panchakarla, K. S. Subrahmanyam, S. K. Saha, A. Govindaraj, H. R. Krishnamurthy, U. V. Waghmare and C. N. R. Rao, Synthesis, structure, and properties of boron- and nitrogen-doped graphene, Adv. Mater., 2009, 21, 4726–4730 Search PubMed.
- X. L. Zhang, L. F. Liu and W. M. Liu, Quantum anomalous hall effect and tunable topological states in 3d transition metals doped silicene, Sci. Rep., 2013, 3, 1–8 Search PubMed.
- P. Garg, I. Choudhuri, A. Mahata and B. Pathak, Band gap opening in stanene induced by patterned B–N doping, Phys. Chem. Chem. Phys., 2017, 19, 3660–3669 RSC.
- Y. Shaidu and O. Akin-Ojo, First principles predictions of superconductivity in doped stanene, Comput. Mater. Sci., 2016, 118, 11–15 CrossRef.
- S. R. Naqvi, T. Hussain, W. Luo and R. Ahuja, Exploring Doping Characteristics of Various Adatoms on Single-Layer Stanene, J. Phys. Chem. C, 2017, 121, 7667–7676 CrossRef.
- E. K. Goharshadi and S. J. Mahdizadeh, Thermal conductivity and heat transport properties of nitrogen-doped graphene, J. Mol. Graphics Modell., 2015, 62, 74–80 CrossRef PubMed.
- C. Li, G. Li and H. Zhao, Thermal conductivity variation of graphene with patterned double-side hydrogen doping, J. Appl. Phys., 2015, 118, 1–7 Search PubMed.
- B. Liu, C. D. Reddy, J. Jiang, H. Zhu, J. A. Baimova, S. V. Dmitriev and K. Zhou, Thermal conductivity of silicene nanosheets and the effect of isotopic doping, J. Phys. D: Appl. Phys., 2014, 47, 1–8 Search PubMed.
- Y. Guo, S. Zhou, Y. Bai and J. Zhao, Tunable Thermal Conductivity of Silicene by Germanium Doping, J. Supercond. Novel Magn., 2016, 29, 717–720 CrossRef.
- X. Zhang, H. Xie, M. Hu, H. Bao, S. Yue, G. Qin and G. Su, Thermal conductivity of silicene calculated using an optimized Stillinger-Weber potential, Phys. Rev. B: Condens. Matter Mater. Phys., 2014, 89, 1–7 Search PubMed.
- A. Khan, I. Navid, M. Noshin, H. Uddin, F. Hossain and S. Subrina, Equilibrium Molecular Dynamics (MD) Simulation Study of Thermal Conductivity of Graphene Nanoribbon: A Comparative Study on MD Potentials, Electronics, 2015, 4, 1109–1124 CrossRef.
- A. I. Khan, R. Paul and S. Subrina, Characterization of thermal and mechanical properties of stanene nanoribbons: a molecular dynamics study, RSC Adv., 2017, 7, 50485–50495 RSC.
- F. Zhu, W. Chen, Y. Xu, C. Gao, D. Guan and C. Liu, Epitaxial Growth of Two-Dimensional Stanene, Nat. Mater., 2015, 14, 1020–1025 CrossRef PubMed.
- B. Van Den Broek, M. Houssa, E. Scalise, G. Pourtois, V. V. Afanas'ev and A. Stesmans, Two-dimensional hexagonal tin: Ab initio geometry, stability, electronic structure and functionalization, 2D Mater., 2014, 1, 1–8 Search PubMed.
- S. Saxena, R. P. Chaudhary and S. Shukla, Stanene: Atomically Thick Free-standing Layer of 2D Hexagonal Tin, Sci. Rep., 2016, 6, 1–4 CrossRef PubMed.
- S. Plimpton, Fast Parallel Algorithms for Short – Range Molecular Dynamics, J. Comput. Phys., 1995, 117, 1–19 CrossRef.
- L. Lindsay and D. A. Broido, Optimized Tersoff and Brenner empirical potential parameters for lattice dynamics and phonon thermal transport in carbon nanotubes and graphene, Phys. Rev. B: Condens. Matter Mater. Phys., 2010, 81, 1–6 CrossRef.
- Y.-Y. Zhang, Q.-X. Pei, J.-W. Jiang, N. Wei and Y.-W. Zhang, Thermal conductivities of single- and multi-layer phosphorene: a molecular dynamics study, Nanoscale, 2016, 8, 483–491 RSC.
- A. K. K. Rappé, C. J. J. Casewit, K. S. S. Colwell, W. A. Goddard III and W. M. Skiff, UFF, a Full Periodic Table Force Field for Molecular Mechanics and Molecular Dynamics Simulations, J. Am. Chem. Soc., 1992, 114, 10024–10035 CrossRef.
- D. Frenkel and B. Smit, Understanding Molecular Simulation: From Algorithms to Applications, Academic Press, San Diego, CA, USA, 2002 Search PubMed.
- F. F. Zhu, W. J. Chen, Y. Xu, C. L. Gao, D. D. Guan, C. H. Liu, D. Qian, S. C. Zhang and J. F. Jia, Epitaxial growth of two-dimensional stanene, Nat. Mater., 2015, 14, 1020–1025 CrossRef PubMed.
- P. K. Schelling, S. R. Phillpot and P. Keblinski, Comparison of atomic-level simulation methods for computing thermal conductivity, Phys. Rev. B: Condens. Matter Mater. Phys., 2002, 65, 1–12 CrossRef.
- M. H. Khadem and A. P. Wemhoff, Comparison of Green-Kubo and NEMD heat flux formulations for thermal conductivity prediction using the Tersoff potential, Comput. Mater. Sci., 2013, 69, 428–434 CrossRef.
- L. T. Kong, Phonon dispersion measured directly from molecular dynamics simulations, Comput. Phys. Commun., 2011, 182, 2201–2207 CrossRef.
- F. Lekien and J. Marsden, Tricubic interpolation in three dimensions, Int. J. Numer. Methods Fluids, 2005, 63, 455–471 CrossRef.
- A. S. Nissimagoudar, A. Manjanath and A. K. Singh, Diffusive nature of thermal transport in stanene, Phys. Chem. Chem. Phys., 2015, 18, 14257–14263 RSC.
- G. Zhang and B. Li, Impacts of doping on thermal and thermoelectric properties of nanomaterials, Nanoscale, 2010, 2, 1058–1068 RSC.
- M. Noshin, A. I. Khan, I. A. Navid, H. M. A. Uddin and S. Subrina, Impact of vacancies on the thermal conductivity of graphene nanoribbons: A molecular dynamics simulation study, AIP Adv., 2017, 7, 1–7 Search PubMed.
- Q. X. Pei, Y. W. Zhang, Z. D. Sha and V. B. Shenoy, Tuning the thermal conductivity of silicene with tensile strain and isotopic doping: A molecular dynamics study, J. Appl. Phys., 2013, 114, 1–6 CrossRef.
- B. Peng, H. Zhang, H. Shao, Y. Xu, X. Zhang and H. Zhu, Thermal conductivity of monolayer MoS2, MoSe2, and WS2: Interplay of mass effect, interatomic bonding and anharmonicity, RSC Adv., 2015, 2, 5767–5773 Search PubMed.
- A. Majumdar, Thermoelectricity in Semiconductor Nanostructures, Sci. 80, 2004, 303, 777–778 CrossRef PubMed.
- J.-W. Jiang, J. Lan, J.-S. Wang and B. Li, Isotopic effects on the thermal conductivity of graphene nanoribbons: localization mechanism, J. Appl. Phys., 2010, 107, 1–5 Search PubMed.
- Z. Q. Ye, B. Y. Cao, W. J. Yao, T. Feng and X. Ruan, Spectral phonon thermal properties in graphene nanoribbons, Carbon N. Y., 2015, 93, 915–923 CrossRef.
- P. Pichanusakorn and P. Bandaru, Nanostructured thermoelectrics, Mater. Sci. Eng., R, 2010, 67, 19–63 CrossRef.
- J. M. Ziman, Electrons and Phonons: The Theory of Transport Phenomena in Solids, Oxford University Press, Amen House, London, UK, 1960 Search PubMed.
- D. J. Ecsedy and P. G. Klemens, Thermal resistivity of dielectric crystals due to four-phonon processes and optical modes, Phys. Rev. B: Solid State, 1977, 15, 5957–5962 CrossRef.
- E. F. Steigmeier and I. Kudman, Acoustical-optical phonon scattering in Ge, Si, and III-V compounds, Phys. Rev., 1966, 141, 767–774 CrossRef.
- C. Sevik, A. Kinaci, J. B. Haskins and T. ÇagIn, Characterization of thermal transport in low-dimensional boron nitride nanostructures, Phys. Rev. B: Condens. Matter Mater. Phys., 2011, 84, 1–7 CrossRef.
- A. Cao, Molecular dynamics simulation study on heat transport in monolayer graphene sheet with various geometries, J. Appl. Phys., 2012, 111, 1–9 Search PubMed.
- D. Yang, F. Ma, Y. Sun, T. Hu and K. Xu, Influence of typical defects on thermal conductivity of graphene nanoribbons: An equilibrium molecular dynamics simulation, Appl. Surf. Sci., 2012, 258, 9926–9931 CrossRef.
- W. J. Evans, L. Hu and P. Keblinski, Thermal conductivity of graphene ribbons from equilibrium molecular dynamics: Effect of ribbon width, edge roughness, and hydrogen termination, Appl. Phys. Lett., 2010, 96, 1–3 CrossRef.
- M. Yamada, Y. Yamakita and K. Ohno, Phonon dispersions of hydrogenated and dehydrogenated carbon nanoribbons, Phys. Rev. B: Condens. Matter Mater. Phys., 2008, 77, 1–13 Search PubMed.
- H. Cao, Z. Guo, H. Xiang and X. Gong, Layer and size dependence of thermal conductivity in multilayer graphene nanoribbons, Phys. Lett. A, 2011, 376, 525–528 CrossRef.
- Y. Sonvane, S. K. Gupta, P. Raval, I. Lukacevic and P. B. Thakor, Length, width and roughness dependent thermal conductivity of graphene nanoribbons, Chem. Phys. Lett., 2015, 634, 16–19 CrossRef.
| This journal is © The Royal Society of Chemistry 2018 |

