 Open Access Article
Simultaneous improvement in electrical conductivity and Seebeck coefficient of PEDOT:PSS by N2 pressure-induced nitric acid treatment†
May Thu Zar Myint a,
Masaki Hadaa,
Hirotaka Inoue
 a,
Tatsuki Maruia,
Takeshi Nishikawaa,
Yuta Nishina
 a,
Susumu Ichimurab,
Masayoshi Umenoc,
Aung Ko Ko Kyaw
 *de and
Yasuhiko Hayashi
 *a
*a
aGraduate School of Natural Science and Technology, Okayama University, 3-1-1 Tsushima-naka, Kita, Okayama, 700-8530, Japan. E-mail: hayashi.yasuhiko@okayama-u.ac.jp
bNagoya Industries Promotion Corporation, 3-4-41 Rokuban, Atsuta, Nagoya, 456-0058, Japan
cC's Techno. Inc., Anagahora, Shimoshidami, Moriyama, Nagoya, 463-0003, Japan
dDepartment of Electrical and Electronic Engineering, Southern University of Science and Technology, Shenzhen 518055, P. R. China. E-mail: aung@sustc.edu.cn
eShenzhen Planck Innovation Technologies Pte Ltd, Ganli 6th Road, Longgang, Shenzhen, 518112 China
First published on 30th October 2018
Abstract
As a thermoelectric (TE) material suited to applications for recycling waste-heat into electricity through the Seebeck effect, poly(3,4-ethylenedioxythiophene):poly(4-styrenesulfonic acid) (PEDOT:PSS) is of great interest. Our research demonstrates a comprehensive study of different post-treatment methods with nitric acid (HNO3) to enhance the thermoelectric properties of PEDOT:PSS. The optimum conditions are obtained when PEDOT:PSS is treated with HNO3 for 10 min at room temperature followed by passing nitrogen gas (N2) with a pressure of 0.2 MPa. Upon this treatment, PEDOT:PSS changes from semiconductor-like behaviour to metal-like behaviour, with a simultaneous enhancement in the electrical conductivity and Seebeck coefficient at elevated temperature, resulting in an increase in the thermoelectric power factor from 0.0818 to 94.3 μW m−1 K−2 at 150 °C. The improvement in the TE properties is ascribed to the combined effects of phase segregation and conformational change of the PEDOT due to the weakened coulombic attraction between PEDOT and PSS chains by nitric acid as well as the pressure of the N2 gas as a mechanical means.
1. Introduction
The demand for new energy conversion materials has been rapidly increasing owing to the gradual depletion of fossil fuels and significant industrialization. Thermoelectric materials, which can directly convert waste heat into electricity, and vice versa, have become promising candidates.1,2 Traditional thermoelectric materials are primarily based on inorganic bulk materials such as SiGe, PbTe, Bi2Te3 and metal oxide; however, these inorganic materials have challenges such as high cost, limited processability, toxicity and lack of abundance.3–6 Moreover, these commercially available inorganic thermoelectric materials are not suitable for the recovery of low-temperature waste heat because they operate efficiently only at high temperatures. Nevertheless, a large amount of waste heat in our surroundings is below 200 °C. Therefore, organic thermoelectric materials which can provide high performance at low temperature have gained increasing interest in recovering the huge amount of low temperature waste heat.7,8Recently, among the conducting polymers, many research groups have focused on poly(3,4-ethylenedioxythiophene):(poly styrenesulfonate) (PEDOT:PSS) due to its stability, processability, flexibility, high conductivity and transparency.9–12 However, there are numerous restrictions for this material to overcome before broad application in thermoelectric devices, i.e. both the electrical conductivity and the Seebeck coefficient of PEDOT:PSS need further improvement to accomplish high thermoelectric properties.13
The thermoelectric performance is determined by the figure of merit, ZT = S2σT/κ, where S, σ, T and κ are the Seebeck coefficient, electrical conductivity, the absolute temperature and thermal conductivity, respectively.14–16 The Seebeck coefficient can be calculated by dividing the induced voltage difference (ΔV) by the corresponding temperature gradient (ΔT) across the thermoelectric material. The figure of merit (ZT) is related to the thermoelectric performance called power factor (PF = S2σ) and it can be used as an alternative to ZT when the thermal conductivity of the material is significantly low.17–19 According to the definition of ZT, high electrical conductivity or high Seebeck coefficient give high ZT value. Alternatively, low thermal conductivity makes it possible to obtain high ZT.20–23 In general, high carrier concentration and/or high carrier mobility enables to obtain high electrical conductivity. But a high carrier concentration tends to decrease the Seebeck coefficient.10,24,25 The existence of a large amount of non-ionized dopants can considerably decrease the carrier mobility as well as the Seebeck coefficient and hence reduce the thermoelectric power factor. Despite the fact that secondary doping can significantly increase carrier mobility without altering the carrier concentration or doping state, it is still challenging to simultaneously improve the electrical conductivity and Seebeck coefficient.26,27 Deng et al. reported that the electrical conductivity improved significantly by post-treatment with a co-solvent of ethylene glycol (EG) and dimethyl sulfoxide (DMSO) at different ratios. Meanwhile, there was no significant change in Seebeck coefficient except for the ratio of EG to DMSO as 0–10.28 Organic polar solvents such as DMSO, EG and dimethyl formamide (DMF) can improve the thermoelectric properties of PEDOT:PSS films as secondary dopants. Yu et al. showed significant improvement of the thermoelectric properties in PEDOT:PSS through post-treatment with organic solutions of inorganic salts. The reported electrical conductivity was found to be 1400 S cm−1 with a corresponding power factor of 98.2 μW m−1 K−2. The improvement of the thermoelectric properties was due to the synergetic effects of the inorganic salts and the DMF solution.2 Pipe et al. reported that doping with DMSO and dedoping of non-complex PSS ions with EG to PEDOT:PSS films gave a ZT value of 0.42.26 Lee et al. reported that EG treated nanocomposite films with 20 wt% CNTs showed a power factor of 151 ± 34 μW m−1 K−2 due to the removal of extra PSS ions, resulting in a decrease in inter-bundle distances within the nanocomposite. The power factor improvement was mainly due to an improvement of the electrical conductivity, however, the Seebeck coefficient decreased after EG treatment.15 Kyaw et al. reported that the sequential post-treatment of PEDOT:PSS with DMF increased the electrical conductivity as high as 2929 S cm−1 resulting in a power factor as high as 88.7 μW m−1 K−2 not only due to the phase segregation of PEDOT and PSS but also the removal of insulating PSS.29 In addition to polar solvents, the treatment of PEDOT:PSS with acids can also improve the thermoelectric properties, especially the electrical conductivity. Fan et al. reported an optimum power factor of 196.7 μW m−1 K−2 through sequential post-treatment with sulfuric acid and sodium hydroxide.30
In this article, we report a facile and cost-effective approach to simultaneously improve the electrical conductivity and Seebeck coefficient of PEDOT:PSS films via N2 pressure-induced treatment with HNO3. The conformational change of PEDOT and the removal of excess insulating PSS by the combined effects of the nitric acid treatment and passing of N2 gas significantly enhanced the electrical conductivity from <1 S cm−1 to 2693 S cm−1 at room temperature with a pressure of 0.2 MPa. For a comparative study, the PEDOT:PSS film was treated using the same procedure with HNO3, and then dried in a vacuum chamber or by immersion in deionized (DI) water to remove insulating PSS. In this case, the optimum electrical conductivity measured at room temperature was 2018 S cm−1 and 988 S cm−1 for the samples dried by vacuum and washed with DI water, respectively. Therefore, the improvement in thermoelectric properties is not only due to the effect of the acid but also the pressure of the N2 gas. To the best of our knowledge, this is the first demonstration of the effects of pressure on the thermoelectric properties of the treated PEDOT:PSS film. Furthermore, many research groups have reported on the room temperature thermoelectric properties of acid treated PEDOT:PSS films, however, reports on the thermoelectric properties of PEDOT:PSS film over a wide temperature range are very rare.31 For this reason, it is worth studying the performance of nitric acid treated PEDOT:PSS films at an elevated temperature in order to broaden the applications of acid treated PEDOT:PSS films.
2. Experimental section
2.1. Materials and methods
PEDOT:PSS (Clevios PH 1000) was purchased from Heraeus, Germany. Nitric acid (HNO3, 69%) was purchased from Wako Pure Chemical Industries, Ltd. (Japan). All chemicals in this study were used directly without further purification.2.2. Preparation and treatment of PEDOT:PSS films with HNO3
The glass substrates were cleaned with deionized water, ethanol and acetone, and then put in a UV ozone cleaner (Filgen) for 20 min to facilitate a better film formation. PEDOT:PSS (100 μl) was spin-coated onto the glass substrate and dried at 50 °C for 30 min. The treatment of PEDOT:PSS films with HNO3 was done according to the following methods.Treatment 1: HNO3 (100 μl) was poured onto the PEDOT:PSS film at room temperature and kept for 10 min followed by passing N2 gas32 with various pressures using a gun. The distance between the tip of the gun and the sample was fixed at 20 mm.
Treatment 2: HNO3 (100 μl) was poured onto the PEDOT:PSS film at room temperature and kept for 10 min, then dried in the vacuum chamber for 24 h.
Treatment 3: HNO3 (100 μl) was poured onto the PEDOT:PSS film at room temperature and kept for 10 min, then dried at 50 °C for 30 min. The samples were washed with DI water followed by drying at 100 °C for 15 min and cooled down to room temperature.
2.3. Measurement of thermoelectric properties and characterization
The Seebeck coefficient, electrical conductivity and power factor of the PEDOT:PSS films were measured by ZEM-3M8 ULVAC Seebeck Coefficient Measurement System (ADVANCED RIKO, Inc.) with thin film measurement attachment in a helium environment. Before the ZEM-3 measurement, a DektakXT profilometer was used to measure the average thickness of the films. The samples were then cut into 4 mm × 16 mm size for the measurement of thermoelectric properties.Hall measurements (Lake Shore Model 8403, AC/DC Hall effect measurement system) were conducted to investigate the carrier concentration and carrier mobility. X-ray photoelectron spectroscopy (XPS, JEOL JPS 9030, Tokyo, Japan) was performed to analyze the change in composition of the PEDOT:PSS before and after treatment. UV-Vis (JASCO V-670 Spectrophotometer) absorption bands were recorded to analyse the neutral, polaron and bipolaron states of the PEDOT. The morphology and surface roughness was characterized by Scanning Probe Microscopy (SPM, Nano Navi SII). The contact angle was measured with a DropMaster DMe-211 to characterize the surface wettability of the films. X-ray diffraction measurement (XRD) was performed with a RIGAKU SmartLab X-ray diffractometer with CuKα radiation (λ = 0.15418 nm), at a scanning rate of 1 degree per minute, to investigate the change in crystallinity of PEDOT:PSS films before and after HNO3 treatment. Raman spectroscopy (JASCO, NRS450 NMDS) with a wavelength of 532.21 nm (green laser) was used to analyse the conformational change of the PEDOT chains after treatment. Cyclic voltammetry (CVs, Princeton Applied Research VERSA STAT 4-100) was used to characterize the electrochemical activity of the PEDOT:PSS before and after treatment.
3. Results and discussion
3.1. Thermoelectric properties
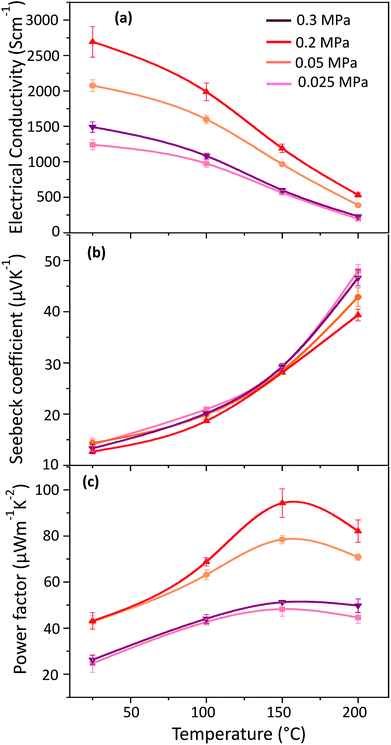
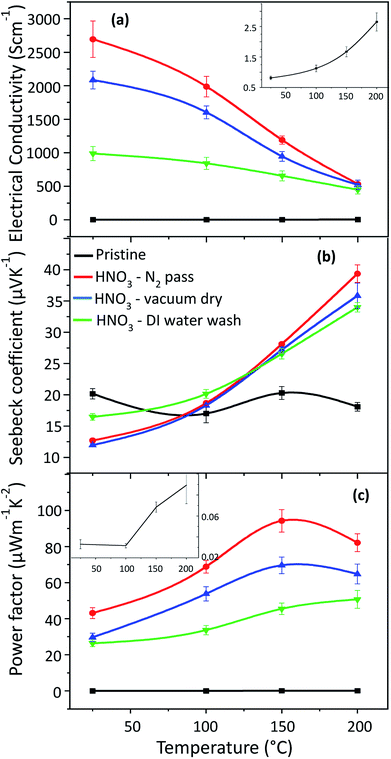
The electrical conductivity, Seebeck coefficient and power factor of the HNO3 treated PEDOT:PSS films followed by passing N2 gas at different pressures of 0.025 MPa, 0.05 MPa, 0.2 MPa and 0.3 MPa are shown in Fig. 1. The electrical conductivity increases when the pressure is increased from 0.025 MPa to 0.2 MPa, and the highest electrical conductivity (2693 S cm−1 at 25 °C) is attained at a pressure of 0.2 MPa. The electrical conductivity, however, decreases at a pressure of 0.3 MPa, probably due to the damage of the film, but this is still not clear. Moreover, the Seebeck coefficient is the lowest at a pressure of 0.2 MPa. Despite this, the Seebeck coefficient increases at an elevated temperature and hence the treated film shows a higher Seebeck coefficient than the pristine film. An optimum power factor of 94.3 μW m−1 K−2 was obtained at 150 °C, but it decreases again at 200 °C (Fig. 1(c)) due to the decrease in electrical conductivity.The PEDOT:PSS films were also treated with HNO3 at different conditions in order to ensure the synergetic effects of HNO3 and the pressure of N2 gas on the thermoelectric properties of PEDOT:PSS. The electrical conductivity, Seebeck coefficient and power factor of the PEDOT:PSS films, before and after different treatments, are shown in Fig. 2. In Fig. 2(b), the Seebeck coefficient of pristine PEDOT:PSS film does not change significantly in the temperature range between 25 °C and 200 °C. Meanwhile, the electrical conductivity of the pristine PEDOT:PSS film increases from 0.8 S cm−1 at room temperature to 3.5 S cm−1 at 200 °C, indicating the semiconducting behaviour. After treatment, in contrast to the pristine film, the electrical conductivity decreases with increasing temperature while the Seebeck coefficient increases with increasing temperature, exhibiting metallic or semi-metallic behaviour of the PEDOT:PSS films.
The post treatment of PEDOT:PSS films with HNO3 for 10 min followed by passing N2 gas gives the highest electrical conductivity (2693 S cm−1 at 25 °C), whereas films with the same treatment followed by vacuum drying give an electrical conductivity of only 2018 S cm−1. When the films were treated with HNO3 at 25 °C for 10 min followed by rinsing with DI water, the resulting electrical conductivity was only 988 S cm−1, which is the lowest among the different treatment conditions. During acid treatment, HNO3 causes the protonation of PSS resulting in the formation of PSSH, which can be easily phase-segregated from PEDOT due to a weak coulombic interaction. The reaction can be expressed as follows:
| HNO3 + PSS− → NO3− + PSSH | (1) |
The conformational change of the PEDOT chain occurs not only due to the phase segregation of PSSH but also the pressure of the N2 gas. A better film condition was also obtained without wrinkling or peeling off after passing N2 gas. Therefore, we observe that N2 pressure influences the phase segregation as well as the conformational change of the PEDOT chain and hence improves the mobility, resulting in an increase in the electrical conductivity.32 In order to confirm this, Hall effect measurements were conducted. The carrier concentration of pristine PEDOT:PSS is around an order of 17 cm−3 and the mobility is <1 cm2 V−1 s−1 as in previous reports.27,32,39,40 The carrier concentration from Hall effect measurements are 2.5 × 1021 cm−3 for the sample with passing of N2 gas, 2.1 × 1021 cm−3 for the vacuum dried sample and 1.5 × 1021 cm−3 for the DI water washed sample; the pristine PEDOT:PSS films could not be measured. The carrier mobility of N2 gas passed sample is 6.7 cm2 V−1 s−1, that of vacuum dried and DI water washed samples are 5.8 cm2 V−1 s−1 and 4.2 cm2 V−1 s−1, respectively. The carrier concentration and the carrier mobility values obtained for the sample passed with N2 gas are the highest amongst all the treatment conditions. This may be due to the effect of the N2 gas pressure, which leads to better phase separation between the PEDOT and PSS, giving a higher chance for the PEDOT chain to be linearly reoriented.
3.2. Characterization of the improved thermoelectric properties of the PEDOT:PSS films
The influence of HNO3 treatment on the removal of extra PSS was confirmed by XPS analysis as shown in Fig. 3(a). The photoelectron peaks, which consist of the doublet S 2p1/2 and S 2p3/2 observed at 168.6 eV and 167.7 eV, originate from the sulphur atoms of the sulfonate group in PSS and is shown in Fig. S-1(a) (ESI†). After treatment with HNO3, the S 2p peak of PSS shifts about 0.8 eV to a lower binding energy, and the PSS peak intensity decreases significantly after HNO3 treatment.27 The lowest intensity of PSS was observed after HNO3 treatment followed by passing N2 gas, indicating that HNO3 treatment followed by passing N2 gas can remove PSS more effectively than other treatments. Removing insulating PSS from the PEDOT:PSS film generally results in an increase in electrical conductivity, which agrees well with the conductivity measurement of the samples. The O 1s peak at a binding energy of 532.4 eV corresponds to an oxygen atom in the PEDOT unit, while the 531.5 eV peak corresponds to the oxygen atom attached to the sulphur atom with a double bond (O![[double bond, length as m-dash]](https://www.rsc.org/images/entities/char_e001.gif) S
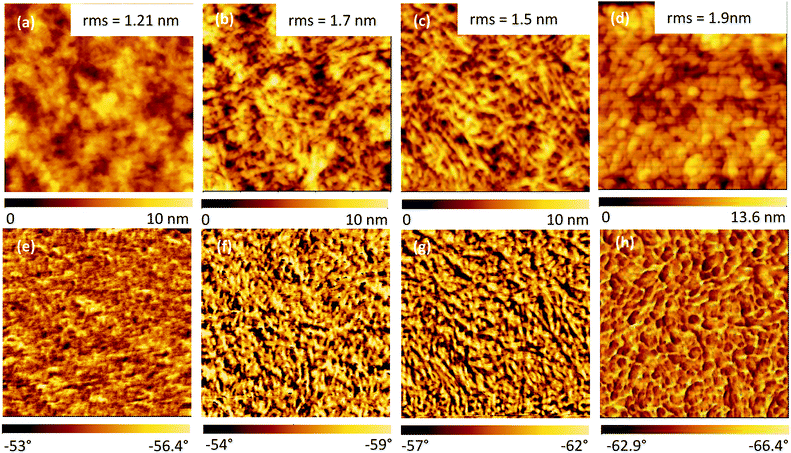
S![[double bond, length as m-dash]](https://www.rsc.org/images/entities/char_e001.gif) O) in PSSH (Fig. S-1(b), ESI†). The peak at 531.5 eV shifts about 0.4 eV to a lower binding energy and the intensity decreases, while the peak at 532.4 eV shifts 0.4 eV to a higher binding energy and the intensity increases. This indicates the formation of PSSH which segregates from the PEDOT:PSS chains.31 The peaks at 285.7 eV and 284 eV in the C 1s spectra (Fig. S-1(c), ESI†) are associated with C–O bonds in PEDOT and C–C bonds in PEDOT:PSS. The peak intensity of the C–C bond in PEDOT:PSS decreases while that of the C–O bonds in PEDOT increases after HNO3 treatment, which is consistent with previous reports.33 In order to confirm the PSS removal observed by XPS results, UV-Vis absorption analysis was performed and the results are shown in Fig. 3(b). The absorption bands at 195.7 nm and 225.7 nm come from the PSS moiety. Hence, the decrease in the intensities of these two bands after HNO3 treatment can be attributed to the removal of PSS from PEDOT:PSS, resulting in an enhancement of the electrical conductivity.29,32,34 The intensities of the two bands are the lowest in the sample with HNO3 treatment followed by passing N2 gas. This indicates that the HNO3 treatment followed by passing N2 gas is more effective than the other methods for the removal of PSS. In order to confirm the segregation of PSS rich domains from PEDOT:PSS, the surface morphology of the PEDOT:PSS films was analysed by SPM. SPM Images are scanned three times for each sample. The pristine PEDOT:PSS film demonstrates a very smooth surface with a root mean square (rms) roughness of 1.21 nm, as shown in Fig. 4(a). After the treatment, the films become rougher and the rms roughness increases to 1.7 nm, 1.5 nm and 1.9 nm, for the films processed by passing N2 gas, vacuum drying and DI water washing, respectively (Fig. 4(b–d)). Interestingly, the roughness of the films processed by passing N2 gas is lower than that of films washed with DI water. It may be ascribed to the pressure of the N2 gas, which makes the films become smoother. In addition, nanosized fibrous structures are observed after the treatments as shown in the phase images of the films (Fig. 4(f–h)). An increase in rms roughness and the formation of fibrous structures are evidence of the phase segregation between PEDOT-rich domains and PSS-rich domains, in addition to the removal of the non-complexed PSS.2,27,32 SPM results are also consistent with the XRD results as indicated in Fig. 5. The pristine PEDOT:PSS film shows two diffraction peaks at 18.1° and 25.8°, which originate from the amorphous halo inter-chain stacking of PSS and that of PEDOT. After treatment with HNO3, new peaks appear at 6.9° and 12.01°, which correspond to the lamellar stacking of PEDOT and PSS, respectively.30,32,33 The interplanar d-spacings and grain sizes of the samples (Table 2, ESI†) are calculated using the Bragg's law and the Scherrer equation. The grain sizes at 6.9° and 13.2° are 5.04 nm and 5.07 nm, respectively, after treatment with HNO3 followed by passing N2 gas. This is the largest grain size in comparison with the other treatments, indicating a higher crystallinity due to the removal of the amorphous phase PSS. Contact angle measurements (Fig. S-2 and Table 3, ESI†) were also performed to confirm the removal of the amorphous phase PSS. The pristine PEDOT:PSS film shows a contact angle of 35.2° within 5 s and decreases very quickly to 18.5° within 65 s, demonstrating the hydrophilic nature of PSS. After treatment with HNO3 followed by passing N2 gas, the contact angle becomes 63° within 5 s and 60.5° within 65 s, indicating the hydrophobic nature.
O) in PSSH (Fig. S-1(b), ESI†). The peak at 531.5 eV shifts about 0.4 eV to a lower binding energy and the intensity decreases, while the peak at 532.4 eV shifts 0.4 eV to a higher binding energy and the intensity increases. This indicates the formation of PSSH which segregates from the PEDOT:PSS chains.31 The peaks at 285.7 eV and 284 eV in the C 1s spectra (Fig. S-1(c), ESI†) are associated with C–O bonds in PEDOT and C–C bonds in PEDOT:PSS. The peak intensity of the C–C bond in PEDOT:PSS decreases while that of the C–O bonds in PEDOT increases after HNO3 treatment, which is consistent with previous reports.33 In order to confirm the PSS removal observed by XPS results, UV-Vis absorption analysis was performed and the results are shown in Fig. 3(b). The absorption bands at 195.7 nm and 225.7 nm come from the PSS moiety. Hence, the decrease in the intensities of these two bands after HNO3 treatment can be attributed to the removal of PSS from PEDOT:PSS, resulting in an enhancement of the electrical conductivity.29,32,34 The intensities of the two bands are the lowest in the sample with HNO3 treatment followed by passing N2 gas. This indicates that the HNO3 treatment followed by passing N2 gas is more effective than the other methods for the removal of PSS. In order to confirm the segregation of PSS rich domains from PEDOT:PSS, the surface morphology of the PEDOT:PSS films was analysed by SPM. SPM Images are scanned three times for each sample. The pristine PEDOT:PSS film demonstrates a very smooth surface with a root mean square (rms) roughness of 1.21 nm, as shown in Fig. 4(a). After the treatment, the films become rougher and the rms roughness increases to 1.7 nm, 1.5 nm and 1.9 nm, for the films processed by passing N2 gas, vacuum drying and DI water washing, respectively (Fig. 4(b–d)). Interestingly, the roughness of the films processed by passing N2 gas is lower than that of films washed with DI water. It may be ascribed to the pressure of the N2 gas, which makes the films become smoother. In addition, nanosized fibrous structures are observed after the treatments as shown in the phase images of the films (Fig. 4(f–h)). An increase in rms roughness and the formation of fibrous structures are evidence of the phase segregation between PEDOT-rich domains and PSS-rich domains, in addition to the removal of the non-complexed PSS.2,27,32 SPM results are also consistent with the XRD results as indicated in Fig. 5. The pristine PEDOT:PSS film shows two diffraction peaks at 18.1° and 25.8°, which originate from the amorphous halo inter-chain stacking of PSS and that of PEDOT. After treatment with HNO3, new peaks appear at 6.9° and 12.01°, which correspond to the lamellar stacking of PEDOT and PSS, respectively.30,32,33 The interplanar d-spacings and grain sizes of the samples (Table 2, ESI†) are calculated using the Bragg's law and the Scherrer equation. The grain sizes at 6.9° and 13.2° are 5.04 nm and 5.07 nm, respectively, after treatment with HNO3 followed by passing N2 gas. This is the largest grain size in comparison with the other treatments, indicating a higher crystallinity due to the removal of the amorphous phase PSS. Contact angle measurements (Fig. S-2 and Table 3, ESI†) were also performed to confirm the removal of the amorphous phase PSS. The pristine PEDOT:PSS film shows a contact angle of 35.2° within 5 s and decreases very quickly to 18.5° within 65 s, demonstrating the hydrophilic nature of PSS. After treatment with HNO3 followed by passing N2 gas, the contact angle becomes 63° within 5 s and 60.5° within 65 s, indicating the hydrophobic nature.
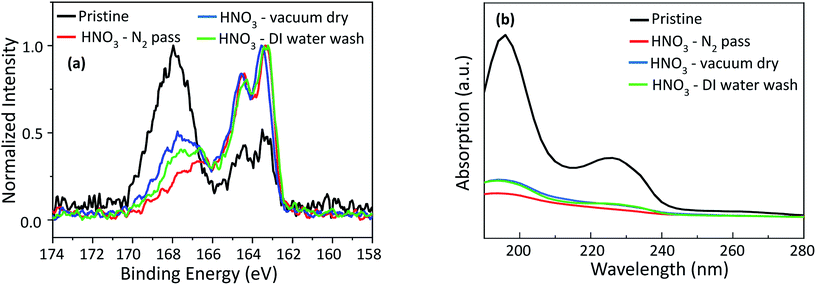 | ||
| Fig. 3 (a) S 2p core-level XPS spectra and (b) UV absorption spectra of the pristine PEDOT:PSS and HNO3 treated PEDOT:PSS at different conditions. | ||
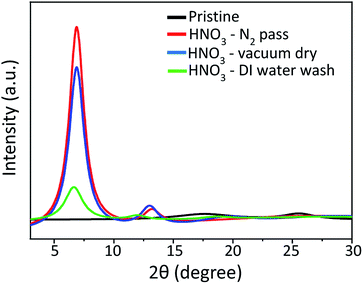 | ||
| Fig. 5 XRD patterns of the pristine PEDOT:PSS film and that of HNO3 treated films at different conditions. | ||
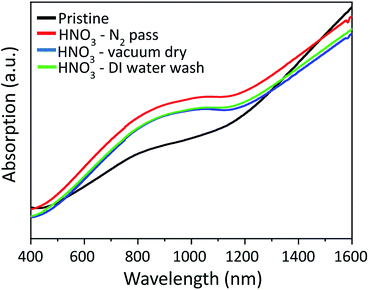
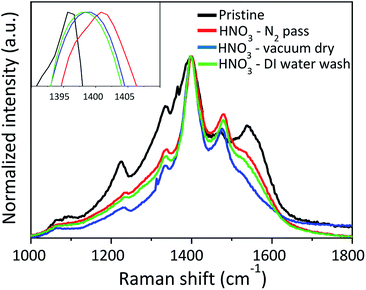
UV-Vis-NIR absorption spectra (Fig. (6)) are also recorded at wavelengths near the infrared region to investigate the influence of HNO3 treatments on the PEDOT:PSS films systematically. The absorption bands around 600 nm, 900 nm and 1200 nm specifically show the neutral, polaron, and bipolarons states of the PEDOT chains, respectively, as previously reported in the literature.27–29 After HNO3 treatment, the absorption intensity at ≈900 nm increases significantly, indicating an increase in its oxidation level to a polaronic metal state.34–37 UV-Vis-NIR measurements are also consistent with the Raman analysis, as illustrated in Fig. 7. Raman spectroscopy is a useful technique to investigate conformational changes in polymers. The peak positions at 1225, 1336, 1396 and 1472 cm−1 show the vibrational mode of Cα–Cα (inter-ring stretching), Cβ–Cβ (stretching), Cα![[double bond, length as m-dash]](https://www.rsc.org/images/entities/char_e001.gif) Cβ (symmetric) and Cα
Cβ (symmetric) and Cα![[double bond, length as m-dash]](https://www.rsc.org/images/entities/char_e001.gif) Cβ (asymmetric), of the PEDOT. The characteristic peak at 1538 cm−1 comes from the vibrational modes of the PSS chains. The peak at 1396 cm−1 in pristine PEDOT:PSS shifts to a higher wavenumber; 1404 cm−1, 1399 cm−1 and 1398 cm−1 after the treatment with HNO3 followed by passing N2 gas, vacuum drying and DI water washing, respectively. This may be due to a conformational change of the PEDOT thiophene rings from a coiled structure (benzoid) to an extended coiled or linear structure (quinoid), resulting in an increase in electrical conductivity.31 The peak shift is more significant for the sample treated with HNO3 followed by passing N2 gas than that of the other samples. Therefore, the pressure of the N2 can partially assist the conformational change of the PEDOT chain. In order to confirm this, Raman spectroscopy was conducted for samples treated at pressures of 0.025 MPa, 0.05 MPa, 0.2 MPa and 0.3 MPa, as provided in Fig. S-3 (ESI†). The Raman peak at 1396 cm−1 in pristine PEDOT:PSS shifts to a higher wave number of 1399 cm−1, 1400 cm−1, 1404 cm−1 and 1409 cm−1 when pressures of 0.025 MPa, 0.05 MPa, 0.2 MPa and 0.3 MPa, respectively, are applied. The shift in the Raman peak clearly indicates the conformational change of PEDOT:PSS due to the pressure of N2 gas. PEDOT:PSS films were characterized by CV as the removal of PSS can affect the electrochemical activity of the PEDOT chains. Cyclic voltammograms (CVs) of pristine PEDOT:PSS and HNO3 treated PEDOT:PSS films at different conditions are shown in Fig. 8. The electrochemical activity of pristine PEDOT:PSS was detected in the potential range from −0.1 to 0.4 V vs. Ag/AgCl. Additional electrochemical activity was detected below −0.1 V vs. Ag/AgCl after treatment with HNO3 at different conditions. As conjugated PEDOT chains are surrounded by insulating PSS, the PSS may hamper charge transfer between the working electrode and PEDOT chains.38 After the treatment with HNO3, the removal of insulating PSS results in an increase in electrochemical activity of the PEDOT chains. In addition, HNO3 treated sample followed by passing N2 gas results in an enlargement of the area for electrochemical activity among the different treatment conditions. This can be attributed to the pressure triggered by passing N2 gas that can assist the removal of excess insulating PSS, which has a weak coulombic attraction with PEDOT during the HNO3 treatment.
Cβ (asymmetric), of the PEDOT. The characteristic peak at 1538 cm−1 comes from the vibrational modes of the PSS chains. The peak at 1396 cm−1 in pristine PEDOT:PSS shifts to a higher wavenumber; 1404 cm−1, 1399 cm−1 and 1398 cm−1 after the treatment with HNO3 followed by passing N2 gas, vacuum drying and DI water washing, respectively. This may be due to a conformational change of the PEDOT thiophene rings from a coiled structure (benzoid) to an extended coiled or linear structure (quinoid), resulting in an increase in electrical conductivity.31 The peak shift is more significant for the sample treated with HNO3 followed by passing N2 gas than that of the other samples. Therefore, the pressure of the N2 can partially assist the conformational change of the PEDOT chain. In order to confirm this, Raman spectroscopy was conducted for samples treated at pressures of 0.025 MPa, 0.05 MPa, 0.2 MPa and 0.3 MPa, as provided in Fig. S-3 (ESI†). The Raman peak at 1396 cm−1 in pristine PEDOT:PSS shifts to a higher wave number of 1399 cm−1, 1400 cm−1, 1404 cm−1 and 1409 cm−1 when pressures of 0.025 MPa, 0.05 MPa, 0.2 MPa and 0.3 MPa, respectively, are applied. The shift in the Raman peak clearly indicates the conformational change of PEDOT:PSS due to the pressure of N2 gas. PEDOT:PSS films were characterized by CV as the removal of PSS can affect the electrochemical activity of the PEDOT chains. Cyclic voltammograms (CVs) of pristine PEDOT:PSS and HNO3 treated PEDOT:PSS films at different conditions are shown in Fig. 8. The electrochemical activity of pristine PEDOT:PSS was detected in the potential range from −0.1 to 0.4 V vs. Ag/AgCl. Additional electrochemical activity was detected below −0.1 V vs. Ag/AgCl after treatment with HNO3 at different conditions. As conjugated PEDOT chains are surrounded by insulating PSS, the PSS may hamper charge transfer between the working electrode and PEDOT chains.38 After the treatment with HNO3, the removal of insulating PSS results in an increase in electrochemical activity of the PEDOT chains. In addition, HNO3 treated sample followed by passing N2 gas results in an enlargement of the area for electrochemical activity among the different treatment conditions. This can be attributed to the pressure triggered by passing N2 gas that can assist the removal of excess insulating PSS, which has a weak coulombic attraction with PEDOT during the HNO3 treatment.
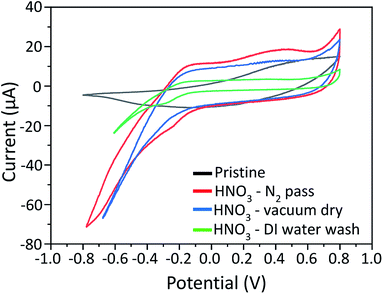 | ||
| Fig. 8 Cyclic voltammograms (CVs) of pristine PEDOT:PSS and HNO3 treated PEDOT:PSS films at different conditions in 0.1 M NaCl solution. | ||
Based on the various characterizations, we attribute the simultaneous increase in electrical conductivity and Seebeck coefficient at an elevated temperature to the following reasons; the N2 pressure-induced HNO3 treatment effectively segregates PEDOT from PSS and removes PSS, resulting in conformational changes and in turn an increase in mobility. Concurrently, the treatment also increases the oxidization and doping states of the PEDOT film, which is evident from the Vis-NIR absorption spectrum. An increase in doping also agrees well with an increase in carrier concentration, which is characterized by Hall measurements. Both mobility and doping enhance the electrical conductivity, according to the relationship σ = 1/qμn, where σ, q, μ and n are electrical conductivity, elementary charge, mobility and carrier concentration (doping states), respectively. The significant improvement in electrical conductivity suggests that the semiconducting polymer is transformed into a (semi)metallic one, which is also evident from the temperature dependent electrical conductivity measurement. However, an increase in doping after the treatment also results in a decrease in the Seebeck coefficient at room temperature. Nevertheless, the Seebeck coefficient increases again at higher temperatures due to the (semi)metallic behaviour of the material. Therefore, above 100 °C, the electrical conductivity and Seebeck coefficient increase simultaneously and the optimum power factor is obtained at 150 °C.
4. Conclusion
In summary, nitric acid treatment of PEDOT:PSS films with the aid of passing N2 gas gives the highest electrical conductivity at room temperature, which decreased with increasing measurement temperature, while the Seebeck coefficient increases with increasing measured temperature. The conductivity improvement is due to the increase in polaronic states (doping), the phase segregation of the PSSH from PEDOT, and the removal of insulating PSS resulting in conformational changes of the PEDOT chains. The optimum power factor of 94.3μW m−1 K−2 was obtained at a measured temperature of 150 °C, which then decreased again at 200 °C because of the decrease in electrical conductivity. Electrical conductivity improvement is not only due to the HNO3 treatment but also due to passing N2 gas after treatment. While the coulombic attraction between PEDOT and extra PSS is weaker because of HNO3, the pressure of N2 gas facilitates the removal of such weakly bonded PSS. In addition, the pressure of the N2 gas is also responsible for the conformational change of the PEDOT chain while HNO3 is responsible for the removal of insulating PSS.Conflicts of interest
There are no conflicts to declare.Acknowledgements
We would like to thank ADVANCE RIKO, Inc. (Kanagawa, Japan) for comprehensive help of thermoelectric evaluation. This study was partially supported by the JSPS KAKENHI (Grant Number 17K20065). AKKK would like to thank start-up fund from Thousand Young Talents Program of China and Shenzhen Peacock Team Project (No. KQTD2016030111203005).References
- M. Culebras, A. M. Igual-Munoz and C. Rodriguez-Ferenandez, ACS Appl. Mater. Interfaces, 2017, 9, 20826–20832 CrossRef CAS PubMed.
- Z. Fan, D. Du, Z. Yu, P. Li, Y. Xia and J. Ouyang, ACS Appl. Mater. Interfaces, 2016, 8, 23204–23211 CrossRef CAS PubMed.
- K. Suemori, S. Hoshino and T. Kamata, Appl. Phys. Lett., 2013, 103, 153902 CrossRef.
- C. Gao and G. Chen, Compos. Sci. Technol., 2016, 124, 52–70 CrossRef CAS.
- D. Beretta, A. Perego, G. Lanzani and M. Caironi, Sustainable Energy Fuels, 2017, 1, 174 RSC.
- O. Bubnova, Z. U. Khan, A. Malti, S. Braun, M. Fahlman, M. Berggren and X. Crispin, Nat. Mater., 2011, 10(6), 429–433 CrossRef CAS PubMed.
- D. Yoo, J. Kim, S. H. Lee, W. Cho, H. H. Choi, F. S. Kim and J. H. Kim, J. Mater. Chem. A, 2015, 3, 6526–6533 RSC.
- X. Sun, Y. Wei, J. Li, J. Zhao, L. Zhao and Q. Li, Sci. China Mater., 2017, 60(2), 159–166 CrossRef CAS.
- Q. Wei, M. Mukaida, K. Kirihara, Y. Naitoh and T. Ishida, Material, 2015, 8, 732–750 CrossRef CAS PubMed.
- Q. Jiang, C. Liu, H. Song, H. Shi, Y. Yao, J. Xu, G. Zhang and B. Lu, J. Mater. Sci.: Mater. Electron., 2013, 24, 4240–4246 CrossRef CAS.
- M. A. Kamarudin, S. R. Sahamir, R. S. Datta, B. D. Long, M. F. M. Sabri and S. M. Said, Sci. World J., 2013, 13, 713640 Search PubMed.
- W. Zhou, Q. Fan, Q. Zhang, K. Li, L. Cai, X. Gu, F. Yang, N. Zhang, Z. Xiao, H. Chen, S. Xiao, Y. Wang, H. Liu, W. Zhou and S. Xie, small, 2016, 12(25), 3407–3414 CrossRef CAS PubMed.
- S. Na-Ri, C. Sul-Hwa and K. Jin-Yeol, Synth. Met., 2014, 192, 23–28 CrossRef.
- X. Bai, X. Hu, S. Zhou, J. Yan, C. Sun, P. Chen and L. Li, Electrochim. Acta, 2013, 87, 394–400 CrossRef CAS.
- W. Lee, Y. H. Kang, J. Y. Lee, J. Kwang-Suk and S. Y. Cho, RSC Adv., 2016, 6, 53339 RSC.
- Y. Dong-Jin, J. Yong Jin, R. Hyemin, K. Jung-Min, P. Jong Hwan, P. SungHoon, A. Tae Kyu, S. Minsu, P. Chan Eon, J. Jaeyoung and C. Dae Sung, J. Phys. Chem. C, 2016, 120, 10919–10926 CrossRef.
- M. Ibanez, Z. Luo, A. Genc, L. Piveteau, S. Ortega, D. Cadavid, O. Dobrozhan, Y. Liu, M. Nachtegaal, M. Zebarjadi, J. Arbiol, M. V. Kovalenko and A. Cabot, Nat. Commun., 2016, 7, 10766 CrossRef CAS PubMed.
- K. Hee Seok, L. Weishu and R. Zhifeng, Energy Environ. Sci., 2017, 10, 69–85 RSC.
- L. Hye Jeong, G. Anoop, L. Hyeon Jun, K. Chingu, P. Ji-Woong, C. Jaeyoo, K. Heesuk, K. Yong-Jae, L. Eunji, L. Sang-Gil, K. Young-Min, L. Joo-Hyoung and J. Ji Young, Energy Environ. Sci., 2016, 9, 2806–2811 RSC.
- S. M. Said, S. M. Rahman, B. D. Long and M. F. M. Sabri, WIT Trans. Ecol. Environ., 2015, 186, 251–258 Search PubMed.
- D. Olaya, M. Hurtado-Morales, D. Gomez, O. A. Castaneda-Uribe, J. Zhen-Yu and Y. Hernansez, 2D Mater, 2017, 5, 011004 CrossRef.
- E. P. Tomlinson, S. Mukherjee and B. n. W. Boudouris, Org. Electron., 2017, 51, 243–248 CrossRef CAS.
- B. Liu, T. Lu, B. Wang, J. Liu, T. Nakayama, J. Zhou and B. Li, Appl. Phys. Lett., 2017, 110, 113102 CrossRef.
- L. M. Cowen, J. Atoyo, M. J. Carnie, D. Baran and B. C. Schroeder, ECS J. Solid State Sci. Technol., 2017, 6(3), N3080–N3088 CrossRef CAS.
- K. Jaeyun, J. Jae Gyu, H. Jong-, K. Sung Hyun and K. Jeonhun, J. Mater. Sci.: Mater. Electron., 2016, 27, 6122–6127 CrossRef.
- G.-H. Kim, L. Shao, K. Zhang and K. P. Pipe, Nat. Mater., 2013, 12, 719–723 CrossRef CAS PubMed.
- D. A. Mengistie, C. H. Chen, K. M. Boopathi, F. W. Pranoto, L. J. Li and C. W. Chu, ACS Appl. Mater. Interfaces, 2015, 7, 94 CrossRef CAS PubMed.
- S. Liu, H. Deng, Y. Zhao, S. Ren and Q. Fu, RSC Adv., 2015, 5, 1910 RSC.
- A. K. K. Kyaw, T. A. Yemata, X. Wang, S. L. Lim, W. S. Chin, K. Hippalgaonkar and J. Xu, Macromol. Mater. Eng., 2017, 1700429 Search PubMed.
- Z. Fan, P. Li, D. Du and J. Ouyang, Adv. Energy Mater., 2017, 7(8), 1602116 CrossRef.
- S. R. Sarath Kumar, K. Narendra and H. N. Alshareef, J. Mater. Chem. C, 2016, 4, 215 RSC.
- C. Yeon, S. J. Yun, J. Kim and J. W. Lim, Adv. Electron. Mater., 2015, 1, 1500121 CrossRef.
- H. J. Oh, J. G. Jang, J.-G. Kim, J.-I. Hong, J. Kim, J. Kwak, S. H. Kim and S. Shin, Sci. Rep., 2017, 7, 13287 CrossRef PubMed.
- H. Park, S. H. Lee, F. S. Kim, H. H. Choi, I. W. Cheong and J. H. Kim, J. Mater. Chem. A, 2014, 2, 6532 RSC.
- R. Gangopadhyay, B. Das and M. R. Molla, RSC Adv., 2014, 4, 43912–43920 RSC.
- N. Massonnet, A. Carella, A. de Geyer, J. Faure-Vincent and J.-P. Simonato, Chem. Sci., 2015, 6, 412 RSC.
- O. Bubnova, Z. U. Khan, H. Wang, S. Braun, D. R. Evans, M. Fabretto, P. n Hojati-Talemi, D. Dagnelund, J.-B. Arlin, Y. H. Geerts, S. Desbief, D. W. Breiby, J. W. Andreasen, R. Lazzaroni, W. M. Chen, I. Zozoulenko, M. Fahlman, P. J. Murphy, M. Berggren and X. Crispin, Nat. Mater., 2014, 13, 190–194 CrossRef CAS PubMed.
- Z. Yu, Y. Xia, D. Du and J. Ouyang, ACS Appl. Mater. Interfaces, 2016, 8(18), 11629–11638 CrossRef CAS PubMed.
- X. Wang, A. K. K. Kyaw, C. Yin, F. Wang, Q. Zhu, T. Tang, P. I. Yee and J. Xu, RSC Adv., 2018, 8, 18334 RSC.
- D. A. Mengistie, P.-C. Wang and C.-W. Chu, J. Mater. Chem. A, 2013, 1, 9907 RSC.
Footnote |
| † Electronic supplementary information (ESI) available: Deconvoluted XPS spectra of S 2p, O 1s and C 1s, interplanar spacing and grain size, and contact angle measurements. See DOI: 10.1039/c8ra06094k |
| This journal is © The Royal Society of Chemistry 2018 |

