 Open Access Article
The first morphologically controlled synthesis of a nanocomposite of graphene oxide with cobalt tin oxide nanoparticles
Saba Jamila,
Hasnaat Ahmada,
Shafiq-ur-Rehmana,
Shanza Rauf Khana and
Muhammad Ramzan Saeed Ashraf Janjua *bcd
*bcd
aSuper Light Materials and Nanotechnology Laboratory, Department of Chemistry, University of Agriculture, Faisalabad 38000, Pakistan
bDepartment of Chemistry, King Fahd University of Petroleum and Minerals (KFUPM), Dhahran 31261, Kingdom of Saudi Arabia. E-mail: Janjua@kfupm.edu.sa; Dr_Janjua2010@yahoo.com; Tel: +966 55 044 2019 Tel: +92 300 660 4948
cCenter of Excellence in Nanotechnology, King Fahd University of Petroleum and Minerals (KFUPM), Dhahran 31261, Saudi Arabia
dDepartment of Chemistry, University of Sargodha, Sargodha 40100, Pakistan. E-mail: ramzan.saeed@uos.edu.pk
First published on 30th October 2018
Abstract
In the present research, the degradation and decolorization of Reactive Black 5 synthetic dye at 30 ppm concentration under sun irradiation in the presence of a newly synthesized graphene based cobalt tin oxide nanocomposite were investigated. These nanoparticles were synthesized by a simple hydrothermal approach using precursor chloride salt i.e., stannous chloride and cobalt chloride and then adsorbed on the surface of RGO by a solvothermal process by changing the condition. The newly synthesized product was subjected to various instrumentation to study the morphology and other properties. X-ray powder diffraction analysis (XRD) explained the structural composition and various parameters of the product, which were further verified by Vesta software. The surface morphology of the product was analyzed by scanning electron microscopy (SEM) and it was observed that the size of each cube was approximately 5–10 μm from every face of the cube. Transmission electron microscopy (TEM) explained that the nanoparticles were within the range of 100–250 nm. These synthesized nanocubes were used in one more application, which was the investigation of the fuel efficiency in the presence of different concentrations of newly synthesized nanocomposites as a catalyst. The efficiency of kerosene oil was investigated by studying different parameters: the flash point, fire point, specific gravity, cloud point, pour point, and calorific value at increasing dosages of catalyst (0, 30, 60 and 90 ppm). It was observed that the values of these parameters changed significantly by changing the concentration of the catalyst dosage. The effect of the nanoparticles on the degradation of the RB 5 azo dye showed the highest removal percentage at the largest value of catalyst dosage, which was 0.70 mg ml−1 with the highest value of 3 ml of hydrogen peroxide.
Introduction
Nanotechnology has secured a significant role in different fields because of its use in electronics,1 medicines,1 storage devices,2 biomedical applications,3 catalysis4 and drug delivery5 in recent years. Currently, the focus is increasing significantly towards the synthesis of nanocomposites because of their unique fundamental physical and chemical properties and potential applications in different domains.6 In addition, bisphenol A (BPA) is known as a dangerous environmental pollutant and it is mostly used as a raw material in many industries that synthesize polycarbonate and epoxy resins. TiO2, Zn, Bi, Ag and carbon based photocatalysts and their derivatives have been used for the degradation of (BPA) in contaminated industrial wastewater.7 The controlled morphological synthesis of single metal oxides at the nano and micro level by using a hydrothermal bottom-up approach has become a promising method of synthesis.8 The many physical and chemical properties of metal oxide nanoparticles depend on the aspect ratio, crystalline density and stacking number.9 In the case of simple SnO2 nanoparticles, they have been widely used as electrocatalysts,10 photocatalysts11 and fuel additives.12 Similarly, cobalt oxide nanoparticles have been used in the electrochemical detection of hydrogen peroxide,13 gas sensing14 and aerobic oxidation of alcohol in the liquid phase.15 On the basis of these unique properties and the applications of these two metals, many researchers have attempted to achieve a good controlled morphology of CoSn oxide or hydroxide nanoparticles by different methods i.e., by electrostatic spray deposition (ESD),16 a wet sonochemical method17 and a hydrothermal approach.18 A catalyst with nonporous oxygen evolution was prepared by selective electrochemical etching of cobalt hydroxystannate nanoparticles and applied in the oxygen evolution reaction (OER) because of its unique properties of high surface area and high compatibility, when CoSn(OH)6 nanoparticles were calcined at 400 °C, they changed into cobalt tin oxide.19–21Chemically synthesized graphene oxide (GO) is an atomically fine sheet of graphite powder that can be used as a precursor for graphene sheets with its own properties.22 GO has excellent properties that make it an interesting material in advanced future applications in the fields of electronics and photonics,23 solar cells24 and wireless humidity sensing.25 In addition, many dyes are visible in water at concentrations as low as 1 ppm, which is enough to present an aesthetic problem.26 Many research papers are also available in the scientific literature in which bimetallic nanoparticles have been prepared by different methods27–31 and on the basis of their different applications have been reported.32,33 Many scientists have reported graphene based composites with oxides such as BiFeO3, composites with RGO,34 CeO2/graphene nanocomposites35 and TiO2 composites with graphene nanosheets36 but a composite of tin cobalt oxide nanoparticles with graphene oxide for the application of RB 5 dye degradation and as a fuel additive has not been reported earlier, although some scientists have reported this composite with different applications.32,33,37,38–43 The present research has filled this gap in the literature as a C16Co4O16Sn nanocomposite with RGO is reported here with the unique applications of the photocatalytic degradation of the RB 5 azo dye and the investigation of the effect of this newly synthesized nanocomposite on the efficiency of kerosene oil. Azo reactive dyes that contain one to four azo groups in their chemical structure represent one main group of textile dyes, usually attached with two radicals, exceptionally one, but usually both, are aromatic groups. These dyes are chemically stable and difficult to degrade.44 The RB 5 dye was removed by the Fenton's oxidation (FO) process by using a significant amount of FeSO4 and hydrogen peroxide.45 This dye was also investigated in heterogeneous aqueous solutions which contain semiconductor oxides i.e., CO2, NO3−, and SO42− ions as photocatalysts.46 A UV reactor with TiO2 was used to break down the color of RB 5 as an annular photoreactor.47 Doped TiO2 in the presence of N and F increases the intrinsic properties of the catalyst and shows an increased kinetic UV photoreactivity as compared to the un doped TiO2 in the degradation of 1,3,5-triazine herbicides.48 Cao et al. reported the synthesis of a graphene–TiO2 composite and its application for tetrabromobisphenol A degradation.49 Karthik et al. used a graphene–cerium molybdate composite for the photocatalytic degradation of the antibiotic chloramphenicol.50 Al-Nafiey et al. used a graphene–cobalt oxide composite for the removal of three organic dyes (rhodamine B, methyl orange and rose bengal).51
The discharge of industrial wastewater containing dye pollutants presents acute or long term toxicity on ecosystems.44,52 It is estimated that annually 80![[thin space (1/6-em)]](https://www.rsc.org/images/entities/char_2009.gif) 000 tons of more than ten thousand various kinds of dyes are synthesized worldwide and approximately 5.0–10.0% are assimilated into wastewater bodies by many procedures.53 10–15% of all reactive industrial dyestuffs are excreted directly into wastewater due to inefficiency in dyeing operations.54 Thus, the removal of reactive dyes is a serious challenge.55 This is why the RB 5 azo dye was used as a model to examine the catalytic properties of the newly synthesized nanocomposite.
000 tons of more than ten thousand various kinds of dyes are synthesized worldwide and approximately 5.0–10.0% are assimilated into wastewater bodies by many procedures.53 10–15% of all reactive industrial dyestuffs are excreted directly into wastewater due to inefficiency in dyeing operations.54 Thus, the removal of reactive dyes is a serious challenge.55 This is why the RB 5 azo dye was used as a model to examine the catalytic properties of the newly synthesized nanocomposite.
Materials and method
SnCl4·5H2O, CoCl2·6H2O and pallets of sodium hydroxide (NaOH) were used for the synthesis of nanocubes. Graphite powder, potassium permanganate (KMnO4), sodium nitrate (NaNO3), sulfuric acid (H2SO4 98%), and hydrogen peroxide (H2O2) were used for the synthesis of graphene oxide. Ethylene glycol was used for the synthesis of the nanocomposite. All chemicals were analytical grade and used without further purification. Deionized water was used throughout the experimental work.Synthesis of nanoparticles
Cobalt tin oxide nanoparticles were synthesized by a simple hydrothermal technique. In a typical approach, 0.3 g (SnCl4·5H20) and 0.6 g (CoCl2·6H2O) with an atomic ratio of 1![[thin space (1/6-em)]](https://www.rsc.org/images/entities/char_2009.gif) :
:![[thin space (1/6-em)]](https://www.rsc.org/images/entities/char_2009.gif) 2 were mixed in 30 ml of deionized water under constant magnetic stirring for 30 minutes at 500 rpm. After sometime they were completely dissolved. Then 7 ml of a 4 mol L−1 NaOH solution was added slowly into the solution. For further purification, the solution was treated in a Teflon lined stainless steel hydrothermal reactor autoclave and the temperature was maintained at 200 °C for 5 hours. After 5 hours, the hydrothermal autoclave reactor was allowed to naturally cool to room temperature for several hours. The precipitates of the product were collected by the process of centrifuging and were washed with ethanol and distilled water. The obtained product was dried in an oven at 60 °C for 24 hours as reported in a previous research paper.56
2 were mixed in 30 ml of deionized water under constant magnetic stirring for 30 minutes at 500 rpm. After sometime they were completely dissolved. Then 7 ml of a 4 mol L−1 NaOH solution was added slowly into the solution. For further purification, the solution was treated in a Teflon lined stainless steel hydrothermal reactor autoclave and the temperature was maintained at 200 °C for 5 hours. After 5 hours, the hydrothermal autoclave reactor was allowed to naturally cool to room temperature for several hours. The precipitates of the product were collected by the process of centrifuging and were washed with ethanol and distilled water. The obtained product was dried in an oven at 60 °C for 24 hours as reported in a previous research paper.56
Synthesis of graphene oxide (GO)
GO was synthesized by taking 90 ml of 99% pure H2SO4 and 2.1 g of 98% H3PO4 and stirring for one hour. After one hour of stirring at 500 rpm, 2 g of graphite flakes was added to the solution in a 500 ml volumetric flask in an ice bath and the temperature was maintained at 0–5 °C for two hours. 15 g of KMnO4 powder was slowly added into the suspension during the next three hours of stirring at 500 rpm and the temperature was maintained at 15–20 °C. After 6 hours, 184 ml H2O was carefully added into the solution under constant stirring and the temperature was maintained at 60–70 °C. After completing 8 hours of stirring at 500 rpm, the solution passed into the reflux system for 20–25 minutes at 100 °C temperature. After refluxing, the solution was cooled down to 30 °C and this temperature was maintained for 4 hours and then 40 ml of hydrogen peroxide was added into the solution. The color of the solution quickly changed and the bubbles of the suspension from the flask was noted. In the last step, the solution was divided into three beakers and then 150 ml of water was added into each beaker and they were left overnight. The pH of the solution was maintained by a process of centrifuging several times. The solution was placed in an oven at 60 °C and the product was dried and used for further analysis.Synthesis of the nanocomposite
The tin cobalt oxide based nanocomposite was synthesized by a simple solvothermal method by changing the solvents and conditions of the reaction and the results of these variations are discussed in Experimental section. In the end, the conditions and solvent that gave the best result were determined. Typically in this method, 60 ml of ethylene glycol was added as the solvent into which 0.15 g of graphene oxide was mixed during 40 minutes of stirring on magnetic plates at 500 rpm. After mixing graphene oxide into the solvent, 0.31 g of tin cobalt oxide was slowly added into the solution and stirred again for one hour. After stirring for one hour, the solution was placed in a Teflon lined stainless steel autoclave for 4 hours at 200 °C for further purification. After passing this 4 hour time period, the autoclave was placed at room temperature and the solution was cooled down naturally. The precipitate of the solution was collected by the process of centrifugation several times. The product was dried in the oven at 60 °C overnight. The dried product was placed in the electric furnace for calcination at 400 °C for 5 hours.Characterization
Powder XRD patterns of the nanoparticles were obtained from a Rigaku D/max Ultima III X-ray diffractometer with a radiation source of Cu-Kα (wavelength = 1.54174 Å) at 45 kV and 60 mA at a scanning step size of 0.020° in the 2θ range 10.015–80.012°. The XRD results were analyzed with the help of MATCH 3 software and the lattice parameters were calculated. The structural model was constructed on VESTA software. Scanning electron microscopic calculations were performed at 250 Quanta with a pressure of 70 (Pa) and 30 kV power. The patterns showed the cubic crystal structure of these nanoparticles. The catalytic reduction and absorption spectrum of the synthetic dye RB 5 was examined by a Halo DB 20 double beam spectrophotometer with the wavelength range of 400–700 nm. Investigation of the fuel properties by adding the newly synthesized graphene based tin cobalt oxide nanocomposite into the fuel to check the effect on the fuel efficiency was carried out in which the flash and fire point was monitored by the APEXJCX309 Closed Cup Flash Point Tester. An APEX-JCX406 oxygen bomb calorimeter was used to calculate the calorific value of the fuel. Specific gravity values were calculated by the gravity meter DA-640.Result and discussion
EDX analysis
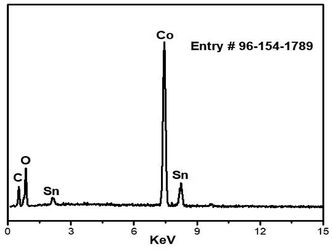
Energy Dispersive X-ray (EDX) analysis of the synthesized nanocomposite elements is shown in Fig. 1. The EDX spectrum describes the presence of Co, oxygen, tin and carbon atoms in the newly synthesized C16Co4O16Sn nanocomposite. It can be seen from Table 1 that the atom percentage of Co is more than half of all the elements present in the nanocomposite.| Sample | Co (%) | Sn (%) | O (%) | C (%) |
|---|---|---|---|---|
| GO based cobalt tin oxide nanocomposite | 54.55 | 14.45 | 16.63 | 14.27 |
XRD results of graphene oxide and the composite
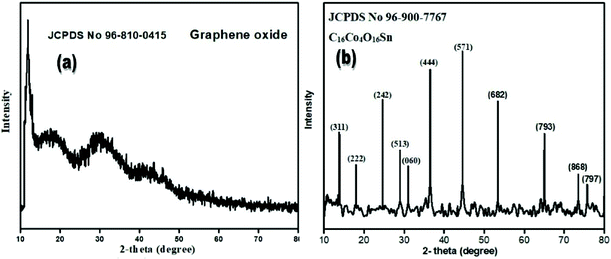
Fig. 2(a) shows the XRD pattern of GO in the 2-theta range 10–80°. One sharp diffraction peak at 12.521° with the (001) hkl plane is observed. This diffraction peak is characteristic of GO (JCPDS 96-810-0415). GO typically contains some functional groups (OH, –COOH etc.) along with water molecules. During reduction, GO loses water molecules upon treatment in a furnace at high temperature or sometimes gets fully rid of functional groups by heating at more than 1000 °C. In Fig. 2(b), the X-ray diffraction pattern of C16Co4O16Sn can be seen. The XRD pattern of cobalt tin oxide nanoparticles is discussed in a previous article.56 In Fig. 2(b), straight sharp diffraction peaks explain that the product is pure and well crystallized. Strong and sharp diffraction peaks at the 2-theta values 15.621°, 17.541°, 25.453°, 28.504°, 30.744°, 33.241°, 36.203°, 45.443°, 53.191°,63.961°, 73.513° and 75.793°, which are associated with hkl planes (311), (222), (242), (513), (060), (444), (571), (682), (793), (868) and (797), respectively, can be seen. These sharp diffraction peaks are characteristic of the newly synthesized GO based tin cobalt oxide nanocomposite (C16Co4O16Sn, JCPDS no 96-900-7767). The product investigation report, in which crystal parameters, cell parameters, space groups, atomic co-ordinates, lattice parameters, bond lengths, bond angels, volume, density, and d-spacing are shown in Table 2.| Parameters | Results | |
|---|---|---|
| Space group | F-43c | |
| Space group number | 219 | |
| Crystal system | Cubic | |
![[thin space (1/6-em)]](https://www.rsc.org/images/entities/char_2009.gif) |
||
| Cell parameters | ||
| A | 17.2550 Å | |
| B | 17.2550 Å | |
| C | 17.2550 Å | |
![[thin space (1/6-em)]](https://www.rsc.org/images/entities/char_2009.gif) |
||
| Angles | ||
| α | 90° | |
| β | 90° | |
| γ | 90° | |
![[thin space (1/6-em)]](https://www.rsc.org/images/entities/char_2009.gif) |
||
| Atomic coordinates | ||
| x, y and z coordinates of Sn | 0.000, 0.000 and 0.000 | |
| x, y and z coordinates of Co | −0.089, −0.089 and −0.089 | |
| x, y and z coordinates of O | −0.193, 0.043 and −0.109 | |
| x, y and z coordinates of C | −0.151, −0.007 and −0.099 | |
| Calculated density | 2.07500 g cm−3 | |
| I/Icor | 5.800000 | |
| 2-Theta, d-spacing and miller indices (hkl) | 15.621°, 5.2026 Å and (311) | |
| 17.541°, 4.9811 Å and (222) | ||
| 25.453°, 3.5222 Å and (242) | ||
| 30.744°, 2.9166 Å and (513) | ||
| 33.241°, 2.8758 Å and (060) | ||
| 36.203°, 2.4902 Å and (444) | ||
| 45.443°, 1.9924 Å and (571) | ||
| 53.191°, 1.6920 Å and (682) | ||
| 63.961°, 1.4635 Å and (793) | ||
| 73.513°, 1.3474 Å and (868) | ||
| 75.793°, 1.2897 Å and (797) | ||
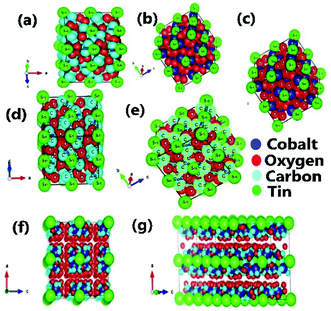
Detailed study of the diffraction peaks illustrates that the synthesized C16Co4O16Sn nanocomposite possesses a cubic lattice structure with a space group of F-43c. Fig. 3(a) shows that the Sn atoms are located at the corner of the cube while Fig. 3(b) shows that the cobalt atoms which are represented with a blue color are present at the center of the walls of the cube and Fig. 3(c–d) describes the presence of oxygen atoms in the center of the cube. The positions of all the atoms of the product are shown in Fig. 3(e). The positions and arrangement of all the atoms over the carbon atoms can be seen in Fig. 3(f). The three dimensional cubic lattice with the placement of all atoms is described in Fig. 3(g).
SEM and TEM analysis of the nanoparticles
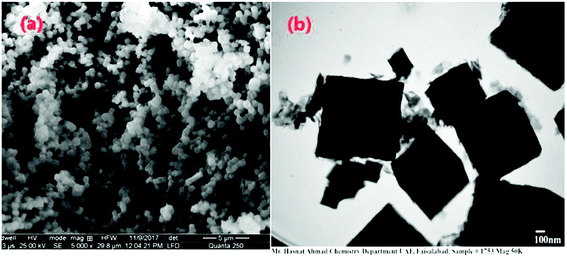
SEM and TEM images of the tin cobalt oxide nanoparticles are given in Fig. 4(a) and (b), respectively. In Fig. 4(a), the SEM image of the simple tin cobalt oxide nanoparticles with a magnification of 5000× can be seen. A number of small cubes are visible in this image. Similarly, the TEM image of the simple tin cobalt oxide at a magnification of 50![[thin space (1/6-em)]](https://www.rsc.org/images/entities/char_2009.gif) 000× can be seen in Fig. 4(b). The size of these particles lies in the 70–200 nm range.
000× can be seen in Fig. 4(b). The size of these particles lies in the 70–200 nm range.
SEM analysis of the nanocomposite
In Fig. 5(a) and (b), the 30 micro meter range with 1600× and 1579× magnification at a 250 quanta clean surface can be seen. In Fig. 5(c) and (d), in a 5 micro meter range with a high magnification of 6000×, small rough nano surfaces can be seen but no small cubic nanoparticles are seen, which is why with some modifications in the technique, clear and smooth SEM images of the synthesized C16Co4O16Sn nanocomposite at different magnifications are shown in Fig. 6(a–d).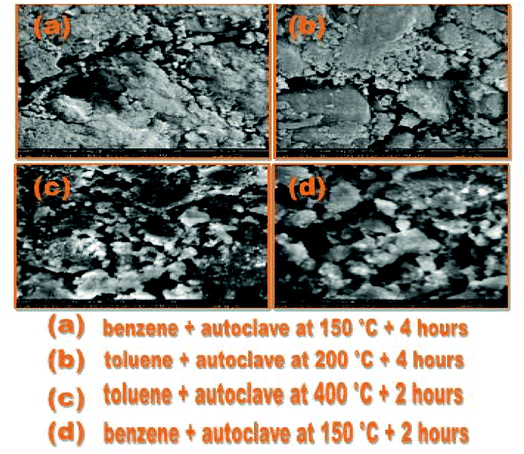 | ||
| Fig. 5 (a) and (b) SEM images of the first attempt of the nanocomposite and (c) and (d) SEM images of the second attempt of the nanocomposite. | ||
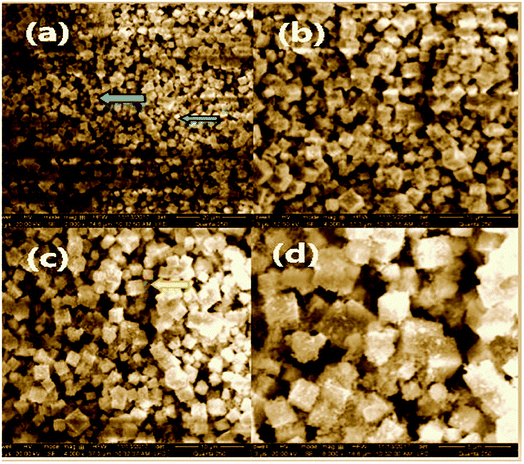
In Fig. 6(a), with a 20 micro meter range and a 2000× magnification at 250 quanta, small nanoparticles can be seen. The blue arrows indicate the surface of GO on which the newly synthesized cobalt tin oxide nanoparticles are adsorbed. In Fig. 6(b) and (c), the 10 micro meter view of the cube shape nanoparticles with the same magnification of 4000× but with a different value of high voltage i.e., 12.50 kV and 20.00 kV, respectively, can be seen. This view also shows that all the synthesized nanoparticles are separate from each other with the perfect corner edges of the cubes. In Fig. 6(d), the smooth and clear surface of the cubes of the nanoparticles at a 5 micro meter range with a 8000× magnification at 250 quanta can be seen. All the SEM images are captured in the presence of a gold coating at 250 quanta because at high magnification, the cobalt and tin metal shows charge in the presence of reduced graphene oxide (RGO). These highly magnified images show that the product comprises of compact cubes of tin cobalt hydroxide over the surface of RGO.
TEM analysis of the nanocomposite
To explore the morphology of the newly synthesized GO based bimetallic oxide nanocomposite in more detail at the nanoscale, TEM images at different magnifications are shown in Fig. 7(a–d). It can be clearly observed from the images of Fig. 7(a) that, at 250 nm with a magnification of 30k, the nanocomposite is in a cubic shape with soft edges and the rough corners of the cube are indicated by an orange arrow. The soft edges and rough corners of the cube are due to the product being calcined at 400 °C. In Fig. 7(b), at 250 nm with a magnification of 30![[thin space (1/6-em)]](https://www.rsc.org/images/entities/char_2009.gif) 000×, the surface of RGO can be seen, as indicated by the blue arrow. In Fig. 7(c), with a small range of 150 nm and Fig. 7(d) with a small range of 100 nm, small nanoparticles can be seen with a magnification power of 30
000×, the surface of RGO can be seen, as indicated by the blue arrow. In Fig. 7(c), with a small range of 150 nm and Fig. 7(d) with a small range of 100 nm, small nanoparticles can be seen with a magnification power of 30![[thin space (1/6-em)]](https://www.rsc.org/images/entities/char_2009.gif) 000× and 40
000× and 40![[thin space (1/6-em)]](https://www.rsc.org/images/entities/char_2009.gif) 000×, respectively. In the case of the metal oxide nanoparticles, the cubic particles show pores in their cube. These small pores can reduce the purity and the compatibility of the product and damage the surface area but in the tin cobalt oxide nanocomposite with RGO, the shape of the product is compact but irregular. The TEM images of the product confirm all the previous results of the SEM and XRD.
000×, respectively. In the case of the metal oxide nanoparticles, the cubic particles show pores in their cube. These small pores can reduce the purity and the compatibility of the product and damage the surface area but in the tin cobalt oxide nanocomposite with RGO, the shape of the product is compact but irregular. The TEM images of the product confirm all the previous results of the SEM and XRD.
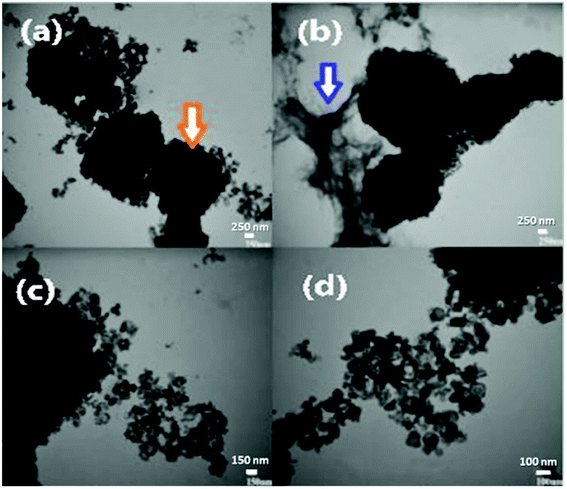 | ||
| Fig. 7 TEM images of the synthesized GO based tin cobalt oxide nanocomposite at different magnifications. | ||
Photocatalytic applications
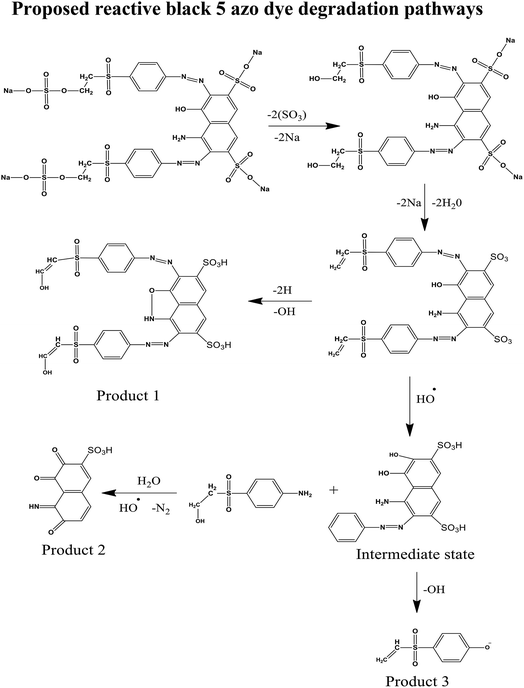
Removal of the color of Reactive Black 5 under sunlight and in the presence of the catalyst and hydrogen peroxide is shown in Fig. 8. The reduction of the RB 5 dye in the presence of the catalyst was investigated with the help of a UV-visible spectrophotometer because RB 5 azo dye strongly absorbs at 598 nm. The degradation of the dye was checked in the absence of the nanocomposite, but the maximum absorbance at 598 nm stayed the same with time. This showed that the degradation of the RB 5 dye could not be possible in the absence of the nanocomposite. Thus, the photocatalytic degradation of the dye that was carried out in the presence of an excess amount of hydrogen peroxide and sun irradiation increased the degradation rate, such that the reduction of dye followed pseudo first order kinetics. The addition of hydrogen peroxide enhanced the degradation of the dye because of the additional generation of hydroxyl radicals and prevention of electron–hole pair recombination.57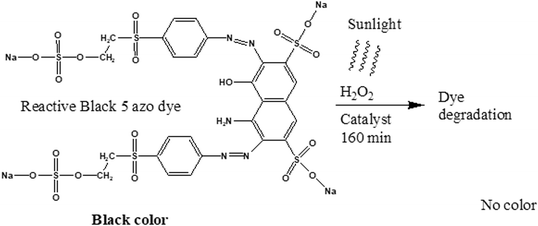 | ||
| Fig. 8 Removal of the color of Reactive Black 5 under sunlight and in the presence of a catalyst and hydrogen peroxide. | ||
UV spectra of the composite and the band gap calculation
The resulting UV spectrum obtained from the C16Co4O16Sn is shown in Fig. 9(a). The recorded spectral data showed a strong cut off at 290 nm with a minimum absorbance that collaborated in the percentage reflectance mode. The term band gap refer to the difference in energy between the conduction band at the bottom and the valence band at the top and is indicated by a double blue arrow in Fig. 9(b). Electrons have the capacity to move up from one band to another. The transition of electrons from the valence band to the conduction band requires minimum packets of energy. It can be seen from Fig. 9(b) that as the density of state increases, the band gap difference also increases. In the calculation of the band gap, the energy (E) = hc/λ where h (Planck's constant) = 6.62 × 10⁻³⁴ J s, c (speed of light) = 3.0 × 10⁸ m s−1, λ (cut-off wavelength) = 4.1882 × 10⁻⁹ m, and 1 eV = 1.6 × 10⁻¹⁹ J (conversion factor). The band gap is calculated to be 4.7418 × 10⁻¹⁹ J or 2.9636 eV.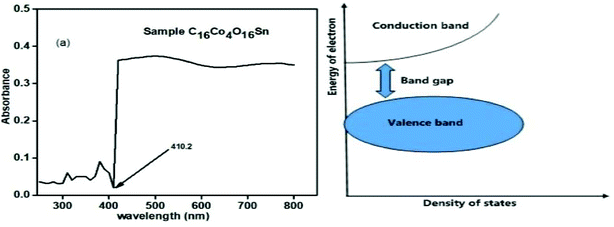 | ||
| Fig. 9 UV/visible spectra of the sample C16Co4O16Sn (left). Pictorial diagram of the explanation of band gap (right). | ||
Dye dependent UV-Vis spectra
The dye concentration dependent UV-Vis spectra in the presence of 0.50 mg ml−1 of catalyst and 2 ml of hydrogen peroxide is shown in Fig. 10.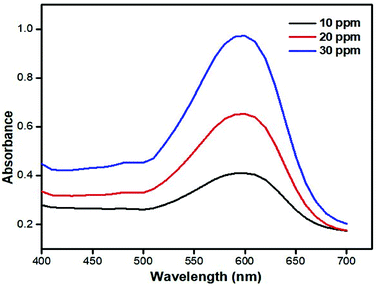 | ||
| Fig. 10 Comparison of dye absorbance spectra at different concentrations of dye solution and at 0.50 mg ml−1 concentrations of catalyst and 2 ml of hydrogen peroxide. | ||
These dye concentration dependent spectra were taken to study the maximum absorption and intensity of the dye in the absence of a catalyst and hydrogen peroxide. It can be seen in Fig. 10 that at 10 ppm dye solution the maximum absorbance is 0.410 and with 20 ppm dye solution the maximum absorption is 0.653 and similarly at concentration of 30 ppm dye solution max absorption is shown at 0.973. All the maximum absorptions were seen at 598 nm. Thus, a dye with a maximum concentration was chosen for further study of different parameters of RB 5 dye degradation.
Time dependent UV-Vis spectra
The RB 5 dye degradation time dependent UV-visible spectra in the presence of 0.5 mg ml−1 of catalyst and 2 ml of hydrogen peroxide under sun irradiation is shown in Fig. 11. It can be seen that when the process starts, the maximum absorbance at 598 nm is 0.973 but with the passage of time, absorbance at 598 nm decreases to 0.404 after 120 min of stirring under sunlight irradiation. This shows that the dye is degraded and the nanocomposite has a significant impact on dye degradation.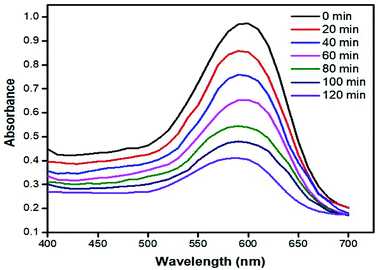 | ||
| Fig. 11 UV-Vis spectra of the photocatalytic degradation of the dye at different time intervals under sunlight (conditions: [RB5] = 30 ppm, [hydrogen peroxide] = 2 ml, and [catalyst] = 0.50 mg ml−1). | ||
Effect of catalyst concentration variation
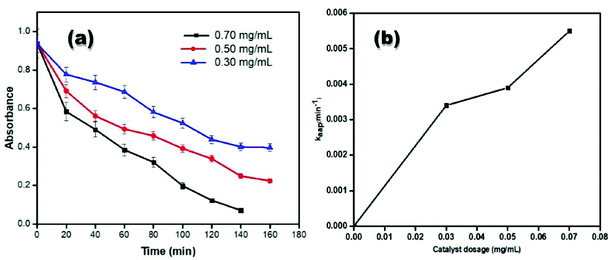
Fig. 12(a) shows the graph of the absorbance of dye versus time in the presence of 0.30, 0.50 and 0.70 mg ml−1 of catalyst and sunlight. It can be seen in the case of small dosages of catalyst that initially the change in value of absorbance with the passage of time is very small but as the dosage of catalyst increases, the rate of degradation is also increased. As the time passes, the process of dye degradation is increased and with the highest ratio of catalyst dosage i.e., 0.70 mg ml−1. At this dosage of catalyst the dye degraded with a quick time interval of 140 min and in the case of the other two dosages, the dye takes 160 min to degrade, which shows how the dosage of catalyst is important for the degradation of the RB 5 azo dye. In the case of 0.50 and 0.30 mg ml−1 catalyst dosage, a rapid decrease in the value of absorbance with time is firstly observed and then this decrease in absorbance becomes slow as compared to the case of 0.70 mg ml−1 catalyst dosage. The data from Fig. 12(a) is used to find the value of kapp. The plot of the catalyst dosage and kaap is shown in Fig. 12(b). The value of kaap increases from 0.003 to 0.059 mg ml−1 by increasing the concentration of the catalyst from 0.30 to 0.50 mg ml−1. This increase in the value of kapp is because of the increase in the number of available active sites with an increasing concentration of catalyst. This shows that at a low dosage of catalyst, the speed of catalysis is slow. In all the dye degradation processes where the dosage of catalyst varies with time, the other two parameters (dye concentration and hydrogen peroxide concentration) were constant.Effect of hydrogen peroxide without a catalyst
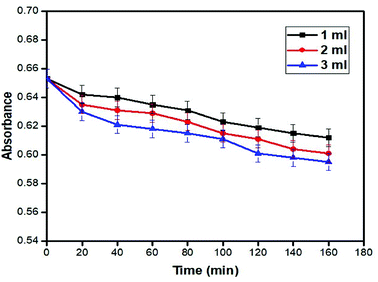
The graph of absorbance versus time for 1, 2 and 3 ml concentrations of hydrogen peroxide in the absence of a catalyst is shown in Fig. 13. In this graph, minor changes with fluctuating values of dye absorbance can be seen. At 20 ppm concentration, the dye shows the lowest absorbance of 0.595 with 3 ml of hydrogen peroxide amount and in the absence of a catalyst. This shows that the catalyst has a huge impact on the photocatalytic degradation.Effect of hydrogen peroxide concentration in the presence of a catalyst
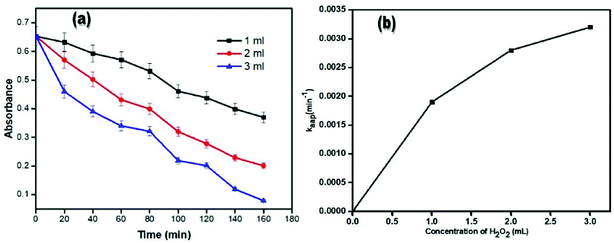
The graph of absorbance versus time for 1, 2 and 3 ml concentration of hydrogen peroxide is shown in Fig. 14. The graph in Fig. 12 is like that of Fig. 14. In this plot, initially the absorbance does not decrease with time in the case of 1 ml of hydrogen peroxide concentration. However, in the case of a 2 ml concentration of hydrogen peroxide, the absorbance decreases throughout the time period and decreases until the start of the decolorization. However, as the amount of hydrogen peroxide increases to 3 ml, a sharp decrease in the absorbance can be seen and then in a short period of time the absorbance decreases slowly but at 80 min a sharp decrease can be seen and then a continuous decrease in absorbance is observed for 160 min. The maximum decrease in absorbance can be seen in 3 ml of hydrogen peroxide at a 160 min time interval, which is 0.079. After 160 min, the photocatalytic dye degradation process stops and the dye solution shows almost the same absorbance as the full degradation of dye within 2 hours. In all the dye degradation processes where the hydrogen peroxide concentration varies, the other two parameters (dye concentration and catalyst dosage) are constant. The data from Fig. 14(a) is used to find the value of kapp. The plot of catalyst dosage and kaap is shown in Fig. 14(b). The value of kaap is increased from 0.0019 to 0.0032 mg ml−1 by increasing the amount of hydrogen peroxide from 1 to 3 ml. This increase in the value of kapp is because of the increase in the number of available active sites with increasing the concentration of catalyst.Mechanism of dye degradation
Nano level semiconductors have a higher volume to surface area ratio than their bulk counterparts, which therefore allows a higher absorption of photons in the presence of a photocatalytic surface. Furthermore, recombining of e− and hole pairs in the semiconductor nanoparticles is reduced when particle size is smaller. When the size of particles in the semiconductor is reduced to the nanometer level, the energy band gap greatly increases, which leads to huge redox potentials in the whole system Therefore bulk scale semiconductors are expected to lower photocatalytic activity while nanoscale semiconductors have a high photocatalytic activity.58 Commonly, to improve the efficiency of a catalyst, the number of electrons are reduced and the charge rate is enhanced so the recombination of holes and electrons is very important. It is known that semiconductor photocatalyzed reactions are started by holes or electrons being generated in the valence band or conduction band by semiconductor nanoparticles.59 After adding the catalyst into the solution, light is absorbed in the form of energy according to the band gaps. Positive holes in the VB are formed due to the transfer of electrons from the valence band to conduction band.| Semiconductor + UV light → h+ + e− |
An electron hole pair has a lifetime of only a few seconds but it is still enough to start a redox reaction with the semiconductor nanoparticles in the solution. There are three possible reaction pathways which have been proposed in the photochemical reaction (Fig. 15).
(1) An hydroxyl radical (OH) is oxidized by water and a positive hole which further oxidizes the dye molecules.
| H2O + h+ → OH˙ + H+ |
(2) A super oxide anion is formed when dissolved oxygen is reduced by an electron and this anion will start the mineralization of the RB5 dye. This super oxide radical again reduces to hydrogen peroxide.
| O2 + e− → O2−˙ |
Cleavage of H2O2
| H2O2 + O2−˙ → OH˙ + O2 + OH− |
| H2O2 → 2OH˙ |
(3) An hydroxyl radical (OH) is produced by water molecules by a positive hole which causes in turn the oxidization of the dye molecules.
For the confirmation of this mechanism, the presence of hydrogen peroxide for degradation of the RB5 azo dye in the presence of sunlight was investigated. For this reason, KMno4 was added into the solution as a titrant. When it was added into the solution, the purple color was diminished and hydrogen peroxide was produced consistently throughout the photocatalytic decomposition of the RB5 dye in which the permanganate ion acts as an oxidizing agent and causes the oxidation of hydrogen peroxide. The permanganate ion was reduced from a +7 oxidation state (purple color) to a +2 oxidation state in Mn with no color.60,61
| H2O2 → O2 + 2H+ + 2e− |
| MnO4− + 5e− + 8H+ → Mn2+·4H2O |
C16Co4O16Sn nanoparticles as a catalyst for fuel efficiency
Low octane kerosene oil was used in the presence of the synthesized nanocomposite as a reference for investigating the efficiency of this fuel and to study the properties of modified kerosene oil because kerosene oil is commonly used in heavy jet engines and aircraft. The efficiency of the fuel was monitored by examining all the parameters at different concentrations of fuel in the presence of the newly synthesized nanocomposite. The fire point, flash point, cloud point, pour point and calorific values were observed to examine the burning properties of pure kerosene oil as a model reaction. To analyze the physical characteristics of kerosene oil, the specific gravity was calculated.Effect of the C16Co4O16Sn nanocomposite on the efficiency of kerosene oil
The effect of the synthesized nanocomposite on the efficiency of kerosene oil was investigated by different parameters such as fire point, flash point and specific gravity. These parameters were studied at various dosages of catalyst (0, 30, 60 and 90 mg ml−1). All the results secured by using various dosages of catalyst were compared with reference to pure kerosene oil.Flash point and fire point
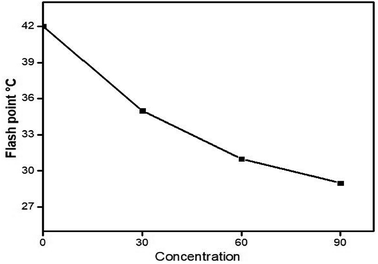
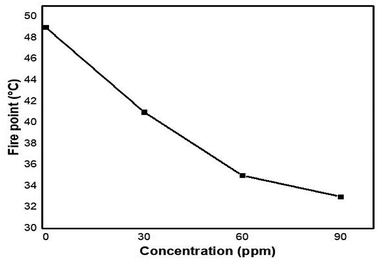
The effects of flash point and fire point on the efficiency of pure kerosene oil at different concentrations of nanocomposite (0, 30, 60 and 90 ppm) are shown in Fig. 16 and 17.It can be clearly seen from the plots that without the nanocomposite, the flash point and fire point temperature of pure kerosene oil is high. But after some time, as the concentration of nanocatalyst increases, the flash and fire point temperature significantly decreases. The decreasing plot shows the continuous decrease in the flash and fire point temperature. This decreasing pattern of the flash and fire point temperatures shows that the newly synthesized nanocomposite has the best characteristics as a catalyst to increase the efficiency of pure kerosene oil.
From Table 3, it can be clearly seen that the temperature of the flash and fire point of pure kerosene oil was high in the absence of the nanocatalyst. These values sharply decrease initially but by increasing the concentration of nanoparticles these values gradually decrease until the end of the 90 ppm concentration of kerosene oil. The temperature difference between the flash and fire points of pure kerosene oil was 7 °C and after adding the nanocatalyst, initially it changed to 6 °C and ended with 5 °C. This difference in temperature indicates that the new nanocomposite plays a vital role as a catalyst to increase the efficiency of pure kerosene oil by varying the dosage of the catalyst at commercial as well as for analytical scale.
| Parameters | Concentration of catalyst dosage | |||
|---|---|---|---|---|
| (Pure kerosene oil) | 30 ppm | 60 ppm | 90 ppm | |
| Flash point | 42 °C | 35 °C | 31 °C | 29 °C |
| Fire point | 49 °C | 41 °C | 35 °C | 33 °C |
| Specific gravity | 0.7853 g cm−3 | 0.7878 g cm−3 | 0.7880 g cm−3 | 0.7884 g cm−3 |
| Cloud point | 9 °C | 6 °C | 5 °C | 3 °C |
| Pour point | −15 °C | −19 °C | −22 °C | −30 °C |
| Calorific values | 920 J g−1 | 12![[thin space (1/6-em)]](https://www.rsc.org/images/entities/char_2009.gif) 604 J g−1 604 J g−1 |
20![[thin space (1/6-em)]](https://www.rsc.org/images/entities/char_2009.gif) 819 J g−1 819 J g−1 |
31![[thin space (1/6-em)]](https://www.rsc.org/images/entities/char_2009.gif) 412 J g−1 412 J g−1 |
Specific gravity
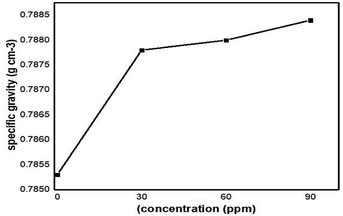
The specific gravity of pure kerosene oil was examined by a specific gravity meter (DA640) with 10 seconds of pump timing for each sample of the C16Co4O16Sn nanocatalyst at 25 °C being used to check the effect of the specific gravity on pure kerosene oil.Firstly, the specific gravity of kerosene oil in the absence of the nanocatalyst at 20 °C was measured which gave low values of specific gravity 0.7853 g cm−3. When the nanocatalyst at 30 ppm concentration was added into the pure kerosene oil it showed some increasing behavior i.e. the specific gravity of the pure kerosene oil increased to 0.7878 g cm−3 and was continuously increased by enhancing the concentration of the nanocatalyst. A higher concentration of nanoparticles dosage (90 ppm) shows the high values of specific gravity. The high specific gravity of kerosene oil was due to the high surface area of the newly synthesized nanoparticles. The effect of the nanoparticles on the specific gravity of the fuel is shown in Fig. 18. By running the sample on (SGM) three times, the results show that the specific gravity value of pure kerosene oil is low as compared to the modified kerosene oil. At different concentrations, the specific gravity values shift but they are lower than the pure sample.
Pour point and cloud point
The pour point and cloud point values of pure kerosene oil were high in the absence of the nanocatalyst. The values of cloud point at the start decreased by the addition of nanoparticles. With a high dosage of the catalyst, the cloud point values of the pure kerosene oil initially decreased by 1 °C per 30 ppm and ended with 3 °C per 30 ppm approximately. In the case of the pour point, the temperature in the presence of three different concentrations of the nanocatalyst in pure kerosene oil was found to be in the range of −15 to −33 °C. The pour point temperature constantly decreased by 1 °C for each concentration of kerosene oil by increasing the amount of C16Co4O16Sn nanoparticles up to 90 ppm. These values show that the pour point temperature is not affected by adding different dosages of nanocatalyst.Calorimetric values
In the presence of three different dosages of the concentration of C16Co4O16Sn nanoparticles (30, 60 and 90 ppm), the calorific values of pure kerosene oil are given in Table 3. It can be clearly seen from the given table that pure kerosene oil in the absence of a catalyst shows a low calorific value. After adding a catalyst of three different concentrations, the kerosene oil shows constantly high calorific values by adding a high concentration dosage of nanoparticles.Conclusions
A composite of cobalt tin oxide nanoparticles with RGO was successfully synthesized by a solvothermal approach. The newly synthesized nanocomposite was characterized by UV-visible spectroscopic analysis, EDX, XRD, SEM, TEM and X-ray diffraction (XRD). The investigation report confirms that the product is pure and the cobalt tin oxide nanoparticles are adsorbed over the surface of RGO. Controlled morphological experiments show that in the product, the nanocomposites are completely separate from each other and the sizes of the nanocomposite are in the nano range. The wavelength of the maximum absorption of the RB 5 azo dye is found to be 598 nm. The degradation of the Reactive Black RB 5 azo dye was investigated to examine the photocatalytic properties of the newly synthesized nanocomposite. It was observed that the absorbance decreases in the presence of sunlight from 0.973 to 0.404 with an increase in the C16Co4O16Sn dosage from 0.30 to 0.70 mg ml−1. It is noted that the value of the absorbance is also decreased from 0.973 to 0.079 by increasing the amount of hydrogen peroxide from 1 ml to 3 ml. The maximum degradation of Reactive Black 5 dye is observed for a 3 ml concentration of hydrogen peroxide and 0.70 mg ml−1 of catalyst. The synthesized nanocomposite was also used to examine the efficiency of kerosene oil by investigating different parameters of the modified kerosene oil. From the addition of the nanocomposite to pure kerosene oil, the calorific values were also increased which shows the effectiveness of the catalytic properties of the newly synthesized nanocomposite. It was also determined that the flash and fire point temperatures were significantly decreased by the addition of the C16Co4O16Sn nanoparticles. It is also observed that the C16Co4O16Sn nanoparticles have a positive effect on the pour point and cloud point temperatures of pure kerosene oil. The experimental results of photocatalytic and fuel additive applications indicate that the newly synthesized C16Co4O16Sn nanoparticles have an efficient surface area and photocatalytic properties.Conflicts of interest
There are no conflicts to declare.Acknowledgements
The authors would like to acknowledge the financial support provided by the Department of Chemistry, University of Agriculture, Faisalabad, Pakistan and Department of Chemistry, University of Sargodha, Sargodha, Pakistan. The paper was submitted by the corresponding author from King Fahd University of Petroleum and Minerals (KFUPM), Kingdom of Saudi Arabia.References
- A. R. Babar, et al., Electrical and dielectric properties of co-precipitated nanocrystalline tin oxide, J. Alloys Compd., 2010, 505(2), 743–749 CrossRef CAS.
- M. U. Niemann, et al., Processing analysis of the ternary LiNH2–MgH2–LiBH4 system for hydrogen storage, Int. J. Hydrogen Energy, 2009, 34(19), 8086–8093 CrossRef CAS.
- A. Chen and S. Chatterjee, Nanomaterials based electrochemical sensors for biomedical applications, Chem. Soc. Rev., 2013, 42(12), 5425–5438 RSC.
- S. Jamil, et al., Synthesis, characterization and catalytic application of polyhedron zinc oxide microparticles, Mater. Res. Express, 2017, 4(1), 015902 CrossRef.
- M. Mahmoudi, et al., Superparamagnetic iron oxide nanoparticles (SPIONs): development, surface modification and applications in chemotherapy, Adv. Drug Delivery Rev., 2011, 63(1–2), 24–46 CrossRef CAS PubMed.
- S. Jamil, M. R. S. A. Janjua and T. Ahmad, The synthesis of flower shaped microstructures of Co3O4 by solvothermal approach and investigation of its catalytic activity, Solid State Sci., 2014, 36, 73–79 CrossRef CAS.
- P. V. L. Reddy, et al., Photocatalytic degradation of bisphenol A in aqueous media: a review, J. Environ. Manage., 2018, 213, 189–205 CrossRef CAS PubMed.
- R. Mariappan and S. Mahalingam, [Bmim][TfO] ionic liquid-assisted oriented growth of Co3O4 nanoworms, Mater. Res. Bull., 2013, 48(2), 618–623 CrossRef CAS.
- S. Farhadi, K. Pourzare and S. Sadeghinejad, Simple preparation of ferromagnetic Co3O4 nanoparticles by thermal dissociation of the [Co II (NH3)6](NO3)2 complex at low temperature, J. Nanostruct. Chem., 2013, 3(1), 16 CrossRef.
- L. Jiang, et al., Size-controllable synthesis of monodispersed SnO2 nanoparticles and application in electrocatalysts, J. Phys. Chem. B, 2005, 109(18), 8774–8778 CrossRef CAS PubMed.
- P. V. Viet, et al., Fusarium antifungal activities of copper nanoparticles synthesized by a chemical reduction method, J. Nanomater., 2016, 2016, 6 Search PubMed.
- M. U. Khalid, S. R. Khan and S. Jamil, Morphologically Controlled Synthesis of Cubes like Tin Oxide Nanoparticles and Study of its Application as Photocatalyst for Congo Red Degradation and as Fuel Additive, J. Inorg. Organomet. Polym. Mater., 2018, 28(1), 168–176 CrossRef CAS.
- A. Salimi, et al., Nanomolar detection of hydrogen peroxide on glassy carbon electrode modified with electrodeposited cobalt oxide nanoparticles, Anal. Chim. Acta, 2007, 594(1), 24–31 CrossRef CAS PubMed.
- S. Jamil, et al., The synthesis of porous Co3O4 micro cuboid structures by solvothermal approach and investigation of its gas sensing properties and catalytic activity, Mater. Res. Bull., 2013, 48(11), 4513–4520 CrossRef CAS.
- J. Zhu, et al., Supported cobalt oxide nanoparticles as catalyst for aerobic oxidation of alcohols in liquid phase, ACS Catal., 2011, 1(4), 342–347 CrossRef CAS.
- X. J. Zhu, et al., Highly porous reticular tin–cobalt oxide composite thin film anodes for lithium ion batteries, J. Mater. Chem., 2009, 19(44), 8360–8365 RSC.
- H. Jena, K. G. Kutty and T. Kutty, Ionic transport and structural investigations on MSn(OH)6 (M= Ba, Ca, Mg, Co, Zn, Fe, Mn) hydroxide perovskites synthesized by wet sonochemical methods, Mater. Chem. Phys., 2004, 88(1), 167–179 CrossRef CAS.
- D. Huang, et al., Hydrothermal synthesis of MSn(OH)6 (M= Co, Cu, Fe, Mg, Mn, Zn) and their photocatalytic activity for the destruction of gaseous benzene, Chem. Eng. J., 2015, 269, 168–179 CrossRef CAS.
- F. Huang, et al., A novel tin-based nanocomposite oxide as negative-electrode materials for Li-ion batteries, Mater. Lett., 2003, 57(22–23), 3341–3345 CrossRef CAS.
- F. Song, K. Schenk and X. Hu, A nanoporous oxygen evolution catalyst synthesized by selective electrochemical etching of perovskite hydroxide CoSn(OH)6 nanocubes, Energy Environ. Sci., 2016, 9(2), 473–477 RSC.
- C. Y. Teh, T. Y. Wu and J. C. Juan, An application of ultrasound technology in synthesis of titania-based photocatalyst for degrading pollutant, Chem. Eng. J., 2017, 317, 586–612 CrossRef CAS.
- K. P. Loh, et al., Graphene oxide as a chemically tunable platform for optical applications, Nat. Chem., 2010, 2(12), 1015 CrossRef CAS PubMed.
- P. Avouris and F. Xia, Graphene applications in electronics and photonics, MRS Bull., 2012, 37(12), 1225–1234 CrossRef CAS.
- L. Lancellotti, et al., Graphene applications in Schottky barrier solar cells, Thin Solid Films, 2012, 522, 390–394 CrossRef CAS.
- X. Huang, et al., Graphene oxide dielectric permittivity at GHz and its applications for wireless humidity sensing, Sci. Rep., 2018, 8(1), 43 CrossRef PubMed.
- W. Subramonian and T. Y. Wu, Effect of enhancers and inhibitors on photocatalytic sunlight treatment of methylene blue, Water, Air, Soil Pollut., 2014, 225(4), 1922 CrossRef.
- S. Li, et al., Facile synthesis of bimetallic Ag-Cu nanoparticles for colorimetric detection of mercury ion and catalysis, Sens. Actuators, B, 2018, 255, 1471–1481 CrossRef CAS.
- P. Cheng, et al., Fast sonochemical synthesis of CoSn(OH)6 nanocubes, conversion towards shape-preserved SnO2–Co3O4 hybrids and their photodegradation properties, Mater. Lett., 2013, 90, 19–22 CrossRef CAS.
- A. Vázquez-Olmos, et al., Mechanochemical Synthesis of YFeO3 Nanoparticles: Optical and Electrical Properties of Thin Films, J. Cluster Sci., 2018, 29(2), 225–233 CrossRef.
- G. Sun, et al., Solvothermal synthesis and characterization of porous zinc hydroxystannate microspheres, Mater. Lett., 2015, 150, 105–107 CrossRef CAS.
- F. C. F. Low, et al., Investigation into photocatalytic decolorisation of CI Reactive Black 5 using titanium dioxide nanopowder, Color. Technol., 2012, 128(1), 44–50 CAS.
- Z. Wang, et al., Amorphous CoSnO3@C nanoboxes with superior lithium storage capability, Energy Environ. Sci., 2013, 6(1), 87–91 RSC.
- J. Zhang, et al., Synthesis of Co2SnO4 hollow cubes encapsulated in graphene as high capacity anode materials for lithium-ion batteries, J. Mater. Chem. A, 2014, 2(8), 2728–2734 RSC.
- Y.-h. Si, et al., Enhanced Visible Light Driven Photocatalytic Behavior of BiFeO3/Reduced Graphene Oxide Composites, Nanomaterials, 2018, 8(7), 526 CrossRef PubMed.
- L. Jiang, et al., Controlled synthesis of CeO2/graphene nanocomposites with highly enhanced optical and catalytic properties, J. Phys. Chem. C, 2012, 116(21), 11741–11745 CrossRef CAS.
- J.-W. Shi, et al., The composite of nitrogen-doped anatase titania plates with exposed {0 0 1} facets/graphene nanosheets for enhanced visible-light photocatalytic activity, J. Colloid Interface Sci., 2014, 430, 100–107 CrossRef CAS PubMed.
- Y. Cao, et al., Facile synthesis of CoSnO3/Graphene nanohybrid with superior lithium storage capability, Electrochim. Acta, 2014, 132, 483–489 CrossRef CAS.
- M. Ismail, et al., Green synthesis of plant supported Cu Ag and Cu Ni bimetallic nanoparticles in the reduction of nitrophenols and organic dyes for water treatment, J. Mol. Liq., 2018, 260, 78–91 CrossRef CAS.
- J. Wang, et al., Iron–copper bimetallic nanoparticles supported on hollow mesoporous silica spheres: an effective heterogeneous fenton catalyst for orange II degradation, RSC Adv., 2015, 5(85), 69593–69605 RSC.
- N. Qin, et al., Enhanced removal of trace Cr (VI) from neutral and alkaline aqueous solution by FeCo bimetallic nanoparticles, J. Colloid Interface Sci., 2016, 472, 8–15 CrossRef CAS PubMed.
- Z. Guo, et al., Construction of cost-effective bimetallic nanoparticles on titanium carbides as a superb catalyst for promoting hydrolysis of ammonia borane, RSC Adv., 2018, 8(2), 843–847 RSC.
- N. Arora, et al., 4-Nitrophenol reduction catalysed by Au-Ag bimetallic nanoparticles supported on LDH: homogeneous vs. heterogeneous catalysis, Appl. Clay Sci., 2018, 151, 1–9 CrossRef CAS.
- M. Khan, et al., Graphene based metal and metal oxide nanocomposites: synthesis, properties and their applications, J. Mater. Chem. A, 2015, 3(37), 18753–18808 RSC.
- D. Mantzavinos and E. Psillakis, Enhancement of biodegradability of industrial wastewaters by chemical oxidation pre-treatment, J. Chem. Technol. Biotechnol., 2004, 79(5), 431–454 CrossRef CAS.
- S. Meriç, D. Kaptan and T. Ölmez, Color and COD removal from wastewater containing Reactive Black 5 using Fenton's oxidation process, Chemosphere, 2004, 54(3), 435–441 CrossRef PubMed.
- I. Poulios and I. Tsachpinis, Photodegradation of the textile dye Reactive Black 5 in the presence of semiconducting oxides, J. Chem. Technol. Biotechnol., 1999, 74(4), 349–357 CrossRef CAS.
- C. Tang and V. Chen, The photocatalytic degradation of reactive black 5 using TiO2/UV in an annular photoreactor, Water Res., 2004, 38(11), 2775–2781 CrossRef CAS PubMed.
- E. M. Samsudin, et al., Enhancement of the intrinsic photocatalytic activity of TiO2 in the degradation of 1,3,5-triazine herbicides by doping with N, F, Chem. Eng. J., 2015, 280, 330–343 CrossRef CAS.
- M. Cao, et al., Photocatalytic degradation of tetrabromobisphenol A by a magnetically separable graphene–TiO2 composite photocatalyst: Mechanism and intermediates analysis, Chem. Eng. J., 2015, 264, 113–124 CrossRef CAS.
- R. Karthik, et al., A study of electrocatalytic and photocatalytic activity of cerium molybdate nanocubes decorated graphene oxide for the sensing and degradation of antibiotic drug chloramphenicol, ACS Appl. Mater. Interfaces, 2017, 9(7), 6547–6559 CrossRef CAS PubMed.
- A. Al Nafiey, et al., Reduced graphene oxide decorated with Co3O4 nanoparticles (rGO-Co3O4) nanocomposite: a reusable catalyst for highly efficient reduction of 4-nitrophenol, and Cr(VI) and dye removal from aqueous solutions, Chem. Eng. J., 2017, 322, 375–384 CrossRef CAS.
- S. B. Jadhav and R. S. Singhal, Polysaccharide conjugated laccase for the dye decolorization and reusability of effluent in textile industry, Int. Biodeterior. Biodegrad., 2013, 85, 271–277 CrossRef CAS.
- C. Hessel, et al., Guidelines and legislation for dye house effluents, J. Environ. Manage., 2007, 83(2), 171–180 CrossRef CAS PubMed.
- C. Pratum, et al., Decolorization of reactive dyes and textile dyeing effluent by Pleurotus sajor-caju, 2012 Search PubMed.
- M. C. Silva, et al., Decolorization of the phthalocyanine dye reactive blue 21 by turnip peroxidase and assessment of its oxidation products, J. Mol. Catal. B: Enzym., 2012, 77, 9–14 CrossRef CAS.
- S. Jamil, et al., First Synthetic Study of Cube-Like Cobalt Hydroxystannate Nanoparticles as Photocatalyst for Drimarene Red K-4BL Degradation and Fuel Additive, J. Cluster Sci., 2018, 29, 685–696 CrossRef CAS.
- W. Subramonian, T. Y. Wu and S.-P. Chai, Photocatalytic degradation of industrial pulp and paper mill effluent using synthesized magnetic Fe2O3-TiO2: treatment efficiency and characterizations of reused photocatalyst, J. Environ. Manage., 2017, 187, 298–310 CrossRef CAS PubMed.
- M. Sharma, et al., Photocatalytic degradation of organic dyes under UV–visible light using capped ZnS nanoparticles, Sol. Energy, 2012, 86(1), 626–633 CrossRef CAS.
- G. Zhou and J. Deng, Preparation and photocatalytic performance of Ag/ZnO nano-composites, Mater. Sci. Semicond. Process., 2007, 10(2–3), 90–96 CrossRef CAS.
- A. N. Rao, B. Sivasankar, and V. Sadasivam, Photo-oxidative degradation of an azo dye direct red 31 in the presence of ZnS catalyst, 2010 Search PubMed.
- E. K. Goharshadi, et al., Photocatalytic degradation of reactive black 5 azo dye by zinc sulfide quantum dots prepared by a sonochemical method, Mater. Sci. Semicond. Process., 2013, 16(4), 1109–1116 CrossRef CAS.
| This journal is © The Royal Society of Chemistry 2018 |

