
 Open Access Article
 This Open Access Article is licensed under a Creative Commons Attribution-Non Commercial 3.0 Unported Licence
Valence electronic structure of [EMIM][BF4] ionic liquid: photoemission and DFT+D study
I. Kuusik a,
M. Berholtsac,
J. Kruusmab,
V. Kisanda,
A. Tõnisooa,
E. Lustb and
E. Nõmmistea
a,
M. Berholtsac,
J. Kruusmab,
V. Kisanda,
A. Tõnisooa,
E. Lustb and
E. Nõmmistea
aInstitute of Physics, University of Tartu, W. Ostwaldi 1, 50411 Tartu, Estonia
bInstitute of Chemistry, University of Tartu, Ravila 14a, 50411 Tartu, Estonia
cDept. of Physics and Astronomy, University of Turku, FIN-20014 Turku, Finland
First published on 28th August 2018
Abstract
The ultraviolet photoelectron spectrum (UPS) of the [EMIM][BF4] ionic liquid was recorded and analyzed. Together with the gas-phase UPS spectrum of the [EMIM][BF4] vapor and ab initio calculation methods, detailed insight into the electronic structure of this simple ionic liquid is possible. The low binding energy tail in the UPS spectrum is about 7.4 eV, in agreement with previous estimations of the HOMO–LUMO gap of the [EMIM][BF4] ion-pair. The bulk ab initio calculations are able to explain most of the features in the spectrum. However, DFT consistently lacks accuracy in the description of the top of the valence band. The dispersion corrected PBE calculation (PBE-D3) did offer very good agreement with the experimental structure, but the recently-developed vdW-DF functionals C09, optPBE, optB88 and CX were found to offer the best agreement in terms of the electronic structure.
1. Introduction
Ionic liquids have many useful properties, like low melting temperatures and vapor pressure, excellent solvation ability, low chemical volatility and high thermal stability and ionic conductivity. They have possible applications in diverse fields, such as chemical synthesis, catalysis, biocatalysis, fuel cells, solar cells, electrochemistry, analytical chemistry, nanotechnology etc.1 With the selection of many available anions and cations it is possible to synthesize a vast number of different ionic liquids with varying properties.As Nishi et al.2 pointed out, understanding the electronic structure of the ionic liquids is important and an essential question is how the electronic structures of the cations and the anions are combined to form the overall ionic liquid electron structure. As noted by Yoshimura et al., the understanding of the electronic structure of room-temperature ionic liquids, especially the top of the valence band, is very important in the study of ionic liquids.3 Cremer et al. pointed out that photoelectron spectroscopy (PES) is a very powerful experimental method, which provides direct access to the electronic structure of ionic liquids.4 The valence band of ionic liquids is accessible with ultraviolet photoelectron spectroscopy (UPS).
From previous studies, it was established, that the intact ion-pairs (ionic liquid molecules) of the ionic liquid were indeed evaporating5 and it was possible to measure their electronic spectra.6 These gas phase studies are a relatively new development.4,7
Therefore the same ionic liquid, 1-ethyl-3-methylimidazolium tetrafluoroborate, was chosen as a model ionic liquid. [EMIM][BF4] consists of the EMIM cation and the BF4 anion. The simplest notation for the cations and anions ([CATION][ANION]) has been used in this study. [EMIM][BF4] is a relatively simple ionic liquid with many favorable properties like low melting temperature, relatively low viscosity and good lubricating properties. Besides the recently recorded UPS spectrum of the ionic liquid vapor, most of its properties have been already studied extensively.
It is of interest to compare the photoelectron spectra of the ionic liquid constituents (ions or ion-pairs) to their actual liquid phase UPS spectra. Therefore the liquid phase UPS spectrum of [EMIM][BF4] was measured. To the best of our knowledge, this is the first presentation of the UPS spectrum of [EMIM][BF4] liquid. The (similar) UPS spectrum of the similar [BMIM][BF4] ionic liquid has been measured by Yoshimura et al.3 and Ulbrich et al.8 Also, there are very little (if any) such comparisons between the liquid and vapor phase electronic spectra of ionic liquids.
The interpretation of the valence band electronic spectra calls for support from theoretical modelling and electronic structure calculations. We focus mainly on the shape and features of the experimental UPS spectrum and the comparison with ab initio calculated density of states (DOS) in order to better understand the electronic structure of the ionic liquid.
We will show that it is very important to include the description of London dispersion forces in the calculation to adequately describe the electronic structure of the ionic liquid.
2. Experimental and computational details
The [EMIM][BF4] ionic liquid with a stated purity of >99% was purchased from Sigma-Aldrich and was kept under high vacuum before measurement. The ionic liquid film was deposited on an amorphous carbon surface (Mo2C derived) and the film was thick enough to avoid any signal from the substrate. The measurements were performed at room temperature.The experiment was performed at an undulator source beamline I-411 of the MAX-II synchrotron radiation facility (Lund, Sweden).9 The beamline was equipped with a modified SX-700 monochromator with 1220 lines per mm plane grating and an elliptical focusing mirror. The incidence photon energy during the photoemission measurements was 100 eV and the photon beam diameter was about 0.5 × 1 mm. Beam damage is expected to be negligible and no charging related issues were observed. The kinetic energies of the photoelectrons were measured with a hemispherical electron analyzer Scienta SES-200. The energy scale was calibrated by Au 3d photolines. Pass energy of 50 eV was chosen for the measurements. These operation conditions lead to a total energy resolution around 0.1 eV fwhm (full width at half maximum).
Ab initio DFT (density functional theory) calculations were performed with the Abinit (version 8) code.10,11 The local density approximation (LDA) or generalized gradient approximation (GGA) was used. The corresponding exchange–correlation functionals used were Perdew–Wang (PW)12 and Perdew–Burke–Ernzerhof (PBE).13 van der Waals (vdW) effects were studied with the revPBE (κ = 1), optPBE, optB88, CX and C09 exchange functionals. Pseudopotentials optimized for the PBE functional were used throughout, except for the LDA calculation, where pseudopotentials optimized for LDA were used. The choice of pseudopotentials is expected not to significantly influence the results.14,15
The starting point for the bulk calculations was the experimental XRD structure16 which was then (geometry) optimized using the Broyden–Fletcher–Goldfarb–Shanno algorithm. The calculations with the vdW-DF functionals were performed in the experimental cell and only the atomic positions were optimized. The cut-off energy for the plane waves was chosen to be 800 eV. Ion-pair calculation and optimization was performed in a big 16 × 16 × 16 Å unit cell. The geometry optimization was converged at least to 2 × 10⁻⁴ eV Å−1 rms forces. A 3 × 3 × 3 Monkhorst–Pack k-point grid was found to be (more than) sufficient for the convergence of the DOS. For added accuracy the DOS was calculated using the tetrahedron method. The local density of states (LDOS) was obtained by calculating the DOS inside a sphere centered on the atoms. Zero point energy is not taken into account in the calculations.
For compensating the difficulty in the energy scale of the DFT calculations, the energy scale of the DOS was shifted for a better fit to the observed spectrum. The simulated spectra have been scaled and shifted to match the experimental fluoride derived peak at around 16 eV binding energy, which is around the center of the valence band. The shifts used were between 8.3 eV and 9.2 eV. The calculated bulk DOS has been Gaussian broadened by 0.9 eV fwhm. The modelled spectrum of the ion-pair was shifted 5.3 eV and Gaussian broadened by 0.9 eV fwhm. Mostly this large shift is due to the difference of the zero energy of the calculation (vacuum energy) and experiment (Fermi energy).17,18 The former is roughly at the top of the valence band and the latter is at the bottom of the conduction band, therefore a shift at least of the order of the experimental band gap (about 7.4 eV) is easily explained.
To account for the photoemission cross sections, the data of Yeh and Lindau was used.19,20 As mentioned by Ulbrich et al. this is a good improvement over the plain DOS, but to account for the final state density of states (resonance effects) one would also need to calculate the cross sections ab initio.8
3. van der Waals forces and the top of the valence band
The experimental UPS spectrum of the [EMIM][BF4] ionic liquid is shown in Fig. 1. The figure also reproduces the experimental gas phase UPS spectrum from ref. 6 and shows some calculation results. The [EMIM][BF4] liquid spectrum is very similar to the [BMIM][BF4] ionic liquid spectrum measured by Yoshimura et al.,3 as expected.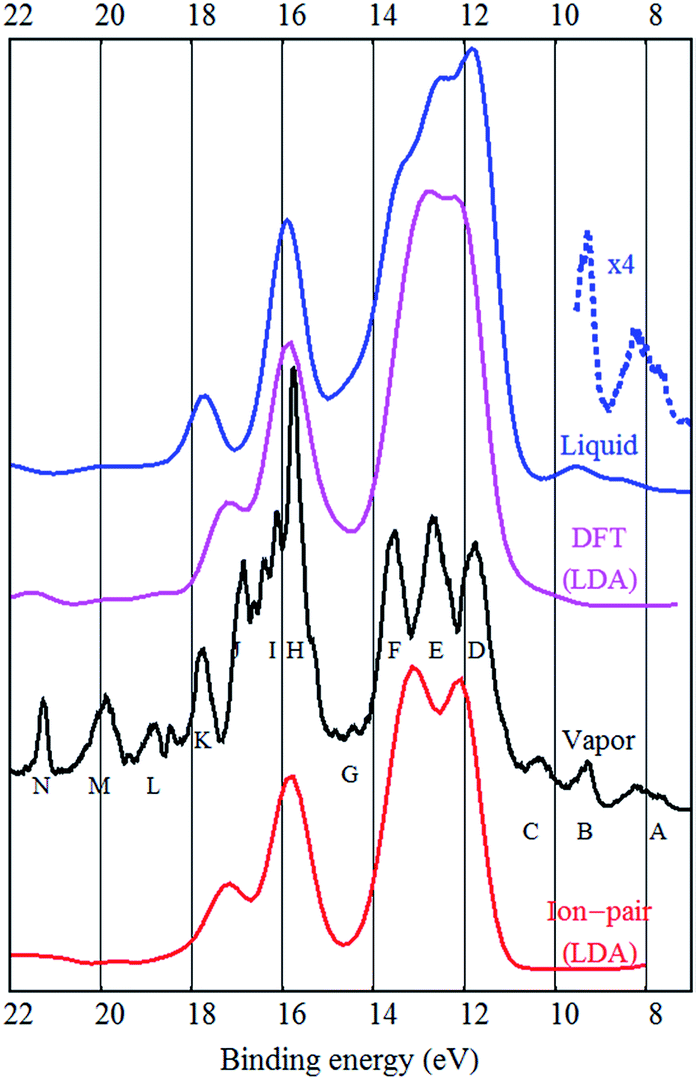 | ||
| Fig. 1 The LDA DFT reconstruction of the bulk [EMIM][BF4] spectrum (labeled “DFT (LDA)”), the LDA DFT reconstruction of the [EMIM][BF4] ion-pair spectrum (at bottom, labeled “Ion-pair LDA”), the experimental gas phase UPS spectrum of [EMIM][BF4] (labeled “Vapor”), the experimental liquid phase UPS spectrum of [EMIM][BF4] (top, labeled “Liquid”), the magnified view of the low binding energy part of the liquid UPS spectrum (dashed, labeled “×4”). Letters A–N near the experimental gas phase spectrum are used for labeling the different peaks that are distinguishable. | ||
It is already known from the gas phase study of [EMIM][BF4] that the inner valence band peaks (H–N) have mostly cationic origin while the F, E and D peaks are mostly fluorine related and therefore are due to the anion. The A and B peaks were assigned to π-bonds in the EMIM cation,6 similar to the calculated HOMO state of [BMIM][BF4].2
When comparing the gas and liquid phase spectra, it is evident that the overall structure is very similar, but the liquid phase structures are more broadened, as expected. The F, E and D peaks are joined together in the liquid phase spectrum and there is no fine structure around the J, I and H peaks. It also seems that the N, M and L peaks are broadened or have lower intensity in the bulk spectrum.
As mentioned by Ikari et al. the DOS of the ion-pair is not fully adequate to describe liquid phase DOS, but seemingly provides good peak positions.21 Indeed, the peak positions are similar in case of gas and liquid phase spectra. Strasser et al. claimed that the vapor UPS spectra of [BMIM][Tf2N] and [EMIM][Tf2N] are practically identical to [EMIM][Tf2N] vapor (ion-pair) UPS spectrum.22 This would indicate very little solvation effects and small influence of hydrogen bonding and dispersion on the electronic states. This is suspect, as in the case of the [EMIM][BF4] ionic liquid studied here, the gas phase spectrum has much finer features, although the overall shape of the spectrum is indeed similar to bulk. However, Reinmöller et al. pointed out that the ion-pair approximation to the bulk is better in the case of larger anions (like Tf2N)17 and in case of the relatively small BF4 anion, bulk calculations may be needed. Ulbrich et al. also understood that ion-pair calculations were not adequate to describe the condensed phase.8
The gas phase calculations showed that common DFT (even in the case of hybrid functionals like B3LYP and M06) is unable to correctly describe the outer valence region. MP2 (Møller–Plesset perturbation theory) is far better in this regard probably due to its correct treatment of the exchange interaction and relatively good description of electron correlation and vdW forces. However, the computational cost of hybrid functionals and not to mention MP2 is prohibitively high for the use in bulk ionic liquid calculations.
Therefore, we performed the DFT calculation of the [EMIM][BF4] crystal, whose structure has been experimentally determined by X-ray diffraction.16
As it was pointed out by Reinmöller et al., the cross section of photoemission is much larger in case of the F 2p orbitals compared to C 2p orbitals.17 Therefore the fluorine derived states have higher intensities in the experimental spectra. In case of the BF4− anion, this implies that the anion contributes much more to the UPS spectra. This is true for most ionic liquids.8,17,23 It has been shown, that the spectral intensities can be described better, if the photoemission cross sections are taken into account.8,17 This is also confirmed by our calculation (see Fig. 2–4) where we see a dramatic (eye-catching17) improvement in the similarity with the experimental UPS spectrum from the total DOS calculation to the DOS calculation with the intensities weighted to account for the different photoemission cross sections of different atoms and orbitals.
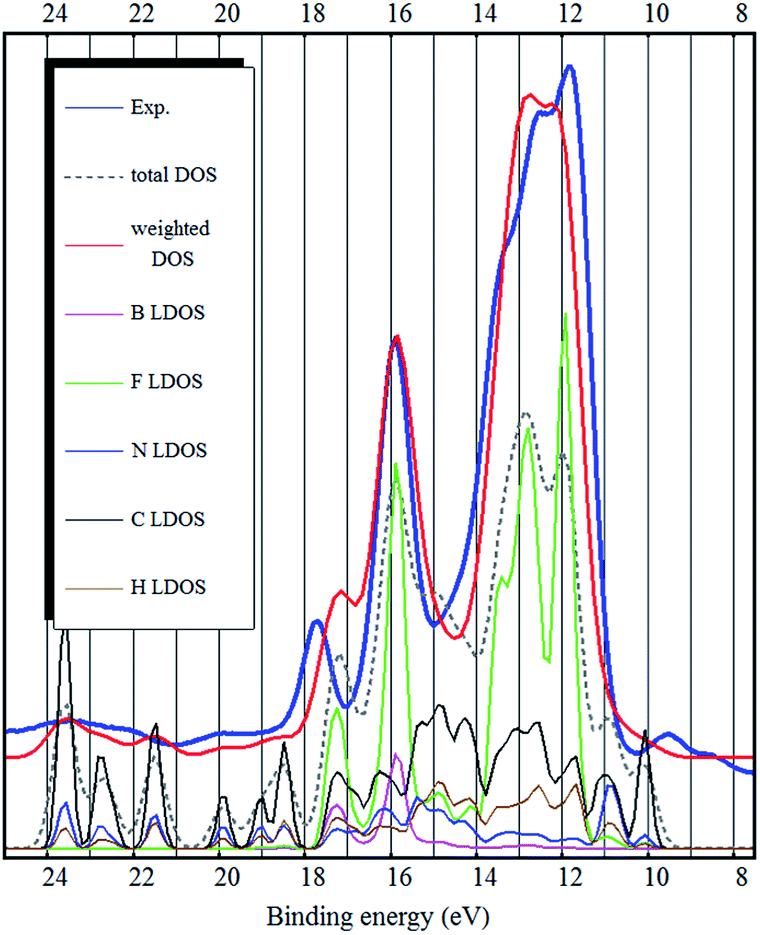 | ||
| Fig. 2 The experimental UPS spectrum of the [EMIM][BF4] ionic liquid (blue curve), the LDA bulk total DOS calculation (dashed gray curve), the LDA bulk DOS calculation weighted to account for photoemission cross sections of different orbitals (red curve) and LDOS of the different elements (curves below). | ||
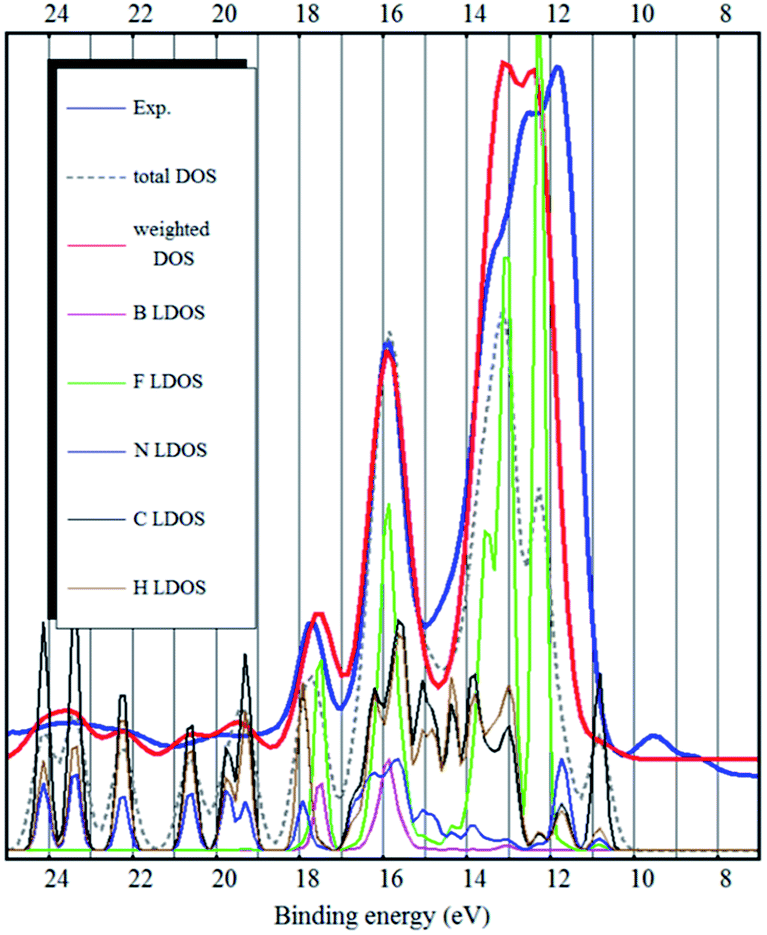 | ||
| Fig. 3 The experimental UPS spectrum of the [EMIM][BF4] ionic liquid (blue curve), the optB88 bulk total DOS calculation (dashed gray curve), the optB88 bulk DOS calculation weighted to account for photoemission cross sections of different orbitals (red curve) and LDOS of the different elements (curves below). | ||
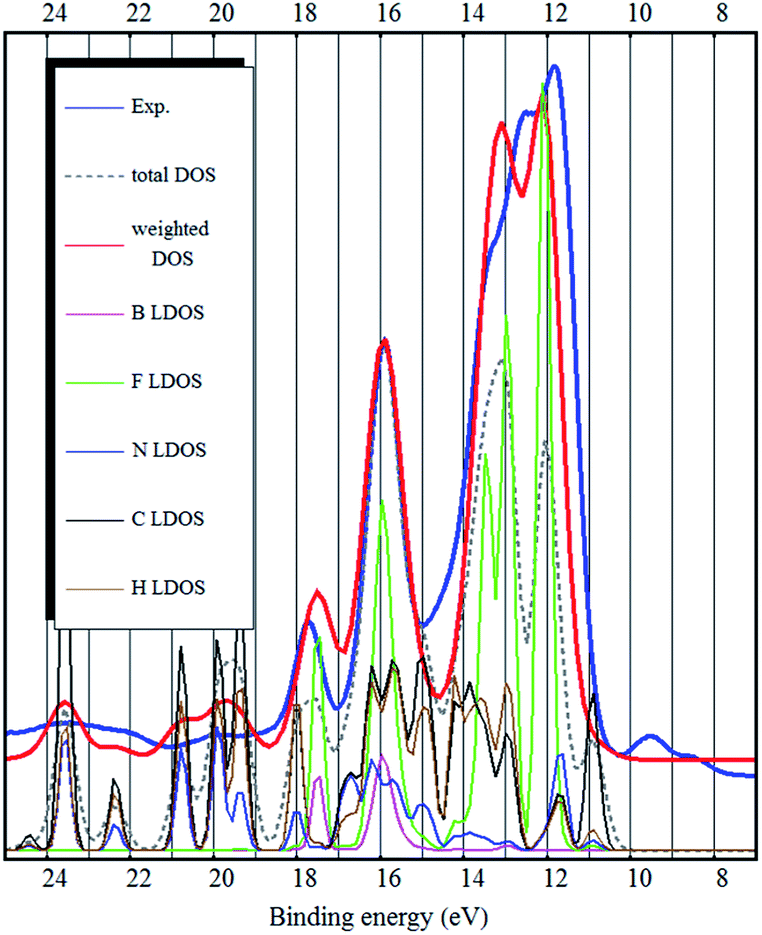 | ||
| Fig. 4 The experimental UPS spectrum of the [EMIM][BF4] ionic liquid (blue curve), the PBE-D3 bulk total DOS calculation (dashed gray curve), the PBE-D3 bulk DOS calculation weighted to account for photoemission cross sections of different orbitals (red curve) and LDOS of the different elements (curves below). | ||
The binding energy range 11–18 eV is mostly dominated by fluorine related states. However, the carbon related states also contribute to the DOS in that energy region (see Fig. 2 and 3). From binding energies of about 18 eV and higher, nitrogen and carbon related states (mostly 2s orbital symmetry) dominate. Hydrogen LDOS is expected to be insignificant due to the low photoemission cross section of hydrogen.17
Both from a practical and from a theoretical point of view the outer valence band and the states near the band gap are the most interesting.2 It was shown that in case of [EMIM][BF4] vapor the photoelectron peaks A–C are not represented in any DFT or hybrid (B3LYP, M06) calculation and only two of the A–C peaks are present in the bare EMIM or the ion-pair [EMIM][BF4] MP2 calculation.6 Ulbrich et al. also noticed that the low binding energy region of the [BMIM][BF4] spectrum is not well reproduced by DFT calculations. Incomplete wetting of the substrate, degradation or possible impurities were proposed as an explanation.8 From EELS studies, it was shown that the π(π*) states of the cation dominate the top of the valence band and bottom of the conduction band in [EMIM][BF4] and [EMIM][Tf2N].24 Only from the MP2 calculation it was possible to assign the A and B peaks to π-bonds in the EMIM cation.6 The same π-states were also present in the DFT calculations, but they were at higher binding energies and “pushed” into the fluorine derived states (the D peak).
The same problem persists in the bulk DFT calculations. The top of the valence band shows up as a shoulder around 10 eV binding energy rather than as a distinct feature as in the experimental spectrum (see Fig. 4). Ulbrich et al. also noticed that in case of the Tf2N anion, the width of the low binding energy region is underestimated by the DFT calculation.8 The GGA DFT calculation of Valencia et al. showed that the anion and cation related states are close near the top of the valence band (about 1.5 eV separation). The DOS calculation with the standard PBE-GGA functional (not shown, but similar to Fig. 4) also confirms this, as the top of the valence is close to the fluorine 2p states and the shoulder representing the top of the valence band (near 10 eV) is not visible at all. Crucially however, the LDA bulk calculation produces a low binding energy shoulder, which does not exist in the ion-pair DFT calculation (Fig. 1 and 2).
It was pointed out by Izgorodina, that in the case of ionic liquids, dispersion energy can surprisingly be compared to the Coulomb energy in some cases.25,26 The high importance of dispersion in ionic liquids may be surprising at a first glance. However, π–π stacking interactions between imidazolium rings, vdW forces between alkyl chains27 and even between cation–anion are important.26,28
Recently, Lage-Estebanez et al. showed that traditional DFT without dispersion correction may be poor for the description of ionic liquid ion-pairs.29 The inability to predict molecular crystal structures is one of the most notorious failures of traditional DFT methods.30 As pointed out by Valencia et al. and other works, DFT (both LDA and GGA) is not particularly suitable for the description of ionic-liquid crystals due to its inherent lack of correct description of the intermolecular dispersive interactions (non-local vdW interactions).15,31 Similarly, Zahn et al. suggested that traditional functionals, which do not account for dispersion, should be avoided in the calculation of ionic liquids.28 This is not due to the well-known exchange-hole or self-interaction problem of DFT, because the addition of some (correct) HF exchange, as in the case of hybrids, does not significantly improve the results.28,29 This may also explain why hybrid functionals failed to correctly describe the outer valence states in [EMIM][BF4] vapor.6 The M06 functional is often recommended28,32 when the dispersion interaction is important, but it offers little improvement (not shown) in the description of the electronic structure of the [EMIM][BF4] vapor. In other words, it is still unable to describe the top of the valence states correctly. Some authors don't recommend the M06 functional without further dispersion corrections.33
It has been suggested that the PBE-GGA error on structural properties is (nearly exclusively) due to its neglect of dispersion interactions.15 It is well known that LDA overbinds and can give surprisingly good results in systems with strong dispersion while actually not describing dispersion at all.27,33 This surprising performance is due to the cancellation of two errors with opposite sign.15,27 Overall, this explains why the LDA calculated DOS (see Fig. 2) describes the experimental spectrum better than the standard PBE-GGA (not shown, but similar to Fig. 4).
Currently, dispersion can be included in DFT by two main methods. Firstly, there are functionals that include dispersion forces by adding pairwise potential (between different atoms) correction terms to the calculation. The most widely used examples of this idea are the D2 (ref. 34) and D3 (ref. 35) corrections due to Grimme and the Tkatchenko–Scheffler correction scheme.36 These correction terms can be added to any functional, only PBE-D3 was studied here.
The second class of functionals are the vdW-DF based functionals which are derived from the plasmon pole model and use a fully nonlocal correlation functional. These functionals are able to describe both covalent and vdW interaction in a seamless fashion14 and should suit our purposes.
However, the vdW-DF family has grown quite large and it is difficult to select the most appropriate functional. Klimeš et al. showed that revPBE-vdW and rPW86-vdW (vdW1 and vdW2) lead to large overestimations of lattice constants and underestimation of bulk moduli and atomization energies for most solids.37,38 vdW1 consistently overestimates the cell volumes on molecular crystals.30 In their work on similar ionic liquids Kohanoff et al. were able to get best results with revPBE (κ = 1) functional and vdW corrections.27 The parameter κ = 0.804 in PBE, κ = 1.245 in revPBE and κ = 1.0 in revPBE (κ = 1).27 The optPBE functional is a further enhancement of the revPBE (κ = 1) functional by fitting the μ parameter to the S22 dataset (22 molecular duplexes). Similarly, the optB88 functional is the B88 functional modified to best fit the S22 dataset.39
The C09 exchange functional of Cooper should offer improvements to the vdW-DF calculations, as it corrects the overestimation of separation distances of vdW1 and vdW2.30,40 A new development of the vdW nonlocal correlation functional family – LV-PW86 or vdW-DF-cx (to be referred to simply as CX) – has excellent description of both sparse and dense matter.30,38,41,42 The B86R (rev-vdW-DF2) functional proposed by Hamada, is also a very recent development.14 Berland and Hyldgaard showed that C09 and CX outperform vdW-DF1 and vdW-DF2.38 Berland et al. concluded that CX, optB86b, B86R and C09 should offer good overall description of vdW forces in the vdW-DF framework30 (and also43).
4. Discussion
Firstly, it is of interest to compare the structure of the ab initio calculated ionic liquid crystal to the experimental (XRD) structure. The unit cell volume and the bond lengths should therefore be compared.Similarly to Valencia et al. and Del Popolo et al. we observed that LDA DFT tends to compress the structure (unit cell volume 815.2 Å3 in our case) and GGA DFT tends to expand the unit cell (993.4 Å3 in our case) when compared to the experimental unit cell volume of 929.7 Å3.15,16,31 Adding dispersion correction to GGA (PBE-D3), leads to a somewhat improved unit cell volume of 978.9 Å3. Overall, the PBE-D3 calculation offers the best description of intra- and intermolecular bonds, most bond lengths have very small errors of 0–3% (even the fluorine related distances).
However, the hydrogen related distances (C–H, H–H) are consistently overestimated (by about 13%) by all dispersion functionals studied here. This cannot be due to the neglect of zero point energy or vibrations in our calculation. The reason could be experimental uncertainty in determining the positions of light hydrogen atoms as suggested by Del Popolo et al.15
Overall, the vdW-DF based functionals revPBE (κ = 1), optPBE, optB88, C09, CX and B86R predict a similar structure. The bond lengths in the backbone of the imidazolium ring are described very well indeed, with errors around 1–2%, similar to ref. 15. The most significant deficiency in the vdW-DF calculated structure is the overestimation of the fluorine related bonds, which may have relatively large errors (up to 12%). This problem is alleviated when the LDA local correlation part of the functional is omitted. For example, the overestimation of the B–F bonds in case of the CX functional is reduced from 8.8% to 3.4%. The improved fluorine atom positions also result in better electronic structure.
Intermolecular distances were estimated from C–C distances between adjacent cations. PBE-D3 and most vdW-DF functionals reproduced this excellently with an average absolute error of about 2% or less, similar to the results of Kohanoff et al.27
However, the quality of crystal structure description is not directly correlated to the prediction of the correct electronic structure. For example, LDA underestimates the cell volume but provides the best description of the top of the valence band. The structure predicted by PBE-D3 agrees best with the experiment, but the modelled electronic spectrum does not so. revPBE (κ = 1) and B86R predict a crystal structure similar to the other vdW-DF functionals, but the electronic structure is not as accurate (not shown) as the best vdW-DF functionals – CX and optB88. optPBE and C09 functionals also produce good results. revPBE (κ = 1) seems to be inferior to the other vdW-DF functionals studied here, which is not surprising, since it also performs the worst on the S22 dataset.37
Although they are based on different functionals (Becke 88, Perdew–Wang 86r), optB88 and CX produce similar electronic structures (see Fig. 3, only optB88 is shown here). The modelled spectra are qualitatively very good. The inner valence band peaks at 15 eV and higher binding energies are excellently reproduced – both positions and intensities. The strongest peak (at 11–14 eV binding energy), which is mostly due to fluorine, is slightly too narrow and the peaks A and B (binding energies 8–10 eV) of the top of the valence band are still shifted by about 2.5 eV to high binding energies.
It is difficult to pinpoint the reason for this discrepancy, it may stem from the overestimation of the fluorine related distances (B–F, H–F, C–F). PBE-D3 has more accurate anion–cation distances and also produces better width and position of the strongest peak in the spectrum. If the crystal structure is artificially compressed then the vdW-DF calculated electron structure improves considerably in the region of interest (8–15 eV) with the expense of the inner valence band (binding energies 15 eV and higher). This is further supported by the fact that LDA tends to underestimate most distances and the LDA modelled spectrum (see Fig. 2) actually has the top of the valence band (A and B peaks) situated closest to the experimental energies.
Overall, the spectra modelled by the CX and optB88 vdW-DF functionals match the experimental UPS spectrum quite closely. The calculated electronic structure is therefore qualitatively much improved (over standard GGA) by the vdW-DF non-local functionals. CX and optB88 also show the best performance on the S22 dataset.38–40 However, this performance is measured only by comparing binding energies, not by the accuracy of the electronic structure.
Grimme dispersion correction (D3) only slightly changes the electronic structure calculated by the PBE functional (see Fig. 4). However, applying Grimme dispersion correction is still not sufficient to obtain qualitatively good description of the electronic structure.
The bulk calculations also confirm the conclusion that the top of the valence band (and the HOMO state in the ion-pair) is imidazolium related (mostly carbon LDOS, as seen in Fig. 2 and 3) and there is very little contribution from the fluorine atoms.
We believe that in ionic liquids the energy gaps are very similar in solid, liquid and vapor phase. The low binding energy tail of the peak A is about 7.4 eV – also similar to the gas phase. Kanai et al. claimed a HOMO–LUMO gap of 7.2 eV in [BMIM][BF4].44 Kanai et al. also showed by both XPS and SXES that the energy gap in [BMIM][PF6] is around 7.2 eV.45 Nishi et al. estimated the HOMO–LUMO gap to be 7.2 eV for both [BMIM][PF6] and [BMIM][BF4].2 The HOMO–LUMO gap was shown to be about equal to the photodissociation threshold of [EMIM][BF4]: 7.4 eV in case of vapor.5,6 Therefore, the band gap of the bulk should have a similar value.
Valencia et al. calculated the HOMO–LUMO gap of the ion-pair and the bandgap of the solid to be almost equal at about 4.8 eV. Our calculation of the HOMO–LUMO gap (4.76 eV) of the [EMIM][BF4] ion-pair in the plane-wave basis using the GGA (PBE) approximation confirms this value. Haskins et al. have calculated a similar value (4.66 eV).46 Del Popolo et al. calculated the energy gap to be 4.7–4.8 eV in [MMIM or EMIM or BMIM][PF6].15
Only the full geometry optimized bulk calculation in the LDA approximation underestimates the bandgap substantially – 3.1 eV. There is little variation in the band gap estimate of the vdW-DF functionals. revPBE (κ = 1), optB88, C09, CX and B86R all predict a 4.8–5.0 eV band gap. Applying the dispersion correction to the PBE calculation (PBE-D3) did not change the band gap estimate – 4.92 eV.
5. Conclusions
UPS valence band spectrum of the [EMIM][BF4] ionic liquid has been recorded and analyzed. The liquid phase UPS spectrum shows many similarities to [BMIM][BF4] liquid and [EMIM][BF4] gas phase spectra, as expected.PBE-D3 can indeed predict accurately the structure of the ionic liquid, with most bonds lengths have errors below 2%. The unit cell volume is still overestimated by about 5%. However, similarly to the results of Kohanoff et al.,27 we found that most bond lengths are still somewhat overestimated by DFT functionals. Fluorine related bonds have relatively large errors in the structure optimized by the vdW-DF based functionals.
Similarly to the case of ionic liquid vapor, DFT has some shortcomings in the description of the electronic structure of bulk ionic liquids, most importantly the low accuracy in the description of the top of the valence band. Standard DFT calculations “push” the cation related bands of top of the valence band too close to the anion related bands, while the experimental spectrum clearly shows a separation between them.
The inclusion of dispersion interactions by using the recently developed vdW-DF functionals was shown to greatly improve the description of the valance band of the ionic liquid. The functionals optB88 and CX, which show the lowest error (smallest deviation from high accuracy quantum chemical calculations) on the S22 dataset also provide the best qualitative description of the electronic structure of the ionic liquid. The c09 and optPBE functionals also perform well.
Almost all DFT based calculations produce the same band gap value – about 4.9 eV for [EMIM][BF4], while the experimental value is about 7.4 eV. The underestimation of the bandgap and the small quantitative accuracy in the description of the top of the valence band are the main issues that need to be noted. Therefore, further progress needs to be made in developing suitable functionals for these kind of systems.
Asides the top of the valence band, there is an excellent agreement between the experimental UPS spectrum and the ab initio reconstructed (DOS weighted by photoemission cross sections) spectra. When the abovementioned shortcomings are addressed, DFT provides a very powerful and relatively low-cost tool for the study of ionic liquids.
Conflicts of interest
There are no conflicts to declare.Acknowledgements
Financial support by the Estonian Ministry of Education and Research (target-financed theme IUT2-25) and Estonian Centre of Excellence TK141 “Advanced Materials and High-Technology Devices for Sustainable Energetics, Sensorics and Nanoelectronics” are gratefully acknowledged. The ab initio computations were carried out at the High Performance Computing Center of University of Tartu, with support provided by I. Koppel. The help provided by R. Ruus with the ab initio calculations is gratefully acknowledged.References
- P. Wasserscheid and T. Welton, Ionic liquids in synthesis, WILEY-VCH Verlag GmbH & Co., Weinheim, 2008 Search PubMed.
- T. Nishi, T. Iwahashi, H. Yamane, Y. Ouchi and K. K. Kanai, Chem. Phys. Lett., 2008, 455, 213–217 CrossRef.
- D. Yoshimura, T. Yokoyama, T. Nishi, H. Ishii, R. Ozawa, H. Hamaguchi and K. Seki, J. Electron Spectrosc. Relat. Phenom., 2005, 144–147, 319–322 CrossRef.
- T. Cremer, C. Kolbeck, K. R. Lovelock, N. Paape, R. Wölfel, P. S. Schulz, P. Wasserscheid, H. Weber, J. Thar, B. Kirchner, F. Maier and H.-P. Steinrück, Chem.–Eur. J., 2010, 30, 8929 CrossRef.
- I. Kuusik, M. Tarkanovskaja, J. Kruusma, V. Reedo, R. Välbe, A. Lõhmus, V. Kisand, E. Lust, E. Kukk and E. Nõmmiste, RSC Adv., 2015, 5(9), 6834–6842 RSC.
- I. Kuusik, M. Tarkanovskaja, J. Kruusma, V. Kisand, A. Tõnisoo, E. Lust and E. Nõmmiste, J. Mol. Liq., 2016, 223, 939–942 CrossRef.
- R. Cooper, A. M. Zolot, J. A. Boatz, D. P. Sporleder and J. A. Stearns, J. Phys. Chem. A, 2013, 117, 12419–12428 CrossRef PubMed.
- A. Ulbrich, M. Reinmöller, W. J. D. Beenken and S. Krischok, J. Mol. Liq., 2014, 192, 77–86 CrossRef.
- M. Patanen, S. Urpelainen, M. Huttula, R. Sankari, V. Kisand, E. Nõmmiste, E. Kukk, H. Aksela and S. Aksela, Phys. Rev. A: At., Mol., Opt. Phys., 2009, 80, 013414 CrossRef.
- X. Gonze, F. Jollet, F. A. Araujo, D. Adams, B. Amadon, T. Applencourt, C. Audouze, J.-M. Beuken and J. Bieder, Comput. Phys. Commun., 2016, 205, 106–131 CrossRef.
- M. Torrent, F. Jollet, F. Bottin, G. Zerah and X. Gonze, Comput. Mater. Sci., 2008, 42, 337 CrossRef.
- J. P. Perdew and Y. Wang, Phys. Rev. B: Condens. Matter Mater. Phys., 1992, 45, 13244 CrossRef.
- J. P. Perdew, K. Burke and M. Ernzerhof, Phys. Rev. Lett., 1996, 77, 3865 CrossRef PubMed.
- I. Harada, Phys. Rev. B: Condens. Matter Mater. Phys., 2014, 89, 121103(R) CrossRef.
- M. G. Del Popolo, C. Pinilla and P. Ballone, J. Chem. Phys., 2007, 126, 133705 CrossRef PubMed.
- A. R. Choudhury, N. Winterton, A. Steiner, A. I. Cooper and K. A. Johnson, J. Am. Chem. Soc., 2005, 127, 16792–16793 CrossRef PubMed.
- M. Reinmöller, A. Ulbrich, T. Ikari, J. Preis, O. Höfft, F. Endres, S. Krischok and W. J. D. Beenken, Phys. Chem. Chem. Phys., 2011, 13, 19526–19533 RSC.
- J. Cornil, S. Vanderdonckt, R. Lazzaroni, D. A. Santos, G. Thys, H. J. Geise, L. M. Yu and M. Szablewski, Chem. Mater., 1999, 11, 2436–2443 CrossRef.
- J. J. Yeh, Atomic Calculation of Photoionization Cross-Sections and Asymmetry Parameters, Gordon and Breach Science Publishers, Langhorne, PE (USA), 1993 Search PubMed.
- J. J. Yeh and I. Lindau, At. Data Nucl. Data Tables, 1985, 32, 1–155 CrossRef.
- T. Ikari, A. Keppler, M. Reinmöller, W. J. D. Beenken, S. Krischok, M. Marschewski, W. Maus-Friedrichs, O. Höfft and F. Endres, e-J. Surf. Sci. Nanotechnol., 2010, 8, 241–245 CrossRef.
- D. Strasser, F. Goulay, M. S. Kelkar, E. J. Maginn and S. R. Leone, J. Phys. Chem. A, 2007, 111, 3191–3195 CrossRef PubMed.
- T. Kurisaki, D. Tanaka, Y. Inoue, H. Wakita, B. Minofar, S. Fukuda, S. Ishiguro and Y. Umebayashi, J. Phys. Chem. B, 2012, 116, 10870–10875 CrossRef PubMed.
- K. Regeta, C. Bannwarth, S. Grimme and M. Allan, Phys. Chem. Chem. Phys., 2015, 17, 15771 RSC.
- E. I. Izgorodina, Phys. Chem. Chem. Phys., 2011, 13, 4189–4207 RSC.
- E. I. Izgorodina, Z. L. Seeger, D. L. A. Scarborough and S. Y. S. Tan, Chem. Rev., 2017, 117, 6696–6754 CrossRef PubMed.
- J. Kohanoff, C. Pinilla, T. G. A. Youngs, E. Artacho and J. M. Soler, J. Chem. Phys., 2011, 135, 154505 CrossRef PubMed.
- S. Zahn, D. R. MacFarlane and E. I. Izgorodina, Phys. Chem. Chem. Phys., 2013, 15, 13664–13675 RSC.
- I. Lage-Estebanez, L. del Olmo, R. Lopez and J. M. G. de la Vega, J. Comput. Chem., 2017, 38, 530–540 CrossRef PubMed.
- K. Berland, V. R. Cooper, K. Lee, E. Schröder, T. Thonhauser, P. Hyldgaard and B. I. Lundqvist, Rep. Prog. Phys., 2015, 78, 066501 CrossRef PubMed.
- H. Valencia, M. Kohyama, S. Tanaka and H. Matsumoto, J. Chem. Phys., 2009, 131, 244705 CrossRef PubMed.
- E. I. Izgorodina, U. L. Bernard and D. R. MacFarlane, J. Phys. Chem. A, 2009, 113, 7064–7072 CrossRef PubMed.
- N. Marom, A. Tkatchenko, M. Rossi, V. V. Gobre, O. Hod, M. Scheffler and L. Kronik, J. Chem. Theory Comput., 2011, 7, 3944–3951 CrossRef PubMed.
- S. Grimme, J. Chem. Phys., 2006, 124, 034108 CrossRef PubMed.
- S. Grimme, J. Antony, S. Ehrlich and H. Krieg, J. Chem. Phys., 2010, 132, 154104 CrossRef PubMed.
- A. Tkatchenko and M. Scheffler, Phys. Rev. Lett., 2009, 102, 073005 CrossRef PubMed.
- J. Klimeš, D. R. Bowler and A. Michaelides, Phys. Rev. B: Condens. Matter Mater. Phys., 2011, 83, 195131 CrossRef.
- K. Berland and P. Hyldgaard, Phys. Rev. B: Condens. Matter Mater. Phys., 2014, 89, 035412 CrossRef.
- J. Klimes, D. R. Bowler and A. Michaelides, J. Phys.: Condens. Matter, 2010, 22, 022201 CrossRef PubMed.
- V. R. Cooper, Phys. Rev. B: Condens. Matter Mater. Phys., 2010, 81, 161104 CrossRef.
- L. Gharaee, P. Erhart and P. Hyldgaard, Phys. Rev. B, 2017, 95, 085147 CrossRef.
- T. Rangel, K. Berland, S. Sharifzadeh, F. Brown-Altvater, K. Lee, P. Hyldgaard, L. Kronik and J. B. Neaton, Phys. Rev. B, 2016, 93, 115206 CrossRef.
- S. Yanagisawa, K. Okuma and T. H. I. Inaoka, J. Electron Spectrosc. Relat. Phenom., 2015, 204, 159–167 CrossRef.
- K. Kanai, T. Nishi, T. Iwahashi, Y. Ouchi, K. Seki, Y. Harada and S. Shin, J. Electron Spectrosc. Relat. Phenom., 2009, 174, 110–115 CrossRef.
- K. Kanai, T. Nishi, T. Iwahashi, Y. Ouchi, K. Seki, Y. Harada and S. Shin, J. Chem. Phys., 2008, 129, 224507 CrossRef PubMed.
- J. B. Haskins, C. W. Bauschlicher and J. W. Lawson, J. Phys. Chem. B, 2015, 119(46), 14705–14719 CrossRef PubMed.
| This journal is © The Royal Society of Chemistry 2018 |