 Open Access Article
A systematic approach to measure the contents of mono- and di-sulfonates in petroleum sulfonates by the novel method of acid–base titration coupled with traditional two-phase titration
Yawei Duana,
Jingge Fenga,
Youyi Zhub,
Hongda Li a,
Xintong Liua,
Hualei Zhou*a and
Wenjun Li
 a
a
aBeijing Key Laboratory for Science and Application of Functional Molecular and Crystalline Materials, University of Science and Technology Beijing, Beijing 100083, China. E-mail: hlzhou@ustb.edu.cn
bResearch Institute of Petroleum Exploration and Development, China National Petroleum Corporation, Beijing 100083, China
First published on 15th November 2018
Abstract
Petroleum sulfonates are broadly employed to increase the oil recovery efficiency in tertiary recovery, while the content of di-sulfonates in petroleum sulfonates is a critical factor in the flushing efficiency, because it adversely impacts the decrease of oil-water interfacial tension. Thus far, no methods have been considered convenient and reliable to determine the contents of mono- and di-sulfonates besides the traditional extraction method. This study established a simple and practical approach of acid–base titration coupled with traditional two-phase titration to measure the contents of mono- and di-sulfonates in petroleum sulfonates. To judge the reliability of the approach, the actives of petroleum sulfonates were separated into mono- and di-sulfonates using the traditional extraction method, the separation effect of which was confirmed using infrared spectroscopy and main elemental analysis. As the results demonstrated, all the contents of di-sulfonates in four petroleum sulfonates measured by the acid–base titration method are similar to those found by the extraction method. The contents of di-sulfonates (%) in four petroleum sulfonate samples were measured by comparing acid–base titration with the extraction method; respectively they were 8.57/8.19, 5.67/5.98, 5.61/5.35 and 2.37/2.15; the relative error of the measured di-sulfonates is about 6%, which satisfies the titration accuracy of petroleum sulfonates. In parallel experiments, the results of five acid–base titrations are very close, and the precision of the acid–base titration method was about 3%. Accordingly, this systematic approach by combining the new acid–base titration and traditional two-phase titration is of great significance to develop the evaluation system of petroleum sulfonates.
1 Introduction
Crude oil, as a non-renewable resource, has currently faced depletion and huge differences between exploitable reserves and explored reserves.1–4 Oil exploitation can fall into three stages, i.e., primary, secondary and tertiary recovery. After the secondary recovery, 60–70% of the residual crude oil still remains in the ground and should be exploited using physical, chemical and other technical methods known as tertiary recovery.5–9 Chemical flooding is the major method of tertiary recovery. Whether they serve as the main agent or as an accessory ingredient in chemical flooding, surfactants are indispensable for improving the recovery rate.10–13 Petroleum sulfonates have become a hotspot of current surfactant research in tertiary oil recovery, by virtue of their low cost, good compatibility with crude oil, and excellent emulsifying ability.14,15Petroleum sulfonates originate from the sulfonation of aromatic crude oil distillate or furfural dewaxing oil distillate.16 The obtained crude products basically fall into four components, i.e., volatile components, inorganic salt, unsulfonated oil and actives.17–19 Up to now, there are two main methods for evaluating petroleum sulfonates, one is the gravimetric method and the other is the two-phase titration method.20,21 Nevertheless, these two methods can only measure the contents of actives, while the contents of mono- and di-sulfonates in petroleum sulfonates cannot be accurately measured. For further evaluating the petroleum sulfonates, the actives of petroleum sulfonates are considered consisting of mono-sulfonates, di-sulfonates and poly-sulfonates; generally, the di-sulfonates and poly-sulfonates are collectively called di-sulfonates as the amount of poly-sulfonates is rather small.22 In petroleum sulfonates, mono-sulfonates play a major role in decreasing interfacial tension of oil-water.23 On the contrary, di-sulfonates in petroleum sulfonate could adversely impact the decrease of interfacial tension of oil–water; also, it occupies the contents of the practical active substance in petroleum sulfonates, and then affects the oil displacement effect.23 It is well-known that the traditional extraction method can be used to directly separate and achieve the mono- and di-sulfonates from the petroleum sulfonates;24 nevertheless, this method needs to take a large amount of time (3–4 days) to complete a whole separation process by using high-dose organic solvents. Additionally, HPLC is inappropriate for evaluating the petroleum sulfonates, because the standard sample as a reference is unavailable due to much more complex composition of petroleum sulfonates, though some studies reported that was applied for the detection of mono- and di-sulfonates.25,26 Accordingly, it is of great significance to explore a rapid and pollution-free approach to ultimately determine the contents of mono- and di-sulfonates in petroleum sulfonates.
The interaction of two adjacent sulfonate radicals in a conjugated pi bond of di-sulfonates may decrease the acidity of the one of the sulfonate radicals; pH titration may serve as a very simple and rapid method to detect the contents of weak acid ions. In this work, the contents of di-sulfonates in petroleum sulfonates can be measured given that the pH change of the binary weak acid ions will be abrupt after the first complete hydrolysis. Then, the content of mono-sulfonates could be calculated by the difference between the contents of actives by traditional two-phase titration and di-sulfonates by acid–base titration. The approach of acid–base titration coupled with two-phase titration gives a novel strategy to systematically evaluate the oil displacement performance of petroleum sulfonates by determining the contents of mono- and di-sulfonates in petroleum sulfonates.
2 Experimental
2.1 Instruments and reagents
The pH meter was manufactured by Leici company model PHS-3C, and a 5 mL microburette was employed. The infrared spectra of samples were performed using a fourier transform infrared (FTIR) spectrophotometer (Nicolet iS10, Thermo, USA). The elemental analyses of actives, mono- and di-sulfonates were measured by elemental analyzer (Vario MACRO cube, Elementar, Germany). The four petroleum sulfonate samples used in the experiments were offered by Daqing oilfield in China, and they were marked as sample 1, sample 2, sample 3 and sample 4, respectively. All chemicals were used after received with no further purification.2.2 Acid–base titration of the separated mono-sulfonates, enriched di-sulfonates and untreated petroleum sulfonates
The pH meter was calibrated in a temperature-controlled water bath. Diluted hydrochloric acid solution with certain concentration (4.32 × 10⁻² and 1.14 × 10⁻² mol L−1) was employed to titrate the separated mono-sulfonates, enriched di-sulfonates and untreated petroleum sulfonates, respectively, by using a microburette. After each drop of titrant, the pH values were recorded when the pH meter was comparatively stable. Titration process was not terminated until the pH value was close to 3 when the di-sulfonates were basically titrated.2.3 Two-phase titration of the contents of actives in petroleum sulfonates
5.00 mL mixed indicator (mass ratio of methylene blue and thymol blue is 21![[thin space (1/6-em)]](https://www.rsc.org/images/entities/char_2009.gif) :
:![[thin space (1/6-em)]](https://www.rsc.org/images/entities/char_2009.gif) 1), 5.00 ml sodium sulfate acid solution and 15 mL dichloromethane were added to the 5.00 mL actives solution in a 250 mL conical flask. After each addition, the mixture was titrated with the Hyamine 1622 solution and shaken violently until a color change from bluish violet to bright yellowish green took place in the lower liquid. The volume of consumed Hyamine 1622 solution was recorded and the average molecular weight of the active substance was calculated by the formula.20,21
1), 5.00 ml sodium sulfate acid solution and 15 mL dichloromethane were added to the 5.00 mL actives solution in a 250 mL conical flask. After each addition, the mixture was titrated with the Hyamine 1622 solution and shaken violently until a color change from bluish violet to bright yellowish green took place in the lower liquid. The volume of consumed Hyamine 1622 solution was recorded and the average molecular weight of the active substance was calculated by the formula.20,21Then the actives solution was changed into petroleum sulfonates solution, repeating the above steps, and calculated the contents of the active substances in the sample by the formula.
2.4 Separation of petroleum sulfonates
The separation process of petroleum sulfonates was presented in Fig. 1. Petroleum sulfonate samples were heated to 120 °C and maintained for several hours until the weight was constant. After cooling to ambient temperature, the non-volatile leftovers were alternately washed with hot ethanol and petroleum ether until the color turned white to remove the insoluble inorganic salt, and the washing solution should be overall collected. Next, the obtained washing solution was dried to volatilize the organic solvents.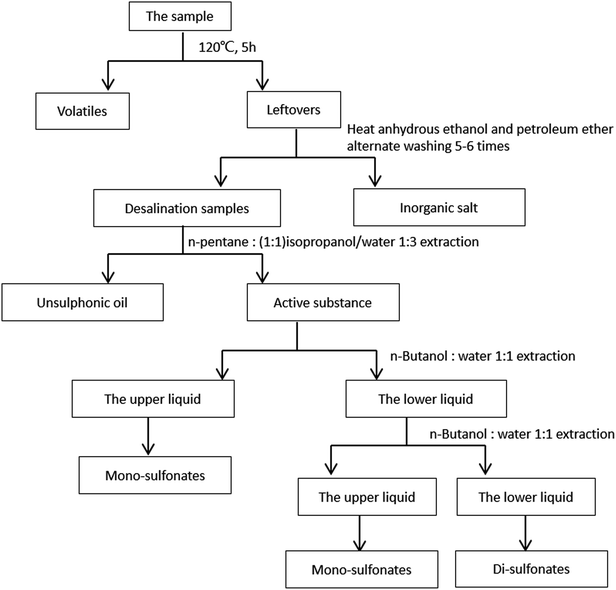 | ||
| Fig. 1 Separation process of petroleum sulfonates.24,27 | ||
Then, the desalination samples were dissolved with 50 mL mixed solvent (50% isopropanol/water, volume ratio), and transferred into a separatory funnel. The dissolved mixtures were repeatedly extracted with n-pentane until the supernatant turns into yellowish, and the lower liquid was collected. Then, the back extraction was performed. The actives appeared in the lower liquid, and the unsulfonated oil appeared in the upper liquid.
Finally, the obtained actives were extracted with 1![[thin space (1/6-em)]](https://www.rsc.org/images/entities/char_2009.gif) :
:![[thin space (1/6-em)]](https://www.rsc.org/images/entities/char_2009.gif) 1 n-butanol/water, and the lower liquid was extracted continuously and repeatedly by the same extraction agent. The di-sulfonates appeared in the lower liquid and the mono-sulfonates appeared in the upper liquid.
1 n-butanol/water, and the lower liquid was extracted continuously and repeatedly by the same extraction agent. The di-sulfonates appeared in the lower liquid and the mono-sulfonates appeared in the upper liquid.
3 Results and discussion
3.1 Separation and characterization of petroleum sulfonates
As presented in Fig. 1, the mass fraction of each component of petroleum sulfonates was calculated, and the data are listed in Table 1, and it suggests that the recovery rate of the total product surmounts 98%, which indicates that the crude separation is high in credibility.27,28| Components | The mass fraction/% | The recovery rate/% |
|---|---|---|
| Volatile | 22.38 | 98.37 |
| Inorganic salt | 9.04 | |
| Unsulfated oil | 37.41 | |
| Mono-sulfonates | 21.35 | |
| Di-sulfonates | 8.19 |
To detect the structural property, infrared spectra of mono-sulfonates, di-sulfonates and active samples were determined with the same quality. Fig. 2 shows that the peaks at 1047 and 1195 cm−1 were symmetric stretching vibration and asymmetric stretching vibration of the S![[double bond, length as m-dash]](https://www.rsc.org/images/entities/char_e001.gif) O bond of sulfonate. The peaks close to 1458 cm−1 were an asymmetric deformation vibration and symmetric deformation vibration of –CH3. The peaks at 1635 cm −1 were stretching vibration for the C
O bond of sulfonate. The peaks close to 1458 cm−1 were an asymmetric deformation vibration and symmetric deformation vibration of –CH3. The peaks at 1635 cm −1 were stretching vibration for the C![[double bond, length as m-dash]](https://www.rsc.org/images/entities/char_e001.gif) C bond. The asymmetric stretching vibrations of –CH2– and –CH3 were peaked at 2858 and 2937 cm−1. As the results suggest, both the infrared spectra of actives, mono-sulfonates and di-sulfonates take on the characteristic peaks at 1047 and 1195 cm−1 of sulfonic acid groups, yet the intensity of characteristic peaks for di-sulfonates are obviously higher than that of mono-sulfonates. The intensity of di-sulfonates was almost 1.7 times that of mono-sulfonates at the characteristic peaks of sulfonic acid groups (1047 and 1195 cm−1). This suggests the effective separation of mono- and di-sulfonates.
C bond. The asymmetric stretching vibrations of –CH2– and –CH3 were peaked at 2858 and 2937 cm−1. As the results suggest, both the infrared spectra of actives, mono-sulfonates and di-sulfonates take on the characteristic peaks at 1047 and 1195 cm−1 of sulfonic acid groups, yet the intensity of characteristic peaks for di-sulfonates are obviously higher than that of mono-sulfonates. The intensity of di-sulfonates was almost 1.7 times that of mono-sulfonates at the characteristic peaks of sulfonic acid groups (1047 and 1195 cm−1). This suggests the effective separation of mono- and di-sulfonates.
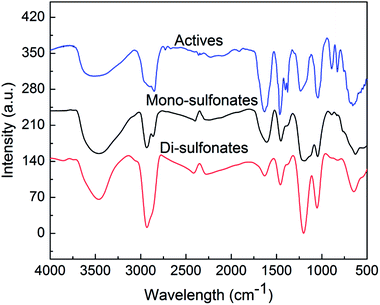 | ||
| Fig. 2 Infrared spectra of the actives, separated mono-sulfonates and enriched di-sulfonates from sample 1. | ||
To further confirm the effect of separation and enrichment, elemental analysis was employed to measure the contents of C, H and S in mono-sulfonates, di-sulfonates and actives, respectively. It is suggested that the element distribution of mono-sulfonates and actives is very similar, yet the relative contents of sulfur element in di-sulfonates is obviously higher than that of actives and mono-sulfonates. Both the results of infrared spectra and elemental analysis prove that mono- and di-sulfonates have been effectively separated (Table 2).
| Elements components | C (%) | H (%) | S (%) |
|---|---|---|---|
| Mono-sulfonates | 60.18 | 7.724 | 8.059 |
| Di-sulfonates | 55.15 | 5.715 | 14.078 |
| Actives | 57.22 | 6.907 | 8.374 |
3.2 Acid–base titration of enriched di-sulfonates and separated mono-sulfonates
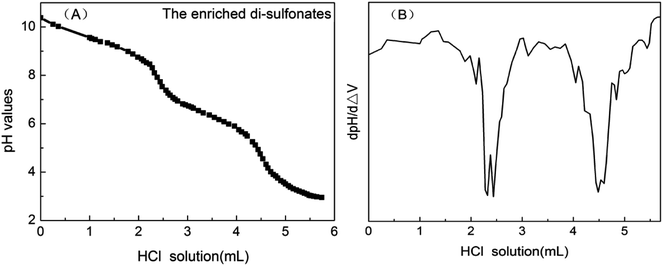
Petroleum sulfonates is sulfonated from aromatics crude oil distillate or furfural dewaxing oil distillate and neutralized with alkali.29,30 Most of petroleum sulfonate products have alkali residues, though neutralization technology and standards vary with producing area. On this cognitive basis and by analyzing the experimental data, the trend of the titration curve can be reasonably predicted. As presented in Fig. 3, there were two obvious leaps appearing in the titration curve of the dilute hydrochloric acid with known concentration and enriched di-sulfonates from sample 1. Assume that the first leap was attributed to the reaction between strong acid titrant and excessive strong alkali in petroleum sulfonates, and the second one was the end point of titration for either of two sulfonic acid groups in di-sulfonates.31 Besides, to confirm the above speculation, appropriate amount of sodium hydroxide were added before the titration, and the result suggested that the sodium hydroxide was involved in the first step of the reaction between highly acidic titrant and strong alkali. As presented in Fig. 4, with the addition of titrant, the tendency of titration curve remained gradual decreasing under the reaction between the titrant and either of sulfonic acid groups in di-sulfonates. According to the titration curves, the pKa values of the di-sulfonates in different petroleum sulfonates are nearly 6, which just satisfies the condition of accurate titration (cKb > 10−8, that is pKa > 4). Thus the second leap was attributed to the effect of added titrant after the complete reaction of the first step hydrolysis. No obvious leap can be observed though another sulfonic acid group could form conjugate acid by hydrolysis. Thus, only one sulfonic acid group in di-sulfonates can be accurately titrated.Fig. 3B is the first-order derivative of Fig. 3A, where the two minimal values of the first derivative corresponding to the stoichiometric points. And the amount of the reacted part in the sample can be calculated by referencing the difference between the two minimal values. When the titrated di-sulfonates solution was at the middle of the two stoichiometric points (semi-metering point), equivalent amount of salt and weak acid was ionized, i.e., the amount of A2− ion were the same as that of HA− presenting in the solution when pKa2 = pH. Accordingly, the pKa2 value of the di-sulfonates in the sample can be acquired from the semi-metering point as above.
The content of di-sulfonates in enriched di-sulfonates samples could be calculated by the follow formula.
In this experiment, the concentration of dilute hydrochloric acid and enriched di-sulfonates solution were 4.32 × 10⁻² mol L−1 (C2) and 6.11 g L−1 (C1) (with the dosage of 10 mL (V1)), respectively. Thus, the mass of enriched di-sulfonates samples was 0.0611 g. And the titrimetric volume of reacting dilute hydrochloric acid was 2.205 mL (V2). Thus, the amount of di-sulfonates can be calculated as 9.526 × 10⁻⁵ mol, and the contents of di-sulfonates as 1.559 × 10⁻³ mol g−1. Given the average equivalent weight of di-sulfonates as 550 g mol−1 (Md),32,33 the titrimetric di-sulfonates mass was 5.2393 × 10⁻² g. Therefore, the calculated contents of di-sulfonates in enriched di-sulfonates samples was 85.75%, which directly suggests that di-sulfonates have been effectively enriched.
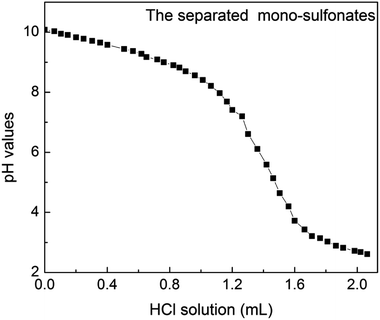
Fig. 5 shows that the titration curve of mono-sulfonates by acid–base titration from sample 1, which displayed merely one jump under the same titration conditions. Thus, the contents of mono-sulfonates cannot be measured by acid–base titration, which could dissatisfy the condition with obvious jump (cKb > 10−8) and the isolated mono-sulfonates had high purity with just a few di-sulfonates.
3.3 Acid–base titration of di-sulfonates with three different additives
Various amounts of unsulfonated oil, mono-sulfonates and inorganic salt were added into the solution of the enriched di-sulfonates from sample 1. Also, to judge whether the existence of those components has observable impacted on the acid–base titration method, the titration process was repeated.Unsulfonated oil was added to the di-sulfonates solution, and then it fell into two phases instantly with no distribution of the unsulfonated oil in the water phase. As a result, the titration process was not affected.
As listed in Table 3, the contents of titrant and di-sulfonates in the titration system were respectively 4.32 × 10⁻² mol L−1 and 6.11 g L−1 (10 mL), and the mass ratios of mono-sulfonates to di-sulfonates were nearly 1![[thin space (1/6-em)]](https://www.rsc.org/images/entities/char_2009.gif) :
:![[thin space (1/6-em)]](https://www.rsc.org/images/entities/char_2009.gif) 5, 1
5, 1![[thin space (1/6-em)]](https://www.rsc.org/images/entities/char_2009.gif) :
:![[thin space (1/6-em)]](https://www.rsc.org/images/entities/char_2009.gif) 1 and 2
1 and 2![[thin space (1/6-em)]](https://www.rsc.org/images/entities/char_2009.gif) :
:![[thin space (1/6-em)]](https://www.rsc.org/images/entities/char_2009.gif) 1, respectively. After the addition of a certain proportion of mono-sulfonates, the consumption of dilute hydrochloric acid titrant remained unchanged, thus suggesting that the mono-sulfonates did not influence the titration of the di-sulfonates within a certain range. The main ions in petroleum sulfonates primarily included Na+, SO42−, Cl− and very small amounts of Ca2+, Mg2+ and NO3−, thus Na2SO4 and NaCl were selected in a mass ratio of 10
1, respectively. After the addition of a certain proportion of mono-sulfonates, the consumption of dilute hydrochloric acid titrant remained unchanged, thus suggesting that the mono-sulfonates did not influence the titration of the di-sulfonates within a certain range. The main ions in petroleum sulfonates primarily included Na+, SO42−, Cl− and very small amounts of Ca2+, Mg2+ and NO3−, thus Na2SO4 and NaCl were selected in a mass ratio of 10![[thin space (1/6-em)]](https://www.rsc.org/images/entities/char_2009.gif) :
:![[thin space (1/6-em)]](https://www.rsc.org/images/entities/char_2009.gif) 1 as the representatives to investigate the effect of the different amounts of inorganic salt on the titration of di-sulfonates. The contents of di-sulfonates in the titration system remained 6.11 g L−1 (10 mL), and the mass ratio of inorganic salt to enriched di-sulfonates was nearly 1
1 as the representatives to investigate the effect of the different amounts of inorganic salt on the titration of di-sulfonates. The contents of di-sulfonates in the titration system remained 6.11 g L−1 (10 mL), and the mass ratio of inorganic salt to enriched di-sulfonates was nearly 1![[thin space (1/6-em)]](https://www.rsc.org/images/entities/char_2009.gif) :
:![[thin space (1/6-em)]](https://www.rsc.org/images/entities/char_2009.gif) 5, 1
5, 1![[thin space (1/6-em)]](https://www.rsc.org/images/entities/char_2009.gif) :
:![[thin space (1/6-em)]](https://www.rsc.org/images/entities/char_2009.gif) 1 and 2
1 and 2![[thin space (1/6-em)]](https://www.rsc.org/images/entities/char_2009.gif) :
:![[thin space (1/6-em)]](https://www.rsc.org/images/entities/char_2009.gif) 1. Similarly, the consumption of titrant has hardly changed.
1. Similarly, the consumption of titrant has hardly changed.
| Amount of added mono-sulfonates/×10−2 g | Consumption of titrant per mL | Amount of added inorganic salt/10−2 g | Consumption of titrant per mL |
|---|---|---|---|
| 0 | 2.207 | 0 | 2.207 |
| 1.22 | 2.211 | 1.22 | 2.209 |
| 6.11 | 2.214 | 6.11 | 2.205 |
| 12.22 | 2.216 | 12.22 | 2.212 |
3.4 Parallel experiments of di-sulfonates by acid–base titration
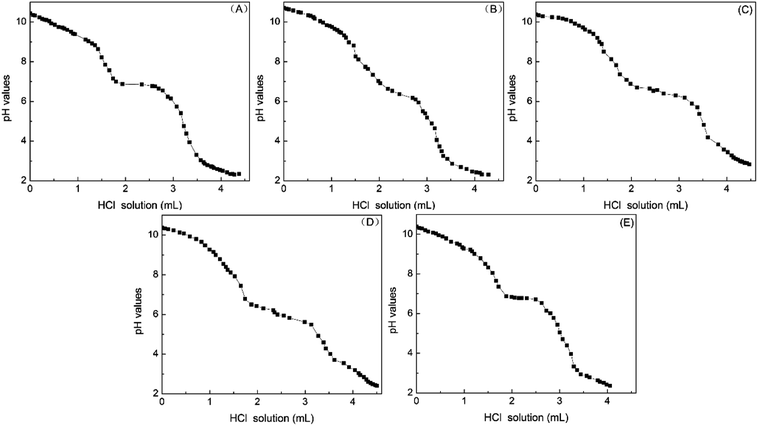
Take the sample 1 as an example. A sample solution with a concentration of 12.57 g L−1 was prepared. Take 10 mL of it, use hydrochloric acid (1.14 × 10⁻² mol L−1) as a titrant, repeat the titration procedure five times, and draw the curve of the pH of sample solution changing with the titrant volume as presented in Fig. 6. After the differential calculus of the curve, the subtraction of the two titrant volumes corresponding to the minimum differential value was calculated; the calculated value is the consumed titrant of di-sulfonates in the petroleum sulfonate samples solution. The results are as listed in Table 4, the average content measured by titration reaches 8.58%, and the relative standard deviation (RSD) of five titrations is 2.9%. It is accordingly suggested that the precision of parallel experiments is minor and acceptable, thus proving that the acid–base titration method has high reproducibility.| No | 1 | 2 | 3 | 4 | 5 |
|---|---|---|---|---|---|
| • The consumed volumes of titrant (mL) | 1.719 | 1.701 | 1.742 | 1.780 | 1.646 |
| • The contents of di-sulfonates (mol g−1) | 1.559 × 10⁻⁴ | 1.543 × 10⁻⁴ | 1.580 × 10⁻⁴ | 1.614 × 10⁻⁴ | 1.493 × 10⁻⁴ |
| • The contents of di-sulfonates measured by titration (%) | 8.57 | 8.48 | 8.70 | 8.88 | 8.21 |
| • RSD (%) | 2.9 |
The possible causes of the experimental errors are as follows: (1) the carbon dioxide in the air may participate in the reaction as a weak acid. Thus the containers were sealed with sealing film, to ultimately eliminate the effect of carbon dioxide to the greatest extent. (2) As the equivalent point cannot be predicted accurately, and the titrant can be merely added at a constant speed during the titration. Accordingly, there may be an error of half a drop in the titrant volume corresponding to the leaps, yet the error can be eliminated by parallel experiment.
3.5 Acid–base titration and two-phase titration of four petroleum sulfonates
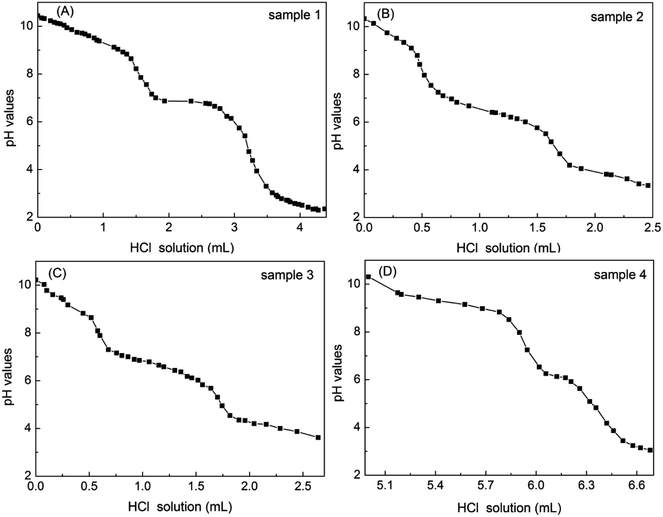
As shown in Fig. 7, the tendency of the titration curves for four petroleum sulfonate samples were similar to that of di-sulfonates. The pH values corresponding to the semi-metering point were the pKa2 values. On the occasion of sample 4 in Fig. 7D, appropriate amounts of NaOH were added before the titration to adjust the pH to 10 or so since the original environment of the solution is acidic.The percentage contents of di-sulfonates of four petroleum sulfonate samples were measured using acid–base titration and extraction method, respectively. The contents of di-sulfonates (the average molecular weight was taken as 550 g mol−1) and the corresponding pKa2 values of four petroleum sulfonates were obtained by conducting differential calculation, as listed in Table 5. Obviously, the relative errors of measured di-sulfonates in four petroleum sulfonate samples were 4.64%, −5.18%, 4.86% and 10.23%, respectively. Sample 1 had the highest contents of di-sulfonates and complied with the characteristic titration curve of weak acid, while sample 4 had the lowest contents of di-sulfonates, and the pKa2 value was much lower than that of the other three ones. This may be attributed to the rather low contents of di-sulfonates in sample 4, and the small titration volume consequently increases the titration error. The contents of actives measured by two-phase titration were 26.59%, 23.66%, 35.73% and 25.07%, respectively. Furthermore, the contents of mono-sulfonates in four petroleum sulfonates can be calculated by the difference between the contents of actives via two-phase titration and di-sulfonates via acid–base titration, respectively were 18.02%, 17.99%, 30.12% and 22.70%. In sample 3 and 4, the content of mono-sulfonates was almost 6 and 10 times that of di-sulfonates, respectively. More mono-sulfonates will be favorable for EOR (enhanced oil recovery), due to mono-sulfonates in petroleum sulfonates play a major role in decreasing interfacial tension of oil-water.23 Accordingly, both the contents of mono- and di-sulfonates in petroleum sulfonates can be estimated by the approach of the acid–base titration coupled with two-phase titration.
| Samples | 1 | 2 | 3 | 4 |
|---|---|---|---|---|
| • The contents of di-sulfonates measured by separation (%) | 8.19 | 5.98 | 5.35 | 2.15 |
| • The contents of di-sulfonates measured by acid–base titration (%) | 8.57 | 5.67 | 5.61 | 2.37 |
| • pKa2 of acid–base titration | 6.74 | 6.49 | 6.68 | 5.95 |
| • Relative error of acid–base titration (%) | 4.64 | −5.18 | 4.86 | 10.23 |
| • The contents of actives measured by two-phase titration (%) | 26.59 | 23.66 | 35.73 | 25.07 |
| • The contents of mono-sulfonates (%) | 18.02 | 17.99 | 30.12 | 22.70 |
4 Conclusion
In conclusion, the results show that the contents of the mono- and di-sulfonates in petroleum sulfonates could be successfully measured by the novel method of acid–base titration coupled with traditional two-phase titration. The relative error of measured di-sulfonates was about 6% by comparing the acid–base titration with extraction method, which satisfies the titration accuracy of petroleum sulfonates. Additionally, there was no impact on the acid–base titration of di-sulfonates with the addition of unsulfonated oil, mono-sulfonates and inorganic salt; the precision of the acid–base titration method was also determined by parallel experiments about 3%, which suggests that it has a high reproducibility. Accordingly, this study established a systematic, less cost and high universality approach to measure the contents of mono- and di-sulfonates in petroleum sulfonates.Conflicts of interest
There are no conflicts of interest to declare.Acknowledgements
We gratefully acknowledge the financial support provided by National Science and Technology Major Project (Grant No. 2016ZX05010-004).References
- S. Shafiee and E. Topal, Energy Policy, 2009, 37, 181–189 CrossRef.
- F. Cherubini, Energy Convers. Manage., 2010, 51, 1412–1421 CrossRef CAS.
- A. Esmaeili and N. Abdollahzadeh, Energy Policy, 2009, 37, 371–374 CrossRef.
- S. Gou, Q. Zhang, C. Yang, Q. Li, S. Xu, Y. Wu and Q. Guo, RSC Adv., 2016, 6, 76696–76706 RSC.
- Q. Shang, S. Xia, G. Cui, B. Tang and P. Ma, Fluid Phase Equilib., 2017, 439, 18–23 CrossRef CAS.
- B. Peng, L. Zhang, J. Luo, P. Wang, B. Ding, M. Zeng and Z. Cheng, RSC Adv., 2017, 7, 32246–32254 RSC.
- S. Iglauer, Y. Wu, P. Shuler, Y. Tang and W. A. Goddard III, J. Pet. Sci. Eng., 2010, 71, 23–29 CrossRef CAS.
- M. Fulazzaky, D. I. Astuti and M. A. Fulazzaky, RSC Adv., 2015, 5, 3908–3916 RSC.
- S. K. Veerabhadrappa, A. Doda, J. J. Trivedi and E. Kuru, Ind. Eng. Chem. Res., 2013, 52, 18421–18428 CrossRef CAS.
- M. Dong, S. Ma and Q. Liu, Fuel, 2009, 88, 1049–1056 CrossRef CAS.
- D. Gogoi, P. Bhagowati, P. Gogoi, N. K. Bordoloi, A. Rafay, S. K. Dolui and A. K. Mukherjee, RSC Adv., 2016, 6, 70669–70681 RSC.
- B. Song, X. Hu, X. Shui, Z. Cui and Z. Wang, Colloids Surf., A, 2016, 489, 433–440 CrossRef CAS.
- B. Adibhatla and K. K. Mohanty, SPE Reservoir Eval. Eng., 2008, 11, 119–130 CrossRef.
- L. He, F. Lin, X. Li, H. Sui and Z. Xu, Chem. Soc. Rev., 2015, 44, 5446–5494 RSC.
- W. Dong, D. Sun, Y. . Li and T. Wu, Environ. Sci.: Water Res. Technol., 2018, 4, 539–548 RSC.
- P. M. Wilson, C. L. Murphy and W. R. Foster, in SPE Improved Oil Recovery Symposium, Society of Petroleum Engineers, 1976, DOI:10.2118/5812-MS.
- D. Zhang, P. Y. Zhang, H. K. Zou, G. W. Chu, W. Wu, Z. W. Zhu and J. F. Chen, Chem. Eng. Process., 2010, 49, 508–513 CrossRef CAS.
- Z. Weng, P. Y. Zhang, G. W. Chu, W. Wang, J. Yun and J. F. Chen, Can. J. Chem. Eng., 2015, 93, 1410–1415 CrossRef CAS.
- W. Zhan, P. Zhang, G. Chu, H. Zou, J. Yun and J. Chen, China Pet. Process. Petrochem. Technol., 2015, 17, 59–68 Search PubMed.
- M. Tsubouchi, N. Yamasaki and K. Yanagisawa, Anal. Chem., 1985, 57, 783–784 CrossRef CAS.
- Z. P. Li, X. M. Gong and Q. Y. Li, Chin. J. Anal. Chem., 1984, 12, 26–29 Search PubMed.
- E. I. Sandvik, W. W. Gale and M. O. Denekas, Soc. Pet. Eng. J., 1977, 17, 184–192 CrossRef CAS.
- Z. Zhao, F. Liu, W. Qiao, Z. Li and L. Cheng, Fuel, 2006, 85, 1815–1820 CrossRef CAS.
- F. Yu, W. Y. Fan, G. Z. Nan, S. P. Li and Y. Z. Duan, Acta Pet. Sin., 2008, 24, 204–210 CAS.
- G. R. Bear, J. Chromatogr. A, 1988, 459, 91–107 CrossRef CAS.
- K. W. McQuigg, G. P. Willhite and M. J. Michnick, in SPE Oilfield and Geothermal Chemistry Symposium, Society of Petroleum Engineers, 1979, DOI:10.2118/7868-MS.
- N. Márquez, S. Gonzalez, N. Subero, B. Bravo, G. Chavez, R. Bauza and F. Ysambertt, Analyst, 1998, 123, 2329–2332 RSC.
- Z. Feng, M. Cui, J. Liu, Y. Song and J. Q. LI, Asian J. Chem., 2014, 26, 6722–6726 CAS.
- D. Zhang, P. Zhang, Z. Haikui, C. H. U. Guangwen, W. U. Wei, Z. H. U. Zhongwu and C. H. E. N. Jianfeng, Chin. J. Chem. Eng., 2010, 18, 848–855 CrossRef CAS.
- Y. Zhu, H. Yuan, Q. Hou, Z. Wang and J. Wu, in SPE Asia Pacific Oil and Gas Conference and Exhibition, Society of Petroleum Engineers, 2010, DOI:10.2118/133419.
- C. W. Pifer, E. G. Wollish and M. Schmall, Anal. Chem., 1953, 25, 310–314 CrossRef CAS.
- Y. Z. Duan, Y. Li, W. Y. Fan, F. Yu, S. Li and G. Nan, J. Dispersion Sci. Technol., 2009, 30, 1324–1332 CrossRef CAS.
- F. A. Rojas-Ruiz, A. Gómez-Escudero, Z. Pachón-Contreras, A. Villar-García and J. A. Orrego-Ruiz, Energy Fuels, 2016, 30, 2714–2720 CrossRef CAS.
| This journal is © The Royal Society of Chemistry 2018 |


