 Open Access Article
The tunable spin reorientation, temperature induced magnetization reversal, and spontaneous exchange bias effect of Sm0.7Y0.3Cr1−xGaxO3
Zhijie Maa,
Guanghui Liua,
Weijun Gaoa,
Yuzhuang Liub,
Liang Xiec,
Xuemin Hea,
Liqing Liua,
Yongtao Lia and
Hongguang Zhang *ab
*ab
aNew Energy Technology Engineering Laboratory of Jiangsu Province, College of Science, Nanjing University of Posts and Telecommunications, Nanjing 210023, P. R. China. E-mail: hgzhang_njupt@hotmail.com
bCollege of Electronic and Optical Engineering & College of Microelectronics, Nanjing University of Posts and Telecommunications, Nanjing 210023, P. R. China
cDepartment of Physics, North China University of Technology, Beijing 100144, P. R. China
First published on 1st October 2018
Abstract
In this work, we investigated the temperature dependent magnetic properties of SmCrO3 by codoping nonmagnetic ions at Sm- and Cr-sites. The spin reorientation from Γ4 to Γ2 is tuned and the transition temperature TSR is improved dramatically to near the liquid nitrogen temperature by Ga ion doping, which would be helpful to achieve its application in temperature sensitive spintronic devices and magnetic switching devices. An intrinsic temperature induced magnetization reversal effect from positive to negative under zero-field-cooling conditions is induced as well and its reversal evolution is strongly dependent upon doping. Moreover, the zero-field-cooling exchange bias effect still exists and shows a positive exchange bias field although it is suppressed with increase of doping concentration. Under the influence of doping nonmagnetic ions, lattice distortion is induced to some extent and the magnetic interactions of Cr–Cr and Sm–Cr are predominantly diluted, realizing control of the above phenomena. Those phenomena are discussed and successfully explained by considering the magnetic exchange interaction competitions including the isotropic, antisymmetric (or Dzyaloshinskii–Moriya interaction), and anisotropic superexchange interactions.
Introduction
Orthochromites RCrO3 (R = rare-earth) have received great attention recently due to their possessing abundant magnetic effects (such as temperature induced magnetization reversal (TIMR), magnetic exchange bias (EB) effect, and spin reorientation (SR) phase transition), and ferroelectricity, making them a potential candidate for technological applications.1–7 Orthochromites RCrO3 have a distorted orthorhombic perovskite structure (Pbnm space group) with a canted antiferromagnetic structure below the Neel temperature (TN) caused by Dzyaloshinskii–Moriya (DM) exchange coupling between the Cr ions. Three types of antiferromagnetic configurations generally exist in orthochromites, noted in Bertaut notations8 as Γ1(Ax, Gy, Cz, CRz), Γ2(Fx, Cy, Gz, FRx, CRy), and Γ4(Gx, Ay, Fz, FRx). The complex magnetic interactions of Cr–Cr, Cr–R, and R–R in RCrO3, including the isotropic, symmetric, and antisymmetric anisotropic exchange interactions, result in an abundant magnetic phase diagram, such as, multiferroics,4,9 multiple phase transitions,10,11 a magnetic glassy phase,12 TIMR,13–15 conventional EB6 and zero-field-cooling EB (ZEB) effects,14,16 and the SR transition.17One of the most interesting examples of this family is the newly emerging SmCrO3 which possesses two magnetic species, Sm and Cr ions. SmCrO3 is reported to be ordered in Γ4 configuration below TN at 191 K and exhibits a SR transition to Γ2 configuration at 34 K.4,18 There is controversy about the SR transition so far. Gorodetsky et al.,19 reported that below the SR transition temperature (TSR) the magnetic structure of SmCrO3 changes from Γ4 to Γ2 continuously, making a second order transition. Most of the reports suggest that the second-order transition is attributed to a continuous rotation of Cr3+ moments.17,20 There are a few factors that give rise to the second order SR transition, for examples, the antisymmetric exchange interaction between Cr3+ and Sm3+,6 and the exchange splitting and the t–e orbital hybridization between Cr3+ and Cr3+ ions.17 However, Tripathi et al.12 suggested that the SR transition in SmCrO3 would be a first order Morin type SR transition based on the analysis of the existence of phase coexistence and magnetic glass like freezing across TSR, the reason of which is due to the discrete flipping of Cr3+ ions from the high temperature Γ4 to low temperature Γ1 configuration. Very recently, Tripathi et al.21 investigated the thermal evolution of magnetic configuration in SmCrO3 by neutron diffraction and magnetometric study and confirmed that the uncompensated canted antiferromagnetic structure Γ4 occurs below TN, the collinear antiferromagnetic structure Γ1 occurs below 10 K, and a non-equilibrium configuration with co-occurring Γ1 and Γ4 phases occurs at 10 K ≤ T ≤ 40 K. The competition between magnetocrystalline anisotropy and free energy derived from isotropic and antisymmetric exchange interactions among different pairs of magnetic ions is observed to govern the mechanism of SR effect.21 Therefore, the investigation of the SR transition, especially from the view of artificial control of the exchange interactions between chromium and samarium ions, is full of interest and finding its tunable factors and achieving its control will benefit for applications in thermomagnetic power generation, ultrafast spin switching.22,23
Moreover, the complex magnetic exchange interactions of Sm–Cr or/and Cr–Cr and their competitions are mostly considered to be the origin of the TIMR and conventional EB and ZEB effects as well. There was no negative magnetization originally in SmCrO3 itself and the TIMR effect can be induced by transitional metal ions doping, such as, Fe,10,24 and Mn.13,25 Nevertheless, negative magnetization in SmCrO3 will be outstanding due to the intrinsic strong coupling between Sm3+ and Cr3+ spins sublattices,18 which would also be responsible for the existence of EB effect. Due to the coupling between Sm and Cr ions, a ZEB effect appears in SmCrO3.18,20 And nonmagnetic rare-earth ions doping at Sm-site confirm the influence of Sm3+ on the ZEB effect,14,20 which would be of great interest to electric field control of EB devices as it eliminates the requirement of external magnetic field to create the unidirectional anisotropy.
In this work, we investigated the temperature dependent magnetic properties of SmCrO3 by codoping nonmagnetic ions (Y3+ and Ga3+) at Sm- and Cr-sites, respectively. The SR transition from Γ4 to Γ2 is tuned and the transition temperature TSR is improved dramatically to the liquid nitrogen temperature by Ga ions doping. The outstanding intrinsic TIMR effect from positive to negative with temperature decreasing under zero-field-cooling (ZFC) condition are induced as well at an appropriate doping content. Meanwhile, noting that a positive ZEB effect occurs at 5 K and is suppressed by doping and increasing of temperature. Those phenomena are mainly considered to be the competitions among the isotropic exchange interaction of Cr3+, the antisymmetric exchange interaction of Cr3+, the DM interaction, the single-ion magnetocrystalline anisotropy, and the isotropic and antisymmetric interaction of Sm and Cr. The dilution of Cr–Cr coupling by doping will highlight the Sm–Cr coupling, leading to the significant change in SR, TIMR and ZEB effect.
Experimental
Polycrystalline samples of Sm0.7Y0.3Cr1−xGaxO3 (x = 0, 0.1, 0.2, and 0.3) were prepared by conventional solid state reaction method.14,15 High purity (99.9%) oxide of samarium (Sm2O3), yttrium (Y2O3), gallium (Ga2O3) and chromium (Cr2O3) were weighed and mixed at a stoichiometric ratio. The mixtures were first calcined at 1200 °C for 12 h with the heating rate of 2 °C min−1 and cooled down with the furnace. Finally, after regrinding and tableting, the resulting products were sintered at 1400 °C for 12 h with the same heating rate. The samples were obtained after cooling with the furnace.The X-ray diffraction (XRD) measurement was performed by Bruker D8 diffractometer with Cu Kα radiation at room temperature. The working current and voltage were 40 mA and 40 kV respectively and the diffraction angle ranges from 20–70 degree with step of 0.02 degree. And the XRD patterns were refined by Rietveld method using PC-GSAS and EXPGUI programs.26 Measurement of Raman spectra of all samples with a range from 100 to 600 cm−1 were conducted by EZRaman-M Portable Raman System with 532 nm excitation wavelength He–Ne laser. The field-cooling (FC) and ZFC temperature dependent magnetization curves of Sm0.7Y0.3GaxCr1−xO3 (x = 0.1, 0.2, 0.3) samples were measured at the temperature range of 5 K to 300 K under the magnetic field H = 100 Oe by a superconducting quantum interference device (MPMS-XL-7). The p-type magnetic hysteresis data (M–H loop) were recorded at constant 5 K in ZFC mode for Sm0.7Y0.3GaxCr1−xO3 (x = 0.1, 0.2, 0.3) and at various temperatures 5, 35 and 100 K for x = 0.1, at 5, 45 and 100 K for x = 0.2, and at 5, 50 and 100 K for x = 0.3, respectively.
Results and discussion
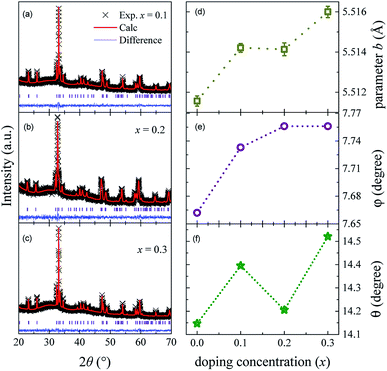
Fig. 1(a–c) shows the XRD patterns of Sm0.7Y0.3Cr1−xGaxO3 (x = 0, 0.1, 0.2 and 0.3) samples. The samples are regarded to be desired pure phase polycrystalline. Rietveld refinement results reveal that samples are the distorted orthorhombic perovskite structure with Pbnm (no. 62) space group, consistent with the parent sample SmCrO3.6,9,14 From Rietveld refinement results, we obtained data of lattice parameters a, b, c, cell volume of samples, the angle of out-of-plane Cr–O1–Cr, and the bond length of out-of-plane Cr–O1, listed in Table 1. It is noticeable that those parameters are not dramatically changed. Lattice parameters a and c both have the tendency to decrease with increasing doping concentration x, while parameter b almost monotonically increases. This results from the fact that the radius of Ga3+ (0.620 Å) ion is a bit larger than that of Cr3+ (0.615 Å). With an incorporation of Ga ions, the degree of crystal structure distortion to some extent increases as well, which leads to the increment of the Cr (Ga)–O bond length and Cr (Ga)–O–Cr bond angle. To quantify the CrO6 distortion, we calculated the angles θ and φ of the CrO6 octahedral based on the two equations θ = cos−1(a/b) and φ = cos−1(√2a/c) respectively,27 listed in Table 1. Angle θ represents the rotation of CrO6 octahedral about (001) axis and angel φ stands for the octahedral tilting about (110) axis. The values of both θ and φ have an upward trend with greater doping concentration x, shown in Fig. 1(e) and (f), which provides an evidence of the enhancement of lattice distortion. by eqn (2), and the coupling coefficient α from eqn (3)
Fig. 2 shows the room temperature Raman spectra of Sm0.7Y0.3Cr1−xGaxO3 (x = 0, 0.1, 0.2 and 0.3) samples. According to group theory, RCrO3 with an orthorhombic (Pbnm) has 24 types of Raman-active modes (7Ag + 5B1g + 7B2g + 5B3g).28 For SmCrO3, excluding some low-intensity modes, 11 modes (5Ag + 2B1g + 2B2g + 2B3g) are detected, which are consistent with reported Raman spectra of SmCrO3.29–31 For only 30% Ga-doped SmCrO3, the shape and position of Raman spectra show inconspicuous changes compared to SmCrO3. Nonetheless, for Sm0.7Y0.3CrO3 sample, the obvious peaks shift of Raman spectra relative to the parent SmCrO3 occurs, which may be related to the prominent structural variations by Y doping, reflected and discussed in the previous work.14 For the Y- and Ga-codoped samples, the Raman spectra are almost the same to that of Sm0.7Y0.3CrO3 sample. This indicates that due to the size effect and the heavier atom of Y than the transitional metal ions Raman modes are led to the obvious shift. Compared to the Raman modes and band position of YCrO3 and SmCrO3,29 we assigned the phonon modes of Sm0.7Y0.3Cr1−xGaxO3 samples, shown in Fig. 2. As is known that the phonon modes in RCrO3 below 200 cm−1 are related to lattice modes involving R atom vibrations and modes above 200 cm−1 consist of various modes involving vibrations of the R atom and oxygen.29–31 Specifically speaking: (1) Ag(3) and Ag(5) are CrO6 octahedral rotations around the crystallographic y-axis and x-axis (Pbnm setting), respectively; (2) B1g(2), B2g(2) and B3g(1) are related to R atomic motions; (3) Ag(6) and B2g(3) arise from bending of the CrO6 octahedral; (4) the B3g(3) mode is related to the antisymmetric stretching vibrations of the O1 and O2 atoms.29 For Sm0.7Y0.3GaxCr1−xO3 (x = 0.1, 0.2 and 0.3) samples, it indicated that Ga-doping does not affect the symmetric structure of the crystal. As doping concentration increases, Ag(5), B3g(1) and B2g(2) modes have a different degree of offset, in which Ag(5) shifts to lower wavenumber (red shift) while B3g(1) and B2g(2) are blue shift. Red shift of Ag(5) indicates the rotation of the CrO6 octahedron increases, which is consistent with the calculated φ angle from XRD. The anomalous hardening of B3g(1) and B2g(2) modes reveals the possible displacement of R ions induced by spin-phonon coupling,30 which may be related to the magnetic interactions between R3+ and Cr3+ ions.4,30
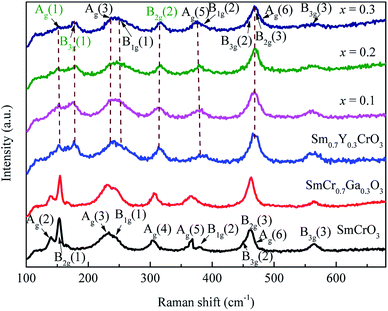 | ||
| Fig. 2 The room temperature Raman spectra of samples SmCrO3, SmCr0.7Ga0.3O3, Sm0.7Y0.3Cr1−xGaxO3 (x = 0, 0.1, 0.2, and 0.3). | ||
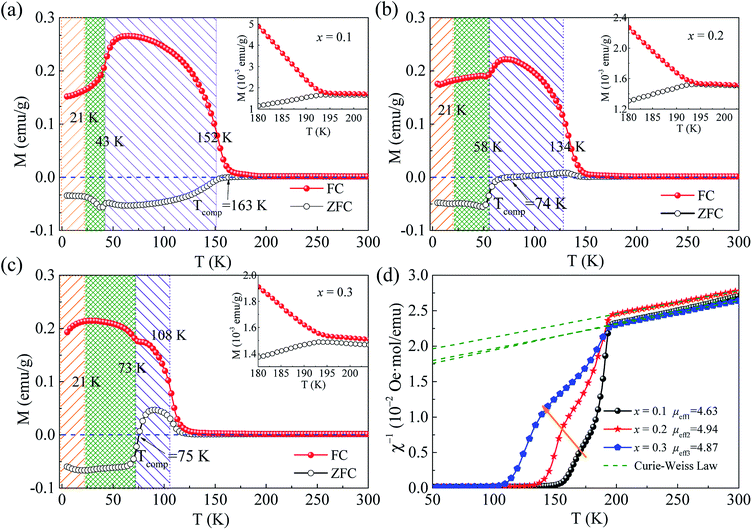
The FC and ZFC curves of temperature dependent magnetization of Sm0.7Y0.3Cr1−xGaxO3 (x = 0.1, 0.2, and 0.3) samples are shown in Fig. 3(a–c). From these graphs, it is evident that there indeed and still is antiferromagnetic transition, the SR transition, and the TIMR effect in the ZFC case. As the temperature decreases from high temperature, the magnetization curves undergo a paramagnetic to antiferromagnetic phase transition at TN. And the Neel temperature occurs below the bifurcation temperature (Tbf) of ZFC and FC curves, the value of which is around 194 K and is independent of doping concentration. However, the value of TN has strongly dependence on the doping concentration, which was obtained from the maximum position of the first derivative of ZFC curves and listed in Table 1. It almost decreases linearly with a tolerance of 24 K with 10% doping, which results from the dilution effect of Ga ions doping on destroying the Cr–O–Cr magnetic coupling. This leads to the fact that temperature difference between Tbf and TN becomes bigger with increase of doping concentration. The bifurcation of ZFC and FC is the characteristic of the onset of the antiferromagnetic ordering, which is attributed to the coexistence of ferromagnetic and antiferromagnetic phases caused by magnetic anisotropy.32–34 The destruction of Cr–O–Cr by the Ga3+ ions suppresses the formation of Cr3+ antiferromagnetic ordering and gives rise to the existence of ferromagnetic-like clusters, which can be demonstrated from the deviation of Curie–Weiss linear behaviour in the inverse susceptibility as a function of temperature (shown in Fig. 3(d)). Thus, an unchanged Tbf and reduced TN are observed.
For the paramagnetic region, it was best fitted by the Curie–Weiss law, χ = C/(T − Θ), where C is Curie constant and Θ is the Weiss temperature, as shown in Fig. 3(d). Based on the fitted Curie constant, the average effective magnetic moment was calculated by the following formula:
 | (1) |
 in paramagnetic region can be calculated using the free ionic moments of Sm3+ and Cr3+ as the following equation
 | (2) |
 , which demonstrates that the effective magnetic moments of samples are not only from the free ionic moments of Sm3+ and Cr3+. This large calculated effective paramagnetic moment in SmCrO3 seems to be a common thing that most of the reported effective paramagnetic moment in SmCrO3 is larger than the theoretical value calculated by free magnetic ions only.6,16,17,35,36 However, few of them discuss its origin. One of the work done by ab initio calculation suggested that the pressure produced by the tilting of the oxygen octahedral causes the difference between the experimental calculated effective paramagnetic moment and the theoretical one.37 The experimental and theoretical investigations of this issue are appealed.
As temperature continues to decrease, a canted antiferromagnetic phase with weak ferromagnetic component is formed between chromium ions, showing a dramatic increment of the macroscopic magnetic moment. In the ZFC curve, an obvious negative magnetization occurs below TN at x = 0 (shown in our previous work)14 and x = 0.1. Moreover, note that when x ≥ 0.2, the magnetization in ZFC mode is still positive when temperature is below Tbf and goes across the zero-magnetization-line to a negative value at the compensation temperature (Tcomp), showing the magnetization reversal. And this TIMR effect becomes remarkable when x = 0.3, showing its evolution with doping concentration. Most reported TIMR effect from positive to negative occurs in FC mode while few in ZFC mode.2,10,25,38–42 Here, the TIMR effect observed in ZFC mode shows dependence on doping concentration and the compensation temperature for x = 0.2 and 0.3 is at near 74 K and almost the same, indicating its intrinsic feature.
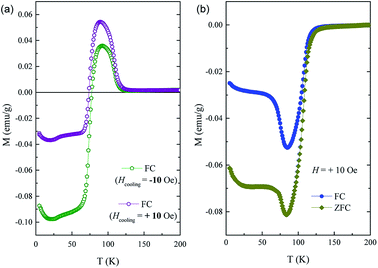
In order to prove the intrinsic nature of TIMR effect in ZFC by ruled out the effect of a small negative trapped field in the superconducting magnet during cooling on the negative magnetization,43 we measured the FC M(T) curves with very small cooling fields Hcooling = ± 10 Oe respectively and the applied field H still keeps 100 Oe. The results shown in Fig. 4 show that the TIMR effect still exists both in positive and negative cooling field. This signifies that even though there is a small trapped field when doing ZFC measurement, the negative magnetization and magnetization reversal observed in our measurement would not be affected. Moreover, the TIMR effect here is actually dependent on the applied field. The field-dependence of magnetization reversal is observed, as shown in Fig. 4(b). The ZFC and FC curves under applied small field H = 10 Oe were measured. It shows that magnetizations below TN are negative in both ZFC and FC curves. And when the applied field increases upto 100 Oe the magnetization in the temperature interval Tcomp < T < TN becomes positive. These results prove the intrinsic nature of the TIMR effect.
With temperature further cooling, magnetization drops abruptly in FC at TSR for x = 0.1 and 0.2 while rises for x = 0.3, where the SR effect happens. In the meantime, there is a fluctuation of magnetization in ZFC at x = 0.1 and obvious drops at x = 0.2 and 0.3 while it never happened in SmCrO3.
This SR effect is assigned to the transition from spin configuration Γ4 to Γ2.4,6 In our previous work, Y3+ doping at Sm-site has a tiny effect on the value of TSR with 6 K lower at 30% Y3+ doing sample than SmCrO3.14 Interestingly, in the series of Ga-doped Sm0.7Y0.3CrO3 samples here, the TSR increases uniformly with an increment of 15 K and reaches to 73 K at x = 0.3, closely to the compensation temperature (75 K) and the liquid nitrogen temperature. Nonetheless, this inconsistency of TSR and Tcomp illustrates that the TIMR effect is independent of the SR effect and the TIMR occurs ahead of the SR effect with decreasing of temperature. Moreover, the magnetization of FC curve at Γ2 increases while the one at Γ4 decreases correspondingly with increasing of doping concentration. As x = 0.3, the magnetization at Γ2 overcomes the one at Γ4. It is reasonable because that the SR transition temperature is improved to 73 K where the contribution of Sm3+ moments is low. And the spontaneous moment parallel to a crystallographic axis (Γ2) of SmCrO3 is larger than the one parallel to c crystallographic axis (Γ4).4,19 Moreover, the occurrence of SR transition has been attributed to the strong antisymmetric exchange interaction between Sm3+ and Cr3+ and the dilution effect of Ga ions doping on Cr ions moment gives rise to the improvement of the whole net magnetization value. With further doping, the competitiveness of Cr3+ moment relative to Sm3+ moment decreases and it will reduce and even destroy the antisymmetric Sm–Cr interactions, leading to the parallel orientation of Sm and Cr spin moments, especially for the samples with high doping concentration. An enhancement of magnetization at low temperature thus will be reasonable caused for x = 0.3.
Now we turn to give the interpretation of the TIMR accompanied with SR effect in ZFC curve. In these oxides magnetization reversal was explained in terms of competition between single-ion magnetic anisotropy and antisymmetric DM interactions.44–46 In antiferromagnetic materials with low symmetry, the appearance of weak ferromagnetism is predominantly determined by either single-ion magnetocrystalline anisotropy or DM interactions. It has been suggested that the net moment produced by these mechanisms can be oriented in opposite direction and have different temperature dependence in some cases.47,48 The magnetic exchange interactions between magnetic ions generally include the isotropic, the antisymmetric (or DM interaction), and anisotropic symmetric superexchange interactions. Therefore, the Hamiltonian of the SmCrO3 system in the absence of external magnetic field can be written as follows:
| H = HCr–Cr + HCr–Sm | (3) |
| HCr–Cr = HMiso + HManti + HMsin | (4) |
| HCr–Sm = HRMiso + HRManti | (5) |
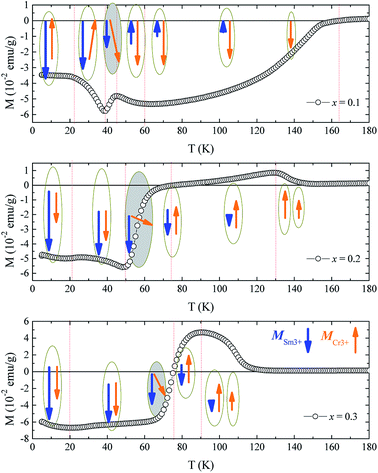 | ||
| Fig. 5 The ZFC curves of samples x = 0.1, 0.2, and 0.3 and their schematic of spin evolution with temperature. | ||
When x ≤ 0.1 and T < Tbf, the strong isotropic exchange interaction between Cr3+ spins leads to the antiferromagnetic ordering at TN. The net moment of Cr is oppositely aligned to the measuring field, showing the negative magnetization and increases in the absolute value with further cooling. However, for x ≥ 0.2, the canted antiferromagnetic moments of Cr3+ spins are positive. The small canted antiferromagnetism of Cr3+ spins below TN are attributed to two mechanisms, i.e., the single-ion anisotropy of Cr3+ ions and the antisymmetric Cr3+–Cr3+exchange interactions, which do not need to have the same sign.48 Due to the dilution of Cr–Cr exchange interaction by Ga doping, the single ion anisotropy of Cr3+ ions dominates, leading to the net moment parallel to measuring field. With further cooling, for x = 0.1, the SR happens at 43 K, making the spin of Cr deflect. At this time, the DM interaction between Cr spins, which has an opposite sign with that of single-ion anisotropy of Cr3+, increases and competes with the interaction of single-ion anisotropy of Cr3+. When the DM interaction between Cr–Cr dominates over single-ion anisotropy of Cr3+, the net moment of Cr reverses and correspondingly the Sm3+ spin will also reverse due to isotropic and antisymmetric of Sm–Cr interaction. This process is accompanied by the SR effect making it happened step by step. At lower temperature, the antisymmetric Sm–Cr interaction that produces an effective field on Cr spins becomes increasingly predominant due to the increase of Sm moment. When the effective field with respect to this antisymmetric interaction is stronger than single-ion anisotropy of Cr ions and the antisymmetric interaction between Cr spins below TSR, the Cr spins will rotate from the c axis to a axis.
With regard to samples for x ≥ 0.2, the magnetization reverses firstly due to the antisymmetric Sm–Cr interaction. When the moment of Sm equals to that of Cr, the net moment becomes zero at Tcomp. Then the SR effect occurs, causing the dramatic drop of the magnetization in ZFC. If considering the isotropic and antisymmetric Sm–Cr interactions, the spin reversal of Cr will be accompanied with the reversal of Sm moment, leading to a fluctuation of the magnetization even positive one instead of a dramatic dropping. Here the drop of the magnetization means that the isotropic and antisymmetric Sm–Cr interactions are seriously reduced with Ga doping, making the magnetocrystalline anisotropy dominate. This is consistent with the reported result21 and results in the parallel arrangement of Sm3+ moment with Cr3+ net moment. Carefully seen from the ZFC curves that there is another transition at nearly 20 K, which is obvious at x = 0.1 and displays a broad peak at x = 0.2 and 0.3. This is attributed to the Sm3+ magnetic ordering with the stabilized Cr3+ spin of Γ2 configuration.
Besides the TIMR and SR effect, the ZEB effect of these samples are also experimentally observed. For Sm0.7Y0.3CrO3, it was reported to show the negative ZEB effect at low temperature and reversal to positive one at TSR < T < TN, similar to the behaviour of SmCrO314. The p-type M–H curves (0 → (+Hmax) → (−Hmax) → 0) measured under ZFC mode at various temperatures are shown in Fig. 6. All the curves show hysteresis loops with certain amount of coercivity (HC) but are not saturated at high magnetic field, indicating the coexistence of weak ferromagnetism and antiferromagnetism. As is known that an EB effect is usually formed at the ferromagnetic/antiferromagnetic interface. The EB field HEB was determined by HEB = (HC+ + HC−)/2, where HC+ and HC− are the left and right coercive fields respectively. All the values of HEB, HC, and the remnant magnetization Mr are listed in Table 2. And the relationship of HEB and HC with doping concentration are plotted in Fig. 6(d). Note that at 5 K the ZEB effect does not only still appear but also show positive when doping Ga3+ ions and linearly decreases with increase of doping concentration. Then the ZEB effect disappears at temperature between TN and TSR, which may be due to the stronger performance of weak ferromagnetism than antiferromagnetism. The ZEB effect was reported to be observed in the parent SmCrO3.18,20 The EB field at 5 K can be reached to almost 5 kOe.18 The origin of ZEB effect in SmCrO3 is considered to be the local interaction between the canted antiferromagnetic Cr sublattices and orientated Sm sublattices.18 The coupling between Sm3+ and Cr3+ via internal magnetic field HI49 results in large HEB.20 The positive ZEB effect may be related to the behaviour in layered magnetic systems,50,51 where positive EB appears if the interactions at the interfaces are antiferromagnetic, whereas negative EB is present for ferro-magnetic interactions. As reported, by nonmagnetic rare-earth ions doping at Sm-site, such as La, the exchange bias field HEB decreases monotonously with doping level increasing due to the weakness of the Sm–Cr coupling.20 The HEB of ZEB effect in our samples show the decrement as well with increase of nonmagnetic Ga3+ ions doping, similar to the reported results.20 The nonmagnetic ions doping (Y3+, and Ga3+), nonmatter doping at Sm- or Cr-sites, would reduce the coupling between Sm3+ and Cr3+, leading to the decrease of ZEB effect.
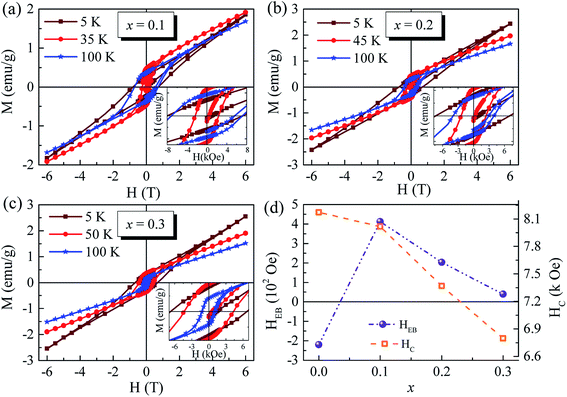 | ||
| Fig. 6 (a–c) The M–H curves at different temperature of samples x = 0.1, 0.2, and 0.3. (d) The relationship of HEB and HC with doping concentration. | ||
| Sample | Temperature | HEB (Oe) | HC (Oe) | Mr (emu g−1) |
|---|---|---|---|---|
| x = 0.1 | 5K | 412.6 | 8015.3 | 0.27455 |
| 35K | 5.3 | 2345.6 | 0.36946 | |
| 100K | 2.5 | 7154.4 | 0.45936 | |
| x = 0.2 | 5K | 202.6 | 7368.1 | 0.31416 |
| 45K | −2.8 | 2388.6 | 0.41866 | |
| 100K | 7.5 | 3945.3 | 0.29665 | |
| x = 0.3 | 5K | 39.85 | 6796.3 | 0.31861 |
| 50K | 10.75 | 4361.3 | 0.35168 | |
| 100K | −2.1 | 1179.4 | 0.17103 |
Conclusions
In conclusion, we investigated the temperature dependent magnetic properties of SmCrO3 by codoping nonmagnetic ions at Sm- and Cr-sites. It is evident that there indeed and still exists antiferromagnetic transition, the TIMR effect, and the SR effect. The spin reorientation from Γ4 to Γ2 is tuned and the transition temperature TSR is improved dramatically to the liquid nitrogen temperature by Ga ions doping, which would be helpful to achieve its application in temperature sensitive spintronic devices and magnetic switching devices. The intrinsic TIMR effect from positive to negative under ZFC condition are significantly induced as well and its reversal evolution is strongly dependent with doping. Moreover, the positive ZEB effect is formed in Ga doped Sm0.7Y0.3CrO3 samples at 5 K although it is suppressed with increase of doping concentration and disappears in high temperature. Under the influence of doping nonmagnetic ions, lattice distortion is induced to some extend and the magnetic interactions of Cr–Cr and Sm–Cr are predominantly diluted, leading to tune the above phenomena. Those phenomena are discussed and successfully explained by considering the magnetic exchange interactions competitions including the isotropic, antisymmetric (or DM interaction), and anisotropic superexchange interactions.Conflicts of interest
There are no conflicts to declare.Acknowledgements
This work was supported by the National Natural Science Foundation of China (Grant No. 11605092 and 11704009) and Nanjing University of Posts and Telecommunications under research project (No. NY215091).References
- J. R. Sahu, C. R. Serrao and C. N. R. Rao, Solid State Commun., 2008, 145, 52–55 CrossRef CAS.
- Y. Su, J. Zhang, Z. Feng, L. Li, B. Li, Y. Zhou, Z. Chen and S. Cao, J. Appl. Phys., 2010, 108, 013905 CrossRef.
- J. S. Zhou, J. A. Alonso, V. Pomjakushin, J. B. Goodenough, Y. Ren, J. Q. Yan and J. G. Cheng, Phys. Rev. B, 2010, 81, 214115 CrossRef.
- B. Rajeswaran, D. I. Khomskii, A. K. Zvezdin, C. N. R. Rao and A. Sundaresan, Phys. Rev. B, 2012, 86, 214409 CrossRef.
- Y. Cao, S. Cao, W. Ren, Z. Feng, S. Yuan, B. Kang, B. Lu and J. Zhang, Appl. Phys. Lett., 2014, 104, 232405 CrossRef.
- S. Huang, G. Zerihun, Z. Tian, S. Yuan, G. Gong, C. Yin and L. Wang, Ceram. Int., 2014, 40, 13937–13943 CrossRef CAS.
- A. McDannald, C. R. dela Cruz, M. S. Seehra and M. Jain, Phys. Rev. B, 2016, 93, 184430 CrossRef.
- E. F. Bertaut, G. Bassi, G. Buisson, P. Burlet, J. Chappert, A. Delapalme, J. Mareschal, G. Roult, R. Aleonard, R. Pauthenet and J. P. Rebouillat, J. Appl. Phys., 1966, 37, 1038–1039 CrossRef.
- A. Ghosh, K. Dey, M. Chakraborty, S. Majumdar and S. Giri, EPL, 2014, 107, 47012 CrossRef.
- L. H. Yin, Y. Liu, S. G. Tan, B. C. Zhao, J. M. Dai, W. H. Song and Y. P. Sun, Mater. Res. Bull., 2013, 48, 4016–4021 CrossRef CAS.
- X. L. Qian, D. M. Deng, Y. Jin, B. Lu, S. X. Cao and J. C. Zhang, J. Appl. Phys., 2014, 115, 193902 CrossRef.
- M. Tripathi, R. J. Choudhary and D. M. Phase, RSC Adv., 2016, 6, 90255–90262 RSC.
- Y. Wu, J. Xu and Z. Xia, J. Low Temp. Phys., 2016, 183, 14–22 CrossRef CAS.
- H. Zhang, J. Wang, L. Xie, D. Fu, Y. Guo and Y. Li, J. Appl. Phys., 2017, 122, 204103 CrossRef.
- D.-x. Fu, Y.-z. Liu, H.-g. Zhang, L. Xie and B. Li, J. Alloys Compd., 2018, 735, 1052–1062 CrossRef CAS.
- S. Huang, K. P. Su, H. O. Wang, L. R. Shi and D. X. Huo, Ceram. Int., 2017, 43, 12258–12262 CrossRef CAS.
- X. Qian, L. Chen, S. Cao and J. Zhang, Solid State Commun., 2014, 195, 21–25 CrossRef CAS.
- P. Gupta, R. Bhargava and P. Poddar, J. Phys. D: Appl. Phys., 2015, 48, 025004 CrossRef.
- G. Gorodetsky, R. M. Hornreich, S. Shaft, B. Sharon, A. Shaulov and B. M. Wanklyn, Phys. Rev. B, 1977, 16, 515–521 CrossRef CAS.
- S. Huang, L. R. Shi, Z. M. Tian, H. G. Sun and S. L. Yuan, J. Magn. Magn. Mater., 2015, 394, 77–81 CrossRef CAS.
- M. Tripathi, R. J. Choudhary, D. M. Phase, T. Chatterji and H. E. Fischer, Phys. Rev. B, 2017, 96, 174421 CrossRef.
- Y. Fang, X. Cui, J. Kang, W. Sun, P. Cheng, F. Chen and J. Zhang, Solid State Commun., 2017, 261, 37–40 CrossRef CAS.
- J. Kang, Y. Yang, X. Qian, K. Xu, X. Cui, Y. Fang, V. Chandragiri, B. Kang, B. Chen, A. Stroppa, S. Cao, J. Zhang and W. Ren, IUCrJ, 2017, 4, 598–603 CrossRef CAS PubMed.
- Y. Fang, S.-M. Yan, Y.-Y. Gong, W.-L. Zhu, Q.-Q. Cao, D.-H. Wang and Y.-W. Du, Chin. Phys. B, 2014, 23, 127502 CrossRef.
- N. Panwar, J. P. Joby, S. Kumar, I. Coondoo, M. Vasundhara, N. Kumar, R. Palai, R. Singhal and R. S. Katiyar, AIP Adv., 2018, 8, 055818 CrossRef.
- B. H. Toby, J. Appl. Crystallogr., 2001, 34, 210–213 CrossRef CAS.
- D. J. W. Yusheng Zhao, J. B. Parise and D. E. Cox, Phys. Earth Planet. Inter., 1993, 76, 16 Search PubMed.
- M. N. Iliev, M. V. Abrashev, H. G. Lee, V. N. Popov, Y. Y. Sun, C. Thomsen, R. L. Meng and C. W. Chu, Phys. Rev. B, 1998, 57, 2872–2877 CrossRef CAS.
- M. C. Weber, J. Kreisel, P. A. Thomas, M. Newton, K. Sardar and R. I. Walton, Phys. Rev. B, 2012, 85, 054303 CrossRef.
- V. Srinu Bhadram, B. Rajeswaran, A. Sundaresan and C. Narayana, EPL, 2013, 101, 17008 CrossRef.
- V. S. Bhadram, D. Swain, R. Dhanya, M. Polentarutti, A. Sundaresan and C. Narayana, Mater. Res. Express, 2014, 1, 026111 CrossRef.
- T. Krenke, M. Acet, E. F. Wassermann, X. Moya, L. Mañosa and A. Planes, Phys. Rev. B, 2005, 72 Search PubMed.
- R. Das, A. Jaiswal, S. Adyanthaya and P. Poddar, J. Appl. Phys., 2011, 109, 064309 CrossRef.
- S. Lei, L. Liu, C. Wang, C. Wang, D. Guo, S. Zeng, B. Cheng, Y. Xiao and L. Zhou, J. Mater. Chem. A, 2013, 1, 11982 RSC.
- Z. Xiang, W. Li and Y. Cui, RSC Adv., 2018, 8, 8842–8848 RSC.
- L. M. Daniels, M. C. Weber, M. R. Lees, M. Guennou, R. J. Kashtiban, J. Sloan, J. Kreisel and R. I. Walton, Inorg. Chem., 2013, 52, 12161–12169 CrossRef CAS PubMed.
- H. J. Zhao, W. Ren, X. M. Chen and L. Bellaiche, J. Phys.: Condens. Matter, 2013, 25, 385604 CrossRef PubMed.
- T. Bora and S. Ravi, J. Magn. Magn. Mater., 2014, 358–359, 208–211 CrossRef CAS.
- P. Gupta and P. Poddar, Inorg. Chem., 2015, 54, 9509–9516 CrossRef CAS PubMed.
- L. Wang, G. H. Rao, X. Zhang, L. L. Zhang, S. W. Wang and Q. R. Yao, Ceram. Int., 2016, 42, 10171–10174 CrossRef CAS.
- L. Wang, S. W. Wang, X. Zhang, L. L. Zhang, R. Yao and G. H. Rao, J. Alloys Compd., 2016, 662, 268–271 CrossRef CAS.
- S. Kumar, I. Coondoo, M. Vasundhara, A. K. Patra, A. L. Kholkin and N. Panwar, J. Appl. Phys., 2017, 121, 043907 CrossRef.
- N. Kumar and A. Sundaresan, Solid State Commun., 2010, 150, 1162–1164 CrossRef CAS.
- T. Moriya, Phys. Rev., 1960, 120, 91–98 CrossRef CAS.
- I. Dzyaloshinsky, J. Phys. Chem. Solids, 1958, 4, 241–255 CrossRef CAS.
- P. Mandal, A. Sundaresan, C. N. R. Rao, A. Iyo, P. M. Shirage, Y. Tanaka, C. Simon, V. Pralong, O. I. Lebedev, V. Caignaert and B. Raveau, Phys. Rev. B, 2010, 82, 100416 CrossRef.
- Y. Ren, T. T. M. Palstra, D. I. Khomskii, E. Pellegrin, A. A. Nugroho, A. A. Menovsky and G. A. Sawatzky, Nature, 1998, 396, 441 CrossRef CAS.
- Y. Ren, T. Palstra, D. Khomskii, A. Nugroho, A. Menovsky and G. Sawatzky, Phys. Rev. B, 2000, 62, 6577–6586 CrossRef CAS.
- K. Yoshii, Appl. Phys. Lett., 2011, 99, 142501 CrossRef.
- J. Nogués and I. K. Schuller, J. Magn. Magn. Mater., 1999, 192, 203–232 CrossRef.
- W. Wang, F. Takano, M. Takenaka, H. Akinaga and H. Ofuchi, J. Appl. Phys., 2008, 103, 093914 CrossRef.
| This journal is © The Royal Society of Chemistry 2018 |

