 Open Access Article
Pyrolytic behavior of a zero-valent iron biochar composite and its Cu(II) removal mechanism
Changjiang Yuab,
Dashuai Zhanga,
Xinyu Donga and
Qiang Lin *ab
*ab
aKey Laboratory of Water Pollution Treatment & Resource Reuse of Hainan Province, Key Laboratory of Tropical Medicinal Plant Chemistry of Ministry of Education, College of Chemistry and Chemical Engineering, Hainan Normal University, No. 99 Longkunnan Road, Haikou 571158, China. E-mail: linqianggroup@163.com
bFaculty of Environmental Science and Engineering, Kunming University of Science and Technology, No. 68 Wenchang Road, Kunming 650500, China
First published on 4th October 2018
Abstract
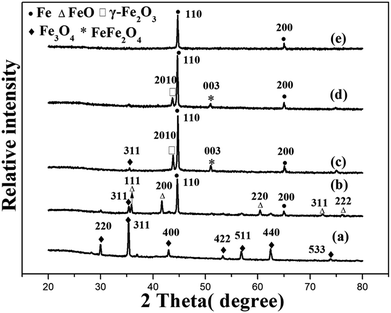
The reduction behavior of Fe3+ during the preparation of a zero-valent iron cocoanut biochar (ZBC8-3) by the carbothermic reduction method was analyzed. Fe3+ was first converted into Fe3O4, which was subsequently decomposed into FeO, and finally reduced to Fe0. A minor amount of γ-Fe2O3 was produced in the process. The isothermal thermodynamic data for the removal of Cu(II) over ZBC8-3 followed a Langmuir model. The Langmuir equation revealed a maximum removal capacity of 169.49 mg g−1 at pH = 5 for ZBC8-3. The removal of Cu(II) over ZBC8-3 fitted well to a pseudo-first-order equation, which suggested that the rate limiting step of the process was diffusion. The Cu(II) removal mechanism on ZBC8-3 involved the reduction of Cu(II) by Fe0 to produce Cu0 and Cu2O, while C![[double bond, length as m-dash]](https://www.rsc.org/images/entities/char_e001.gif) C, C–O–, and –O–H formed a complex with Cu(II).
C, C–O–, and –O–H formed a complex with Cu(II).
1. Introduction
Owing to its large specific surface area and high reactivity, nanoscale zero-valent Fe (nZVI) has received increasing attention as a removal material for a variety of heavy metals and chlorinated organic contaminants through chemical reduction processes.1 However, nZVI is extremely unstable and typically suffers from agglomeration and oxidation processes by non-target chemicals during operation. This has hindered significantly the utilization of nZVI for environmental remediation purposes.2 Up to now, efforts have been focused on increasing the stability and dispersion of nZVI particles. In this sense, a method involving liquid-phase reduction of Fe3+ or Fe2+ to nZVI and subsequent dispersion of the reduced species on porous materials such as zeolites,3 attapulgite,4 graphite,5 wheat straw,6 functionalized waste rock wool7,8 and biochar9,10 has been widely used. In addition, polyvinyl alcohol (PVA)-alginate-entrapped nanoscale zero-valent iron has been also used to improve the stability of nZVI.11Although these nZVI composites fabricated by liquid-phase reduction have demonstrated good removal capacities, this method requires the utilization of expensive and highly toxic reducing agents such as borohydride. In addition, N2 protection or vacuum processing is required during the fabrication, and a large amount of toxic by-products are generated. These issues have significantly increased the fabrication costs and the risks of environment pollution.
An alternative approach to produce nZVI for environmental remediation purposes is the carbothermic reduction method. In this method, an Fe-rich precursor is mixed with biomass and subsequently cofired under low-oxygen conditions.12 However, the reduction behavior of the Fe-rich precursor remains unclear. The main objective of this work is to determine the reduction behavior of the Fe-rich precursor during the preparation of a nZVI-biochar composite. Furthermore, the Cu(II) removal mechanism on the nZVI-biochar composite has not been reported yet. Therefore, our work was also aimed to investigate the mechanism for Cu(II) removal over the nZVI-biochar composite.
2. Materials and methods
2.1 Materials
Sodium alginate was purchased from Shanghai Jingchun Technology Co. Ltd. (Shanghai, China), while FeCl3·6H2O, CaCl2, and NaOH were purchased from Guangzhou chemical reagent factory (Guangzhou, China). CuCl2·2H2O, PbCl2, CoCl2·6H2O, and NaNO3 were purchased from Aladdin Holdings Group, and Cu standard liquid was obtained from Shanghai Fusheng Co. Ltd. (Shanghai, China). All analytical grade chemicals were used without further purification.2.2 Fabrication of magnetic carbon nanoadsorbents
Cocoanut shell was collected from a suburb (Haikou, China), air-dried at 70 °C and ground (below 0.074 mm sieve). 60.0 g of FeCl3·6H2O were dissolved in 500 mL of ethanol and the mixture was mechanically stirred for 1 h. 10.0 g of cocoanut shell powder was then mixed with the as-prepared FeCl3 solution and the suspension was stirred continuously for additional 24 h in order to homogenize Fe3+ in the cocoanut shell powders. The mixture was kept at room temperature for one month. The remaining solids were dried in a convection oven at 120 °C for 10 h and pyrolyzed under nitrogen in a tube furnace to form magnetic carbon nanoadsorbents. The pyrolysis temperature was increased to 200 °C at 5 °C min−1 and subsequently increased to 700 or 800 °C at 10 °C min−1 and held for 1–3 h. The samples were named as ZBC a–b, where “a” and “b” denote the carbonization temperature and the retention time, respectively.2.3 Characterization
The Cu(II) concentration was determined by atomic absorption spectrophotometry (AAS, AA-7000, Shimadzu, Japan). The morphology of the samples was investigated by scanning electron microscopy (SEM, JSM-7401F, JEOL, Japan). Surface element analysis was conducted by energy dispersive spectroscopy (EDS). The structural and compositional characteristics of the materials were investigated by X-ray diffraction (XRD, UItima IV, Rigaku, Japan). X-ray photoelectron spectroscopy (XPS, PHI5000 Versaprobe-II, Ulvac-Phi, Japan) was used to analyze the chemical composition of the magnetic microspheres. The magnetic properties were determined using a magnetic property measurement system (7404, LakeShore, USA). The Fourier transform infrared (FTIR) spectra of the samples were obtained on a Nicolet 6700 infrared spectroscope (Thermo Electro Corp, USA).2.4 Adsorption kinetic studies
The adsorption experiments on ZBC8-3 were carried out at 25 °C. A Cu(II) stock solution of 100 mg L−1 was prepared by dissolving CuCl2·2H2O in ultra-pure water. The solution was adjusted at pH = 5 using either 0.1 M HNO3 or 0.1 M NaOH solutions. A certain amount of ZBC8-3 was added to 500 mL of a Cu(II) solution in a beaker and shaken at a constant speed (120 rpm) on a shaking table. 1 mL of the Cu(II) solution was removed at different times (from 10 min to 32 h) and analyzed after dilution.13 All the results were obtained by taking an average of three specimens. The adsorption capacity of Cu(II) at time t (qt) was then calculated using eqn (1):
 | (1) |
2.5 Adsorption isotherms
0.05 g of ZBC8-3 were added to Cu(II) solutions (200 mL) with different concentrations (50–250 mg L−1) at 25 °C and shaken at a constant speed (120 rpm) for 24 h.14 Cu(II) was quantified as in the case of the kinetic studies. All the results were obtained by taking an average of three specimens. The equilibrium adsorption capacity of Cu(II) (qe) was calculated using eqn (2):
 | (2) |
2.6 Influence of other ions on the Cu(II) removal ability of ZBC8-3
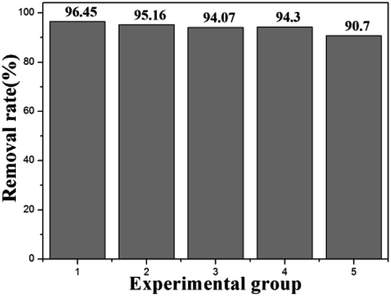
The hygienic standard for drinking water in China requires the Cu(II) concentration in drinking water to be less than 1 mg L−1, while nitrate concentration must be lower than 10 mg L−1. In this study, a Cu(II) solution of 10 mg L−1 was selected as the simulated pollution source, while a NaNO3 solution of 10 mg L−1 was selected as a background electrolyte. To be specific, the Cu(II) solution of 10 mg L−1 fabricated by dissolving CuCl2 in ultrapure water was marked as sample 1. Both Cu(II) and NaNO3 10 mg L−1 solutions were marked as samples 2. In addition, Pb(II)/Cu(II), Co(II)/Cu(II), and Pb(II)/Co(II)/Cu(II) mixtures were prepared by adding PbCl2 and CoCl2 to samples 2, respectively, and were marked as samples 3, 4, and 5. Moreover, 0.1 g of ZBC8-3 were added respectively to samples 1–5 and shaken at a constant speed (120 rpm) at 25 °C for 24 h. After shaking, ZBC8-3 was filtered and the concentrations of Cu(II) in the filtered solutions were determined by AAS. All the results were obtained by taking an average of three specimens.3. Results and discussion
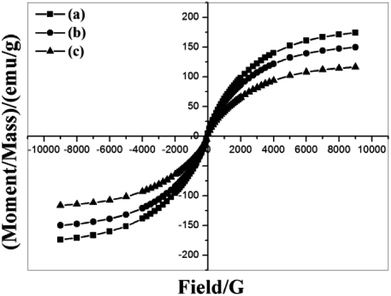
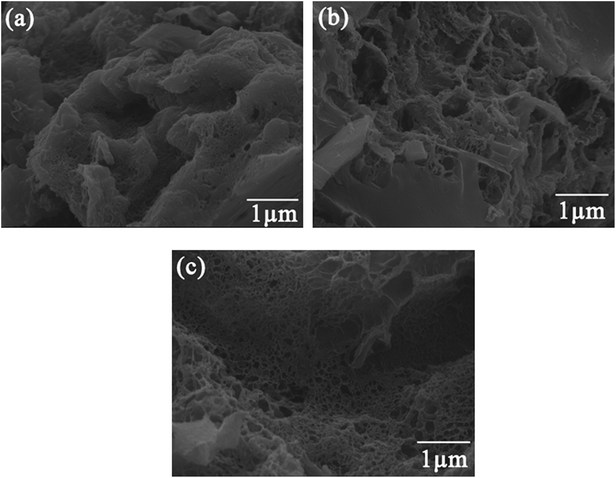
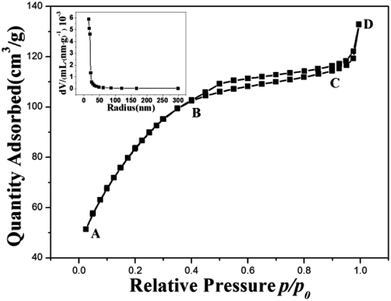
3.1 Characterization of materials
3.2 Effect of the pH on the removal of Cu(II)
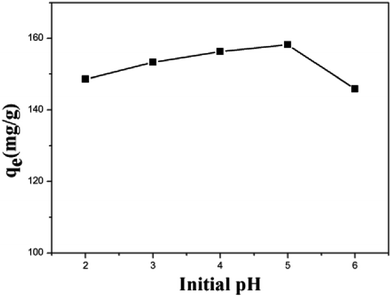
The Cu(II) removal experiments of ZBC7-1, ZBC7-3, ZBC8-1, ZBC8-2, and ZBC8-3 were carried out with a Cu(II) solution of 20 mg L−1 under constant shaking (120 rpm) for 24 h at pH = 5. The results showed that the removal capacity of ZBC7-1, ZBC7-3, ZBC8-1, ZBC8-2, and ZBC8-3 were 10.28, 29.15, 50.54, 61.86, and 73.50 mg g−1, respectively. An increase in the carbonization temperature and the retention time might have favored the formation of Fe0. Therefore, ZBC8-3 was selected as the raw material for subsequent experiments. The effect of the pH on the removal capacity of ZBC8-3 was investigated. Adsorption experiments were carried with a Cu(II) solution of 90 mg L−1 over a pH range of 2–6, since Cu(II) precipitate above a pH of 6.23 All the results were obtained by taking an average of three specimens.The removal capacity of ZBC8-3 increased quickly with the pH (Fig. 5). This can be explained as follows. At lower pH, a higher number of very mobile protons (H+) compete with Cu(II) ions for the active sites on ZBC8-3. Upon increasing the pH, the concentration of H+ ions decreased, resulting in more Cu(II) being replaced.24 In addition, the Cu(II) removal capacity of ZBC8-3 decreased significantly at a pH of = 6, which may result from Fe3+/Fe2+ depositions easily generated at high pH covering the surface of ZBC8-3. These deposits prevented the diffusion of Cu(II) into ZBC8-3. Therefore, pH = 5 was chosen as the optimum experimental conditions.25
3.3 Kinetics adsorption experiments
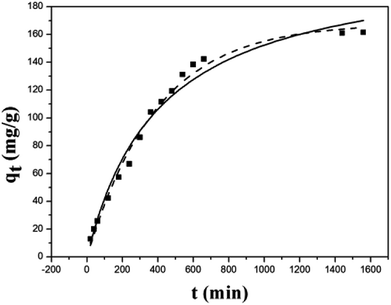
The kinetics of the Cu(II) removal on ZBC8-3 were investigated by using dynamic data. Pseudo-first-order and pseudo-second-order kinetic models were applied to fit the data, as described in eqn (3) and (4).26 The result for non-linear curve fitting to the dynamic data is shown in Fig. 6:
 | (3) |
 | (4) |
As shown in Fig. 6, the removal of Cu(II) on ZBC8-3 was fast within the first 6 h, and the rate decreased thereafter and stabilized within 24 h. The relatively fast removal rate within the first 6 h was mainly attributed to an oxidation–reduction reaction of Fe0 on the outer layer of ZBC8-3. Some deposits were formed by redox reaction of Fe0 and Cu(II), blocking the pore structure of the ZBC8-3 to some extent. As a result, diffusion of Cu(II) to the inside of the ZBC8-3 was hindered in the consequent reaction.
The kinetic model parameters as well as the correlation coefficient (R2) for ZBC8-3 are included in Table 1.
| Sample | Pseudo-first-order model | Pseudo-second-order model | ||||
|---|---|---|---|---|---|---|
| qe,cal (mg g−1) | k1 (10−3 min−1) | R2 | qe,cal (mg g−1) | k2 (10−4g mg−1 min−1) | R2 | |
| ZBC8-3 | 168.11 | 2.57 | 0.9908 | 214.67 | 0.1139 | 0.9785 |
The pseudo-first-order equation described the Cu(II) removal behavior on ZBC8-3. The correlation coefficient (0.9908) for ZBC8-3 was higher than that of the pseudo-second-order equation (0.9785), indicating that the rate limiting step was diffusion.27 Thus, the surface of ZBC8-3 was covered by deposits, which blocked the porous structure of ZBC8-3. Cu(II) ions gradually diffused to the interior of ZBC8-3, and the overall process required more time to complete.
3.4 Isothermal adsorption experiments
The removal isotherms were fitted using the Langmuir and Freundlich isotherm models. The Langmuir isotherm model is described by eqn (5):28
 | (5) |
The Freundlich isotherm model is described by eqn (6):29
 | (6) |
The Langmuir and Freundlich isotherms of ZBC8-3 are shown in Fig. 7. The results showed that the Cu(II) ion removal capacity increased rapidly at low concentrations of Cu(II) and gradually reached its maximum by increasing the Cu(II) ion concentration.
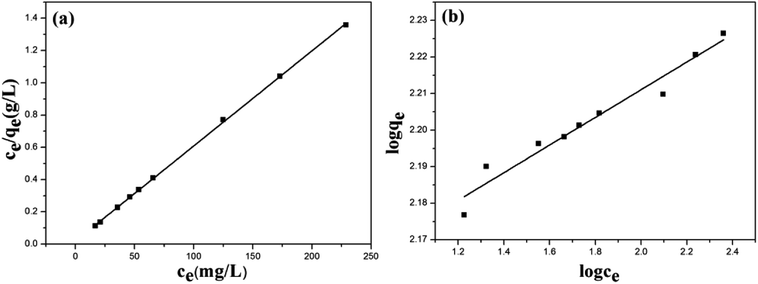 | ||
| Fig. 7 Adsorption isotherms of Langmuir (a) and Freundlich (b) equations for the removal of Cu(II) on ZBC8-3. | ||
The isotherms model parameter and the correlation coefficient (R2) for ZBC8-3 are summarized in Table 2.
| Sample | Langmuir | Freundlich | ||||
|---|---|---|---|---|---|---|
| qm (mg g−1) | KL (L mg−1) | R2 | 1/n | KF (mg g−1) | R2 | |
| ZBC8-3 | 169.49 | 0.3181 | 0.9997 | 0.0378 | 136.58 | 0.9510 |
As shown in Table 2, the correlation coefficient of the Langmuir model adsorption isotherm plots was high (0.9997) for the ZBC8-3. The high R2 suggested that the Langmuir model fitted the adsorption data well. The homogeneous nature of the active sites on the adsorbents might have favored a monolayer removal behavior of Cu(II) ions on ZBC8-3.30
3.5 Comparison with other adsorbents
The removal capacity (qm) for Cu(II) on ZBC8-3 obtained herein was comparable with those reported in the literature for other adsorbents (Table 3). ZBC8-3 showed promising results for the removal of Cu(II) from aqueous solutions (i.e., a relatively high removal capacity).| Adsorbents | pH | Concentration range (mg L−1) | Qmax (mg g−1) | Ref. |
|---|---|---|---|---|
| Functionalized magnetic nanoparticles | 5 | 10–100 | 34.08 | 31 |
| Mg–Al-D2EHPA | 5 | 100 | 68.66 | 32 |
| M-HAP/agar composite beads | 5 | 10–200 | 71.6 | 33 |
| Carbon aerogels | — | 0–400 | 86.27 | 22 |
| Sugarcane bagasse trimellitate | 5.5 | 60 | 67.84 | 34 |
| Bifunctional ordered mesoporous silica | 5 | 10–50 | 90.61 | 35 |
| Ph-PAni nanofibers | 5.3 | 6.4–64 | 5.29 | 36 |
| Magnetic nanoscale zerovalent iron assisted biochar | 6 | — | 30.37 | 37 |
| Chitosan enwrapping Fe3O4 and graphene oxide | 6 | 500 | 132 | 38 |
| ZBC8-3 | 5 | 50–250 | 169.49 | This study |
3.6 Adsorption mechanism
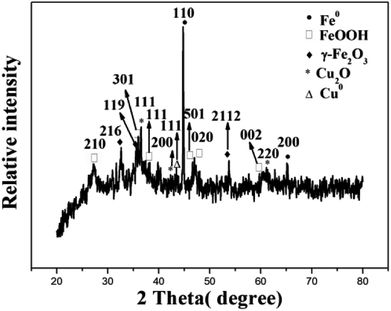
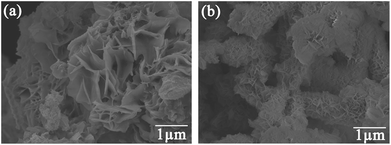
Fig. 8 shows the XRD pattern of ZBC8-3 after reaction with Cu(II). The characteristic diffraction peaks revealed the presence of Cu2O (JCPDS no. 05-0667),39 γ-Fe2O3 (JCPDS no. 25-1402)40, FeOOH (JCPDS no. 44-1415),41 Fe0 (JCPDS no. 06-0696)41 and Cu0 (JCPDS no. 04-0836).42 The 2θ diffraction peaks at 36.42, 42.30, and 61.34° corresponded to the crystal planes (111), (200), and (220) of Cu2O, respectively. The peaks at 32.17, 35.68, and 50.08° corresponded to the crystal planes (216), (119), and (2112) of γ-Fe2O3, respectively. The peaks at 27.04, 36.29, 38.07, 46.78, 46.91, and 60.26° were ascribed to the crystal planes (210), (301), (111), (501), (020), and (002) of FeOOH. In addition, the XRD pattern indicated the presence of Fe0 (2θ = 44.67 and 65.02°) and Cu0 (2θ = 43.30°). Therefore, from the results of Fig. 8, most of Cu(II) was reduced to Cu0 and Cu2O, while most of nZVI was converted to FeOOH and γ-Fe2O3. In addition, a fraction of nZVI did not react with Cu(II).Fig. 9 shows the SEM patterns of ZBC8-3 after reaction with Cu(II). ZBC8-3 was covered by the reaction products (e.g., Cu2O, Cu0, FeOOH, and γ-Fe2O3) on its surface. The original porous structure of ZBC8-3 was therefore blocked.
Fig. 10(a) shows the EDS patterns of ZBC8-3 before and after reaction with Cu(II). The results revealed that the amount of Fe on ZBC8-3 decreased after reaction with Cu(II) from 82.87 to 56.74 wt%. The amount of Cu on the surface of ZBC8-3 after reaction with Cu(II) was 19.95 wt%. As shown in Fig. 10(b), the maximum saturation magnetization of ZBC8-3 after reaction with Cu(II) was 77.6 emu g−1. Thus, the solid can be separated readily by using a magnet.
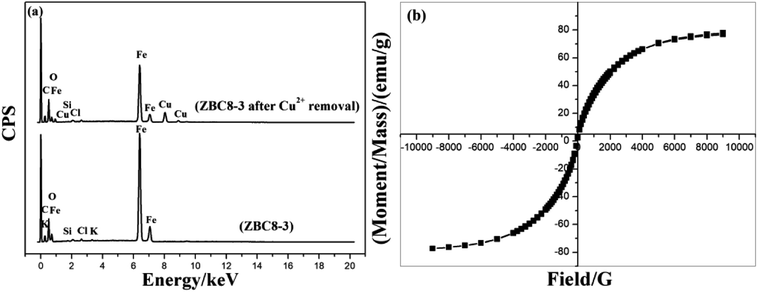 | ||
| Fig. 10 EDS pattern of ZBC8-3 before and after Cu(II) removal (a) and the magnetization curve of ZBC8-3 after Cu(II) removal (b). | ||
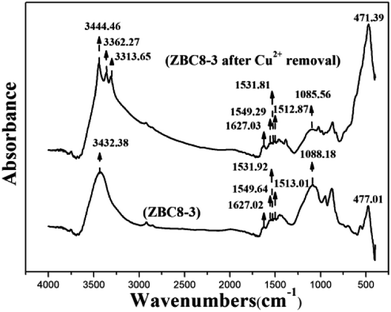
FTIR was used to study the molecular interactions and analyze the functional groups of ZBC8-3 before and after the Cu(II) removal process. As shown in Fig. 11, ZBC8-3 revealed a stretching vibration peak of O–H at 3432.58 cm−1,30 a stretching vibration peak of C![[double bond, length as m-dash]](https://www.rsc.org/images/entities/char_e001.gif) O at 1627.02 cm−1,43 stretching vibration peak of aromatic ring at 1549.64, 1531.92, and 1513.01 cm−1,44 stretching vibration peaks of C–O–C and Si–O at 1088.18 cm−1,45 and a bending vibration peak of Fe–O at 477.01 cm−1.46 The adsorption peak was characteristic of the Fe–O bond, possibly because part of Fe0 was oxidized during the grinding process. The FTIR spectra of ZBC8-3 after Cu(II) removal revealed that some adsorption peaks were slightly shifted. The stretching vibration peaks of the aromatic ring, C–O–C, and Si–O shifted to lower wavenumber, which might result from those functional groups being complexed with Cu(II). The increased ionic volume weakened the stretching and bending vibrations of the functional groups and caused the downfield shift.47 The O–H peak after Cu(II) removal was observed at longer wavenumbers than before the removal process. This shifting to higher wavenumbers may be attributed to an inductive effect.48 The wavelength of the C
O at 1627.02 cm−1,43 stretching vibration peak of aromatic ring at 1549.64, 1531.92, and 1513.01 cm−1,44 stretching vibration peaks of C–O–C and Si–O at 1088.18 cm−1,45 and a bending vibration peak of Fe–O at 477.01 cm−1.46 The adsorption peak was characteristic of the Fe–O bond, possibly because part of Fe0 was oxidized during the grinding process. The FTIR spectra of ZBC8-3 after Cu(II) removal revealed that some adsorption peaks were slightly shifted. The stretching vibration peaks of the aromatic ring, C–O–C, and Si–O shifted to lower wavenumber, which might result from those functional groups being complexed with Cu(II). The increased ionic volume weakened the stretching and bending vibrations of the functional groups and caused the downfield shift.47 The O–H peak after Cu(II) removal was observed at longer wavenumbers than before the removal process. This shifting to higher wavenumbers may be attributed to an inductive effect.48 The wavelength of the C![[double bond, length as m-dash]](https://www.rsc.org/images/entities/char_e001.gif) O peak hardly changed after Cu(II) removal. In addition, several new peaks ascribed to FeOOH appeared for ZBC8-3 after Cu(II) removal. (i.e., a bending vibration peak of Fe–O at 417.39 cm−146 and stretching vibration peaks of O–H at 3362.27 and 3313.65 cm−1)49.
O peak hardly changed after Cu(II) removal. In addition, several new peaks ascribed to FeOOH appeared for ZBC8-3 after Cu(II) removal. (i.e., a bending vibration peak of Fe–O at 417.39 cm−146 and stretching vibration peaks of O–H at 3362.27 and 3313.65 cm−1)49.
The XPS analysis of Cu in ZBC8-3 after reaction with Cu(II) is shown in Fig. 12(a) and (b). Each adsorption peak of Cu 2p3/2 and Cu 2p1/2 were deconvoluted into 2 peaks. The peaks at 932 and 952.1 eV could be ascribed to Cu2O and Cu0 species, respectively, while, the adsorption peaks at 933.5 and 954 eV could be ascribed to Cu(II) species. Auger electron spectroscopy was used to study Cu more in detail (Fig. 12(c)). With reference to the standard data, the adsorption peaks at 568, 568.5, and 570.9 eV could be ascribed to Cu0, Cu(II), and Cu2O species, respectively. The XPS analysis for C in ZBC8-3 is shown in Fig. 12(d). The adsorption peak at 283.1 eV could be ascribed to Si–C bond,50 the adsorption peak at 284.8 eV could be ascribed to C–C or C![[double bond, length as m-dash]](https://www.rsc.org/images/entities/char_e001.gif) C bonds,44,51 the adsorption peak at 286 eV can be produced by C–O bond, and the peak at 287.6 eV could be attributed to C
C bonds,44,51 the adsorption peak at 286 eV can be produced by C–O bond, and the peak at 287.6 eV could be attributed to C![[double bond, length as m-dash]](https://www.rsc.org/images/entities/char_e001.gif) O bonds.44,51 The XPS analysis for C in ZBC8-3 after reaction with Cu(II) is shown in Fig. 12(e). The binding energy of Si–C and C
O bonds.44,51 The XPS analysis for C in ZBC8-3 after reaction with Cu(II) is shown in Fig. 12(e). The binding energy of Si–C and C![[double bond, length as m-dash]](https://www.rsc.org/images/entities/char_e001.gif) O changed slightly before and after Cu(II) removal, which indicated that Si–C and C
O changed slightly before and after Cu(II) removal, which indicated that Si–C and C![[double bond, length as m-dash]](https://www.rsc.org/images/entities/char_e001.gif) O may not involve the removal of Cu(II). The binding energy of C
O may not involve the removal of Cu(II). The binding energy of C![[double bond, length as m-dash]](https://www.rsc.org/images/entities/char_e001.gif) C and C–O decreased significantly compared to those before the removal of Cu(II), which indicated that C
C and C–O decreased significantly compared to those before the removal of Cu(II), which indicated that C![[double bond, length as m-dash]](https://www.rsc.org/images/entities/char_e001.gif) C, C–O, and Cu(II) species could have formed a coordination compound. Thus, the binding energy of the functional groups was reduced owing to changes in the electronic densities of the groups in relation with their local environment.52
C, C–O, and Cu(II) species could have formed a coordination compound. Thus, the binding energy of the functional groups was reduced owing to changes in the electronic densities of the groups in relation with their local environment.52
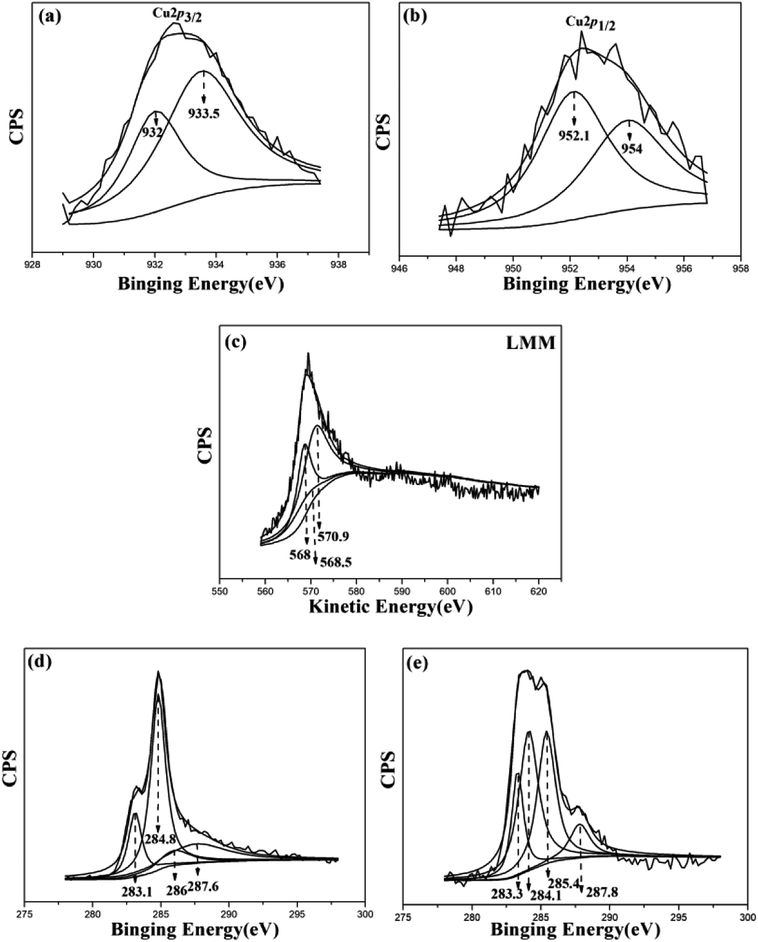 | ||
| Fig. 12 Cu2p3/2 for ZBC8-3 after Cu(II) removal (a), Cu 2p1/2 for ZBC8-3 after Cu(II) removal (b), Cu LMM for ZBC8-3 after Cu(II) removal (c), C 1s for ZBC8-3 before (d) and after (e) Cu(II) removal. | ||
3.7 The effect of other ions on the removal of Cu(II) on ZBC8-3
Fig. 13 shows the effect of other ions on the removal of Cu(II) over ZBC8-3. The Cu(II) removal rate of sample 2 was slightly lower than that of sample 1. Thus, nitrate showed a certain influence on the removal of Cu(II). The Cu(II) removal rates of samples 3 and 4 were lower than that of sample 2. Pb(II) and Co(II) ions showed a comparatively large influence on the removal of Cu(II). The Cu(II) removal rate of sample 5 decreased significantly, while the Cu(II) concentrations of samples 1, 2, 3, 4 and 5 were 0.35, 0.48, 0.59, 0.57 and 0.93 mg L−1 after Cu(II) removal, respectively. Since the standard electrode potential of E⊖ Cu2+/Cu (0.342 V) is higher than that of E⊖ Pb2+/Pb (−0.126 V) and E⊖ Co2+/Co (−0.28 V), Cu(II) ions are more easily reduced. Since the hygienic standard for drinking water in china requires that Cu(II) concentrations in drinking below 1 mg L−1, ZBC8-3 can be used to remove Cu(II) ions from wastewater.4. Conclusions
A nZVI biochar composite derived from cocoanut shell was fabricated by a calcination method by using FeCl3 as the iron precursor. The maximum saturation magnetization of ZBC8-3 before and after Cu(II) removal were 170.04 and 77.6 emu g−1, respectively, allowing easy separation of the solid after Cu(II) removal by using a magnet. The Cu(II) removal capacity of ZBC8-3 was as high as 169.49 mg g−1 because of its higher content of nZVI. Thus, this material can be used to remove Cu(II) ions from wastewater.Conflicts of interest
There are no conflicts.Acknowledgements
This work was supported by the Key Research and Development Project of Hainan Province of China (Project No. ZDYF2017102), Natural Science Foundation of Hainan Province of China (Project No. 20162032).References
- L. Qian, W. Zhang, J. Yan, L. Han, Y. Chen, D. Ouyang and M. Chen, Environ. Pollut., 2017, 223, 153–160 CrossRef CAS PubMed.
- X. Jiang, Z. Ouyang, Z. Zhang, C. Yang, X. Li, Z. Dang and P. Wu, Colloids Surf., A, 2018, 547, 64–72 CrossRef CAS.
- Z. Li, L. Wang, J. Meng, X. Liu, J. Xu, F. Wang and P. Brookes, J. Hazard. Mater., 2018, 344, 1–11 CrossRef CAS PubMed.
- L. Dong, L. Lin, Q. Li, Z. Huang, X. Tang, M. Wu, C. Li, X. Cao and M. Scholz, J. Environ. Manage., 2018, 213, 151–158 CrossRef CAS PubMed.
- C. Xu, W. Yang, W. Liu, H. Sun, C. Jiao and A.-j. Lin, J. Environ. Sci., 2017 DOI:10.1016/j.jes.2017.11.003.
- Y. Shao, P. Zhao, Q. Yue, Y. Wu, B. Gao and W. Kong, Ecotoxicol. Environ. Saf., 2018, 158, 100–107 CrossRef CAS PubMed.
- L. Zhou, R. Li, G. Zhang, D. Wang, D. Cai and Z. Wu, Chem. Eng. J., 2018, 339, 85–96 CrossRef CAS.
- D.-l. Kong, G.-p. Lu, M.-s. Wu, Z.-f. Shi and Q. Lin, ACS Sustainable Chem. Eng., 2017, 5, 3465–3470 CrossRef CAS.
- W. Shi and X. Song, Advances in Energy and Environmental Materials, 2018, pp. 885–895, DOI:10.1007/978-981-13-0158-2_89.
- C.-M. Liu, Z.-H. Diao, W.-Y. Huo, L.-J. Kong and J.-J. Du, Environ. Pollut., 2018, 239, 698–705 CrossRef CAS PubMed.
- Y. Sun, C. Lei, E. Khan, S. Chen, D. Tsang, Y. Ok, D. Lin, Y. Feng and X. Li, Sci. Total Environ., 2018, 615, 498–507 CrossRef CAS PubMed.
- D. W. Cho, G. Kwon, Y. S. Ok, E. E. Kwon and H. Song, ACS Appl. Mater. Interfaces, 2017, 9, 13142–13150 CrossRef CAS PubMed.
- C. Yu, M. Wang, X. Dong, Z. Shi, X. Zhang and Q. Lin, RSC Adv., 2017, 7, 53135–53144 RSC.
- Y. Guo, W. Tang, J. Wu, Z. Huang and J. Dai, J. Environ. Sci., 2014, 26, 2123–2130 CrossRef PubMed.
- L. Yan, S. Li, H. Yu, R. Shan, B. Du and T. Liu, Powder Technol., 2016, 301, 632–640 CrossRef CAS.
- T. F. Marinca, H. F. Chicinaş, B. V. Neamţu, O. Isnard and I. Chicinaş, J. Alloys Compd., 2015, 652, 313–321 CrossRef CAS.
- Y. Yin, M. Zeng, J. Liu, W. Tang, H. Dong, R. Xia and R. Yu, Sci. Rep., 2016, 6, 25075 CrossRef CAS PubMed.
- S. Zhang, L. Tao, M. Jiang, G. Gou and Z. Zhou, Mater. Lett., 2015, 157, 281–284 CrossRef CAS.
- Y. Tang, H. Zhang, J. Li, G. Hou, H. Cao, L. Wu, G. Zheng and Q. Wu, J. Alloys Compd., 2017, 719, 203–209 CrossRef CAS.
- C. Yu, J. Geng, Y. Zhuang, J. Zhao, L. Chu, X. Luo, Y. Zhao and Y. Guo, Carbohydr. Polym., 2016, 152, 327–336 CrossRef CAS PubMed.
- Z. Wang, Y. Cheng, K. Zhang, C. Hao, L. Wang, W. Li and B. Hu, Fuel, 2018, 232, 495–505 CrossRef CAS.
- L. I. U. Hong-Bo, L. I. Jin and Z. Lei, J. Inorg. Mater., 2017, 32, 1159 CrossRef.
- M. Li, Q. Liu, L. Guo, Y. Zhang, Z. Lou, Y. Wang and G. Qian, Bioresour. Technol., 2013, 141, 83–88 CrossRef CAS PubMed.
- N. Jiang, Y. Xu, Y. Dai, W. Luo and L. Dai, J. Hazard. Mater., 2012, 215–216, 17–24 CrossRef CAS PubMed.
- P. Regmi, J. L. Garcia Moscoso, S. Kumar, X. Cao, J. Mao and G. Schafran, J. Environ. Manage., 2012, 109, 61–69 CrossRef CAS PubMed.
- H. Tavakoli, H. Sepehrian and R. Cheraghali, J. Taiwan Inst. Chem. Eng., 2013, 44, 343–348 CrossRef CAS.
- M. Zhang, B. Gao, S. Varnoosfaderani, A. Hebard, Y. Yao and M. Inyang, Bioresour. Technol., 2013, 130, 457–462 CrossRef CAS PubMed.
- Y. Li, Q. Du, T. Liu, J. Sun, Y. Wang, S. Wu, Z. Wang, Y. Xia and L. Xia, Carbohydr. Polym., 2013, 95, 501–507 CrossRef CAS PubMed.
- L. Liu, Y. Wan, Y. Xie, R. Zhai, B. Zhang and J. Liu, Chem. Eng. J., 2012, 187, 210–216 CrossRef CAS.
- B. Wang, C. Li and H. Liang, Bioresour. Technol., 2013, 146, 803–806 CrossRef CAS PubMed.
- M. O. Ojemaye, O. O. Okoh and A. I. Okoh, Sep. Purif. Technol., 2017, 183, 204–215 CrossRef CAS.
- N. Rouahna, D. Barkat, A. Ouakouak and E. Srasra, J. Environ. Chem. Eng., 2018 DOI:10.1016/j.jece.2018.01.036.
- Q. Zhang, S. Dan and K. Du, Ind. Eng. Chem. Res., 2017, 56, 8705–8712 CrossRef CAS.
- A. L. P. Xavier, O. F. H. Adarme, L. M. Furtado, G. M. D. Ferreira, L. H. M. da Silva, L. F. Gil and L. V. A. Gurgel, J. Colloid Interface Sci., 2018, 516, 431–445 CrossRef CAS PubMed.
- S. J. Mousavi, M. Parvini and M. Ghorbani, J. Taiwan Inst. Chem. Eng., 2018, 84, 123–141 CrossRef CAS.
- H. J. Kim, S. Im, J. C. Kim, W. G. Hong, K. Shin, H. Y. Jeong and Y. J. Hong, ACS Sustainable Chem. Eng., 2017, 5, 6654–6664 CrossRef CAS.
- S. Zhu, S.-H. Ho, X. Huang, D. Wang, F. Yang, L. Wang, C. Wang, X. Cao and F. Ma, ACS Sustainable Chem. Eng., 2017, 5, 9673–9682 CrossRef CAS.
- D. Kong, N. Wang, N. Qiao, Q. Wang, Z. Wang, Z. Zhou and Z. Ren, ACS Sustainable Chem. Eng., 2017, 5, 7401–7409 CrossRef CAS.
- C. Liu, Y. H. Chang, J. Chen and S. P. Feng, ACS Appl. Mater. Interfaces, 2017, 9, 39027–39033 CrossRef CAS PubMed.
- X. Liu, W. Si, J. Zhang, X. Sun, J. Deng, S. Baunack, S. Oswald, L. Liu, C. Yan and O. G. Schmidt, Sci. Rep., 2014, 4, 7452 CrossRef CAS PubMed.
- P.-R. Liu, Z.-Y. Yang, Y. Hong and Y.-L. Hou, Algal Res., 2018, 31, 173–182 CrossRef.
- Z. Su, L. Tan, R. Yang, Y. Zhang, J. Tao, N. Zhang and F. Wen, Chem. Phys. Lett., 2018, 695, 153–157 CrossRef CAS.
- A. F. Hassan, A. M. Abdel-Mohsen and H. Elhadidy, Int. J. Biol. Macromol., 2014, 68, 125–130 CrossRef CAS PubMed.
- Q. Fang, B. Chen, Y. Lin and Y. Guan, Environ. Sci. Technol., 2014, 48, 279–288 CrossRef CAS PubMed.
- B. Zhou, Z. Wang, D. Shen, F. Shen, C. Wu and R. Xiao, Ecol. Eng., 2017, 98, 189–195 CrossRef.
- X. Wei, Q. Liu, H. Zhang, J. Liu, R. Chen, R. Li, Z. Li, P. Liu and J. Wang, J. Colloid Interface Sci., 2018, 511, 1–11 CrossRef CAS PubMed.
- G. R. Mahdavinia, S. Mousanezhad, H. Hosseinzadeh, F. Darvishi and M. Sabzi, Carbohydr. Polym., 2016, 147, 379–391 CrossRef CAS PubMed.
- Y. T. Zhou, C. Branford-White, H. L. Nie and L. M. Zhu, Colloids Surf., B, 2009, 74, 244–252 CrossRef CAS PubMed.
- L. Kuang, Y. Liu, D. Fu and Y. Zhao, J. Colloid Interface Sci., 2017, 490, 259–269 CrossRef CAS PubMed.
- Q. Zhao, Y. Huang and X. Hu, Electrochem. Commun., 2016, 70, 8–12 CrossRef CAS.
- J. M. Lázaro Martínez, E. Rodríguez-Castellón, R. M. T. Sánchez, L. R. Denaday, G. Y. Buldain and V. Campo Dall’ Orto, J. Mol. Catal. A: Chem., 2011, 339, 43–51 CrossRef.
- C. Bertagnolli, A. Uhart, J. C. Dupin, M. G. da Silva, E. Guibal and J. Desbrieres, Bioresour. Technol., 2014, 164, 264–269 CrossRef CAS PubMed.
| This journal is © The Royal Society of Chemistry 2018 |

